SlideShare una empresa de Scribd logo
1 de 11
DTZ Insight
Net Debt Funding Gap
Non-banks trigger surplus in core Europe
DTZ Research
6 June 2013
Contents
Introduction 2
Gross debt funding gap 3
Non-bank lenders 5
Net debt funding gap 7
Authors
Nigel Almond
Head of Strategy Research
+44 (0)20 3296 2328
nigel.almond@dtz.com
Hans Vrensen
Global Head of Research
+44 (0)20 3296 2159
hans.vrensen@dtz.com
 Over the next two years non-bank lenders are projected to more than bridge
the gross debt funding gap. This will lead to a surplus in a number leading core
European markets, such as the UK, France, Sweden and Germany (Figure 1). All
other markets remain exposed, most notably Spain, Ireland and Italy. By not
reallocating any surpluses, this leaves a USD50bn European net funding gap.
 In our updated analysis, Europe’s net refinancing gap has come down by 42%
compared to the USD86bn six months ago. The gross gap remains at USD163bn
reflecting a 16% decline over the same period. Increased writedowns and
redemptions in some markets have helped soften the regulatory impact.
 The level of refinancing required going forward will decline from a peak in
2013. The refinancing gap is expected to remain elevated in the near term
reflecting extension of loans originated at the peak of the market. Over the
longer term we expect the impacts to shrink with growth in non-bank lending
and as regulatory pressures force banks to work out their legacy loans.
 Despite a temporary slowdown in fund raisings in 2013, we do still expect more
growth in non-bank lending over the next three years. Their share of the
market is projected to be higher at 15% in the UK relative to Europe as a whole
(7%). Both remain well below the North American average of over 20%.
Surplus capacity in core markets will take time to be redirected to non-core
markets or re-priced. We expect these adjustments to happen over the next 2-
3 years. We see this as an important next phase in the European markets’
fundamental restructuring into a multi-channel funding model.
Figure 1
European gross and net debt funding gap, 2013-14, USD bn
-20
-10
0
10
20
30
 Gross debt funding gap  Non-bank lenders  Surplus/net debt funding
UK FR SE DE IT IE ES
Source: DTZ Research
Net Debt Funding Gap
www.dtz.com DTZ Insight 2
Introduction
This is the sixth issue in our Debt Funding Gap report series
and provides an update on our previous analysis released in
November 2012
1
.
In estimating the net debt funding gap, we adopt the same
four step approach as summarised below:
1. Estimate the refinancing gap based on refinancing
of maturing debt vintages
2. Add the impact of bank regulations to provide the
gross debt funding gap
3. Estimate the positive impact of non-bank lending
sources
4. Subtract the non-bank debt from the gross gap to
estimate the net debt funding gap
As in our previous report, our methodology for estimating
the base refinancing gap remains unchanged. It involves a
detailed analysis which takes into account:
 Vintage of outstanding loans
 Duration of loans by vintage
 Loan to value ratios by vintage
 Historic and future changes in collateral values, and
 Impact of loan extensions
Figure 2
Total outstanding debt to real estate, USD tn
0
2
4
6
8
2007 2008 2009 2010 2011 2012
Europe -4%
North America -2%
Asia Pacific 7%
2012 Growth
Global 0%
Source: DTZ Research
Our analysis remains focussed on the near term refinancing
gap as we have greater oversight on the likely trends in
future capital values and refinancing LTVs. Both these
inputs have a significant impact on the gap. Our model does
extend out over future years, which we present, though
there is greater uncertainty over the sizing of this gap.
Since our last report we have made adjustments to some of
the inputs based on discussions with our research and deal
teams locally and also updated information provided in the
De Montfort University survey on UK commercial property
lending
2
.
Our starting point this year is the outstanding debt to
commercial real estate (CRE) as at the end of 2012. This
includes lending by banks, covered bonds and CMBS. In
reflecting the evolution of the market we also account for
non-bank lenders. We exclude property company bonds as
these are not secured against direct assets. Overall, the
amount of debt held against CRE was marginally lower
globally (-1%) as a rise in Asia Pacific was more than offset
by falls in Europe and North America (Figure 2). As a result
we have seen the continued reduction in aggregate gearing,
also supported by rising equity values (Figure 3).
1
Net Debt Funding Gap, European gap to be bridged by 2015, UK ahead,
14 November 2012
2
The UK Commercial Property Lending Market Research Findings 2012
Mid-year
Figure 3
Total debt as a proportion of invested stock
40%
50%
60%
70%
80%
2000 2002 2004 2006 2008 2010 2012
Global
N.America
Europe
Asia Pacific
66%
59%
58%
54%
73%
64%
63%
55%
Source: DTZ Research
Net Debt Funding Gap
www.dtz.com DTZ Insight 3
Gross debt funding gap
Deleveraging underway in major markets
Compared to a year ago deleveraging is now well underway
in many major markets across the globe. Some of the
biggest reductions in debt against CRE have been in the UK,
Spain and Ireland (Figure 4); markets that we have
previously identified as having significant funding gaps. The
reduction reflects high levels of writedowns and/or
redemptions which has more than offset any new lending.
Reductions were also observed in Germany, the
Netherlands and Japan. Of the major markets, France sticks
out with a modest increase in outstanding debt.
UK, Spain and Japan have highest refinancing gaps
Despite the reduction in debt, the UK, Spain and Japan all
show significant refinancing gaps over the next two years
2013-14 (Figure 5). The remaining refinancing gap is mostly
across the rest of Europe, with Italy and Ireland showing
relatively high gaps when compared to Germany.
Regulatory burden high, but beginning to soften
We have previously highlighted the significant impact that
regulation will have on the funding gap. In our November
report we highlighted that regulation would more than
double Europe’s refinancing gap to a gross USD190bn as
banks could be forced to delever their loan books by over
7% by the end of 2013.
Estimates on the level of deleveraging have not been
updated by the IMF since our last report, so we have
assumed the same rate. Given that many banks have been
actively shrinking their CRE loan books (Figure 4) we have
allowed for this reduction in our analysis through stripping
out any reductions at a country level from the total 7.3%.
As a result the regulatory impact is now less than the
refinancing gap. The changes show that the UK, Spain, Italy
and Ireland are no longer impacted by this reduction given
their already high refinancing gaps. In contrast France,
Germany and the Netherlands all take significant hits.
Overall regulation adds USD77bn to Europe’s USD86bn
refinancing gap to a gross USD163bn (Figure 6).
We are aware of other regulations being put in place at a
local level, for example slotting in the UK and France. As
transparency is poor with regulators applying different
approaches both within and across different jurisdictions
modelling is not yet possible.
Figure 4
Change in outstanding debt against CRE in selected
markets, local currency, 2012
-6%
-3%
0%
3%
6%
Source: DTZ Research
Figure 5
Refinancing gap 2013-14, USD bn
0
10
20
30
Source: DTZ Research
Figure 6
European gross debt funding gap 2013-14, USD bn
0
30
60
90
120
150
180
0
10
20
30
40
 Refinanicing gap  Regulatory impact
Source: DTZ Research
Net Debt Funding Gap
www.dtz.com DTZ Insight 4
Deleveraging eases regulatory burden
Compared with our report in November, Europe’s gross
debt funding gap has shrunk by 14% to USD163bn (Figure
7). The reduction reflects falls in a number of key markets
including Germany, the UK, Italy, Spain and the
Netherlands. Despite these falls the gross debt funding gap
still remains elevated.
Countries with larger stock figures would be expected to
have larger funding gaps by virtue of their size. Comparing a
country’s funding gap with its stock provides a more
realistic measure. On this basis Ireland remains the most
exposed market on a relative basis, with its gross funding
gap at 6% of its stock (Figure 8). Spain also has a relatively
high exposure, with the UK, France and Germany close
behind. Despite having a relatively low gross funding gap,
Hungary has a high relative exposure of close to 6%.
Across Asia we see no major regulatory impacts as we do in
Europe. This largely reflects the lower or negligible
refinancing gaps. We outline the Asian markets in Figure 8
in brown, and these all sit below the European markets on a
relative basis. This includes Japan which has Asia’s largest,
though shrinking, gap.
Figure 7
Change in European gross debt funding gap, USD bn
0
50
100
150
200
0
10
20
30
40
Nov 12 May 13
Source: DTZ Research
Figure 8
Gross debt funding gap 2013-14, USD bn, and as a % of
stock
FR
DE
HU
IE
IT
NL
ES
UK
AU
JP
0%
3%
6%
9%
12%
0 5 10 15 20 25 30 35
%investedstock
Grossdebtfundinggap
Key
 Europe
 Asia
Source: DTZ Research
Net Debt Funding Gap
www.dtz.com DTZ Insight 5
Non-bank lenders
Non-banks step up lending but funds are delayed
As banks limit new lending or withdraw from markets
altogether we are seeing a growing number of non-bank
lenders entering the market. In our previous report, we
estimate there to be USD173bn of new lending capacity
from these non-bank lenders over the period 2013-15 from
an estimated 68 funds and insurance companies (Figure 9).
We have updated our estimate based on new market
entrants and updates on some of the existing funds and
insurers who were entering the market (see Table 1 for a
list of new market entrants over the last six months). The
majority of these funds are domiciled in the UK or US.
Although the majority are new funds, we do see some new
raising of funds by insurers seeking to target institutional
investors who may not have the platform or track records
from which to lend directly.
For insurers we have based our estimates on stated lending
targets. For funds we have used their stated equity raising
target. We have also made allowances for new entrants to
emerge over the next few years. In Box 1 (overleaf) we
outline the impact these new lenders have had on the
market to date and their likely share of activity over the
near term.
Overall, we expect the amount of new lending capacity to
be marginally higher at USD181bn from a total of 80 funds.
However, we have revised downwards our near term
expectations. This reflects lower capacity from funds as we
do not expect availability to be as strong as we previously
estimated. We expect there to be a pick-up in later years
ahead of our previous estimates, especially in 2015.
We believe that insurers are in pole position today to take
advantage of the market, representing more than half of
new lending capacity. We expect to see this proportion shift
and be more evenly balanced by 2015 (Figure 10).
Figure 9
Lending capacity from non-bank lenders, USD bn
0
25
50
75
100
2013 2014 2015
Nov 12 May 13
No Funds
Nov 12 = 68
May 13 = 80
Source: DTZ Research
Figure 10
Lending capacity by lender types
0%
25%
50%
75%
100%
2013 2014 2015
Funds
Insurers
Source: DTZ Research
Table 1
Emerging non-bank lenders
Lender Type Domicile Focus
AEW (UK) Fund UK UK
First Property Group Fund UK UK
Aviva Core Senior Fund Fund UK UK
Pacific Mutual Insurer US UK
ARES Capital Fund US Europe
Aalto Investment Fund UK Europe
Renshaw Bay Fund UK Europe
Source: DTZ Research
Net Debt Funding Gap
www.dtz.com DTZ Insight 6
Beyond the growth in new lenders, the appetite amongst
companies to tap into the bond markets has remained
strong. 2012 saw close to EUR15bn in new bond issuance in
line with our previous predictions. Already in the first
quarter this year we have seen issuance in excess of
EUR4bn, 15% ahead of Q1 2012. On this basis we expect
2013 issuance to rise above 2012 levels to around EUR17bn
(Figure 11).
We have also seen similar trends across Asia Pacific. Japan,
which has Asia’s largest gap, saw issuance grow 40% in 2012
to nearly USD5bn. Already in Q1 issuance was more than
double the level a year ago. Assuming growth of 50% this
year would lead to an additional USD7bn of lending
capacity.
Figure 11
Bond issuance by European property companies, EUR bn
0
3
6
9
12
15
18
2006 2007 2008 2009 2010 2011 2012 2013 2014
Q1 Q2 Q3 Q4 Forecast
Source: Bloomberg, DTZ Research
Box 1. Trends in non-bank lending
Compared to North America the European lending market is dominated by banks. Over three quarters of lending in Europe
has been provided by banks (Figure 12). Banks in North America make-up around half of lending, with non-banks, notably
life insurers accounting for up to 20% or more, with a similar proportion from CMBS (Figure 12). Lending from insurers has
been limited to just a handful of lenders across Europe and their share has to date been relatively small, albeit growing.
This reflects a broader range of lenders, including the arrival of US insurers such as TIAA CREF and Mass Mutual
(Cornerstone), with traditional European insurers such as AXA, Allianz and Aviva stepping up lending. Sales of both
performing and non-performing loans has also led to the entry of private equity funds, with other new funds seeking to
raise for both senior and junior lending. As a result non-banks’ share has risen to 2% in Europe and an even higher 7% share
in the UK.
Looking forward, assuming 75% of non-bank lending capacity is for new loans and that any new lending by banks is offset
by deleveraging, we can estimate future market shares. On this basis non-banks increase their market share to 15% in the
UK over the next three years and 7% in Europe (Figure 13). This is still short of the 23% average in North America.
Figure 12
Outstanding debt by lender type, YE 2012
0%
25%
50%
75%
100%
North
America
Europe Asia Pacific UK
Banks
Non-banks
CMBS
Covered bonds
Source: DTZ Research
Figure 13
Non-bank lenders market share
0%
5%
10%
15%
20%
UK only European total
Forecast
Source: DTZ Research
Net Debt Funding Gap
www.dtz.com DTZ Insight 7
Net debt funding gap
Gap eroding in major markets
In analysing the market going forward we have estimated
the likely target focus of the non-bank lenders at a country
level. With bond issuance able to cover much of the gap in
Asia Pacific, the focus of this section is on Europe where we
see the biggest challenges.
For the major European markets of the UK, France and
Germany we have made estimates on capital targeting
them based on stated preferences. For the remaining
markets we have estimated their share based on the
relative size of their debt markets. For bonds we have
apportioned according to trends in raising over 2012. We
have also made allowances for the major investors whose
portfolios span across Europe.
Based on this analysis, we estimate that new non-bank
lenders could provide sufficient new lending capacity to
erode the gross funding gap in the UK, France, Sweden and
Germany to zero, with more than sufficient capacity across
the UK and France (Figure 14). This reflects the relative size
of these markets which benefit from major domestic
insurers and funds who are mainly focused on their home
market.
Spain most exposed on a net basis
In Spain we see more limited new lending capacity or bond
issuance, which still leaves a significant USD17bn net
funding gap over the next two years (Figure 15). With
transfers to SAREB completed at the beginning of this year
we could see further progress in bank writedowns helping
to shrink this gap. Other markets showing marginal risks
include Ireland, Italy and the Netherlands. With many Dutch
banks under state control we expect government pressures
to force further deleveraging. We also expect NAMA to
accelerate the work out of loans in Ireland.
Looking across other markets in Europe, we can compare
the gross and net funding gaps relative to the size of
outstanding debt (Figure 16). Those markets below the
horizontal dashed line have below average net debt funding
gaps. These include the UK, France and Germany, despite
having high gross gaps. Spain is highlighted in the top right
as being most exposed. This highlights the need for further
deleveraging in the country, although a shift of further
assets into SAREB may ease some of these burdens.
Figure 14
European gross and net debt funding gap 2013-14, USD bn
-20
-10
0
10
20
30
 Gross debt funding gap  Non-bank lenders  Surplus/net debt funding
UK FR SE DE IT IE ES
Source: DTZ Research
Figure 15
Surplus and net debt funding gap, USD bn, 2013-14
-15
-10
-5
0
5
10
15
20
Source: DTZ Research
Figure 16
Gross and net debt funding gap compared to debt
outstanding, USD bn
FR
DE
IT
NL
RU
ES
NO SE
IE
UK
100
250
-5
0
5
10
15
20
25
0 5 10 15 20 25 30 35 40
Netdebtfundinggap
Gross debt funding gap
US
JP
CN
ES
DE
Outstanding debt
USDbn
Source: DTZ Research
Net Debt Funding Gap
www.dtz.com DTZ Insight 8
Surplus to shift to non-core markets
For Europe as a whole we see progress in plugging the gap,
with Europe’s gap eroding to a net USD50bn, or 30% of its
gross level (Figure 17).
As we more closely assess the impact across each market,
we expect that the bigger, core lending markets are likely to
benefit more in the short term from this trend. Surplus
capacity in some of these core markets will likely take some
time to be re-directed or re-priced. But we do expect this
adjustment to happen in the next 2-3 years. We see this as
an important next phase in the European markets’
fundamental restructuring into a multi-channel funding
model. With an additional USD124bn of equity capital
available, combined this should be more than sufficient to
bridge the gap, particularly given a high proportion of this is
directed at non-core assets
3
.
End in sight, but tail of workout will last longer
As we move forward we see reasons to be positive that an
end is in sight for the funding gap. We see a shrinking
refinancing profile across Europe, falling from over
USD300bn this year to USD265bn by 2016 (Figure 18). We
would expect this to taper away further reflecting the
recent reduction in loan extensions.
Despite this fall, we still see an increase in the refinancing
gap over the near term (Figure 19). This reflects loans
originated or refinanced at the peak of the market and that
have subsequently extended in recent years. It also reflects
limited growth in values that we expect in the near term,
with values falling in some markets.
Regulation forces deleveraging
Given the recent growth in alternative lending sources and
the availability of sufficient equity capital, we would expect
this to be more than sufficient to bridge the gap. We expect
the core European markets to be ahead of the curve as
banks actively seek to reduce their balance sheets and
manage the cost of holding problematic loans on their
balance sheets. Regulatory pressures will also force banks
into working out problematic loans as the capital needed to
set aside for loans increases. This will lead to further pain
and writedowns over the coming years and the likelihood of
increasing foreclosures as the economic environment
improves. This would be consistent with behaviours in
previous cycles.
3
Great Wall of Money, More cross border and non-core coming next, 22
March 2013
Figure 17
European net debt funding gap 2013-14, USD bn
0
30
60
90
120
150
180
Gross debt
funding gap
Non-bank
lenders
Net debt
funding
gap
Available
equity
Refinancing
Regulation
Insurers
Funds
Bonds
Net gap
Source: DTZ Research
Figure 18
European refinancing requirements, USD bn
0
50
100
150
200
250
300
350
2013 2014 2015 2016
Source: DTZ Research
Figure 19
European refinancing gap 2013-16, USD bn
0
10
20
30
40
50
60
2013 2014 2015 2016
UK
Rest ofEurope
Spain
France
Germany
Italy
Ireland
Source: DTZ Research
Net Debt Funding Gap
www.dtz.com DTZ Insight 9
We also expect to see more activity in markets such as the
Netherlands where the state has been proactive in
providing support to the banking sector and pressures will
be greatest to manage solutions. In more exposed markets
such as Ireland and in particular Spain, which is only just
establishing its bad bank, we see more of a tail risk. With a
longer work-out of loans this may impact the speed of
recovery.
Greater transparency required on regulation
Whilst we see a step-up in the regulations, there remains a
lack of transparency both across and within jurisdictions.
Given the scale of the crisis over recent years, regulators
and other market authorities have a clear chance to
enhance their stewardship of banks and other lenders in
their markets. A transparent and coordinated approach
across Europe would seem a sensible solution going
forward.
Growth in loan sales as lot sizes reduce
Over the past six months we have seen the continued use of
loan sales by banks as a means of deleveraging and ensuring
they are adequately capitalised. As expected the typical size
of loan sales has shrunk over the past three months
reflecting the limited appetite amongst investors for billion
sized loan portfolios.
By reducing the typical portfolio size, banks are able to
increase the target investor base. The resulting competition
combined with more selective portfolios means the typical
discounts are generally remaining at or below 50% for the
better performing loans and the trend for discounts across
the board has been reducing over the course of this year
(Figure 20). There are occasionally steeper discounts
applied on non-performing loans.
We see the continued use of loan sales by banks over the
course of this year, with a number of key portfolios
currently on the market. Some of these are more sizeable,
reflecting the desire of some banks to completely withdraw
from lending altogether or from specific markets (Table 2).
Although this does not remove the debt burden completely,
by transferring loans to more opportunistic funds, we
expect to see further writedowns across the banking sector
and the likelihood of an accelerated workout.
Figure 20
Growth in loan sales, EUR bn and discounts to face value
0%
25%
50%
75%
100%
0
5
10
15
20
25
Cum. value of loans (LHS) Discount ─ Trend
Source: DTZ Research
Table 2
Key pending loan sales
Lender Size Comment
Co-Op £2.1bn UK loan book
Deutsche
Postbank
£2.5bn Mostly UK loan book
Eurohypo £4bn UK loan book
AIB £200m UK hotel loans
IBRC €18.7bn UK and Irish loans
Source: DTZ Research
Net Debt Funding Gap
www.dtz.com DTZ Insight 10
Other DTZ Research Reports
Other research reports can be downloaded from www.dtz.com/research. These include:
Occupier Perspective
Updates on occupational markets from an occupier
perspective, with commentary, analysis, charts and data.
Global Occupancy Costs Offices
Obligations of Occupation Americas
Obligations of Occupation Asia Pacific
Obligations of Occupation EMEA
Office Occupier Review Asia Pacific
Office Occupier Review Europe
The TMT Sector - October 2012
The European Insurance Sector - June 2012
Property Times
Regular updates on occupational markets from a landlord
perspective, with commentary, charts, data and forecasts.
Coverage includes Asia Pacific, Bangkok, Beijing, Berlin,
Brisbane, Bristol, Brussels, Budapest, Central London,
Chengdu, Chongqing, Dalian, Edinburgh, Europe, Frankfurt,
Glasgow, Guangzhou, Hangzhou, Ho Chi Minh City, Hong
Kong, India, Jakarta, Japan, Kuala Lumpur, Luxembourg,
Madrid, Manchester, Melbourne, Milan, Nanjing,
Newcastle, Paris, Poland, Prague, Qingdao, Rome, Seoul,
Shanghai, Shenyang, Shenzhen, Singapore, Stockholm,
Sydney, Taipei, Tianjin, Ukraine, Warsaw, Wuhan, Xian.
Investment Market Update
Regular updates on investment market activity, with
commentary, significant deals, charts, data and forecasts.
Coverage includes Asia Pacific, Australia, Belgium, Czech
Republic, Europe, France, Germany, Italy, Japan, Mainland
China, South East Asia, Spain, Sweden and the UK.
Money into Property
For nearly 40 years, this has been DTZ's flagship research
report, analysing invested stock and capital flows into real
estate markets across the world. It measures the
development and structure of the global investment
market. Available for Global, Asia Pacific, Europe, North
America and UK.
Foresight & Outlook
Quarterly commentary, analysis and insight into our in-
house data forecasts, including the DTZ Fair Value Index™.
Available for the following regions: Global, Asia Pacific,
Europe and in the UK. In addition, we have been publishing
our Annual Global Outlook report for the last three years.
This report provides a concise market outlook for the year
ahead and is presented to key client audiences around the
globe.
Insight
Thematic, ad hoc, topical and thought leading reports on
areas and issues of specific interest and relevance to real
estate markets.
China Healthcare – April 2013
European Sustainability Guide – April 2013
Great Wall of Money – March 2013
European Retail Guide - Shopping Centres – March 2013
China Property Market Sentiment Survey - January 2013
India Special Economic Zones - December 2012
Singapore Executive Condominiums - December 2012
UK Secondary market pricing - December 2012
Singapore office demand - December 2012
China Ecommerce & Logistics - November 2012
Net Debt Funding Gap - November 2012
German Open Ended Funds - October 2012
DTZ Research Data Services
The following data is available for subscription.
Please contact graham.bruty@dtz.com for
more information.
 Property Market Indicators
Time series of commercial property market
data in Asia Pacific and Europe.
 Real Estate Forecasts, including the DTZ
Fair Value Index
TM
Five-year rolling forecasts of over 200
commercial property markets in Asia Pacific,
Europe and the USA.
 Investment Transaction Database
Aggregated overview of investment activity
in Asia Pacific and Europe.
 Money into Property
Data covering capital flows, size, structure,
ownership, developments and findings of
annual investor and lender surveys.
www.dtz.com DTZ Insight 11
DTZ Research
DTZ Research Contacts
Global Head of Research
Hans Vrensen
Phone: +44 (0)20 3296 2159
Email: hans.vrensen@dtz.com
Head of Strategy Research
Nigel Almond
Phone: +44 (0)20 3296 2328
Email: nigel.almond@dtz.com
Global Head of Forecasting
Fergus Hicks
Phone: +44 (0)20 3296 2307
Email: fergus.hicks@dtz.com
Head of Asia Pacific Forecasting
Kate Barrow
Phone: +852 2250 8864
Email: kate.barrow@dtz.com
Head of Research Information Management
Graham Bruty
Phone: +44 (0)20 3296 2297
Email: graham.bruty@dtz.com
Head of CEMEA Research
Magali Marton
Phone: + 33 1 49 64 49 54
Email: magali.marton@dtz.com
Head of SEA & ANZ Research
Dominic Brown
Phone: +61 (0)2 8243 9999
Email: dominic.brown@dtz.com
Head of Americas Research
John Wickes
Phone: +1 312 424 8087
Email: john.wickes@na.ugllimited.com
DTZ Business Contacts
Head of Valuation EMEA
Bryn Williams
Phone: +44 (0)20 3296 4474
Email: bryn.williams@dtz.com
Head of Valuation UK
Charles Smith
Phone: +44 (0)20 3296 4411
Email: charles.smith@dtz.com
Head of Valuation Netherlands
Jacques Boeve
Phone: +31 (0)20 8 407 262
Email: jacques.boeve@dtz.com
Head of Valuation Germany
Klaus Dallafina
Phone: +49 (0)69 92 100 400
Email: klaus.dallafina@dtz.com
Head of Valuation France
Jean-Philippe Carmarans
Phone: + 33 1 47 48 77 24
Email: jean-philippe.carmarans@dtz.com
Debt Solutions Coordinator
Tom Nuttall
Phone: +44 (0)20 3296 4571
Email: tom.nuttall@dtz.com
Debt Solutions Ireland
Maurice O’Neill
Phone: +353 1 6399657
Email: maurice.oneill@dtz.ie
Debt Solutions London
Fergus Jack
Phone: +44 (0)20 3296 4494
Email: fergus.jack@dtz.com
Debt Solutions UK Regions
Richard Murphy
Phone: +44 (0)29 2026 2235
Email: richard.murphy@dtz.com
Debt Solutions Netherlands
Patrick Steenstra Toussaint
Phone: +31 20 571 1427
Email: patrick.steenstratoussaint@dtz.com
DISCLAIMER
This report should not be relied upon as a basis for entering into transactions without seeking specific,
qualified, professional advice. Whilst facts have been rigorously checked, DTZ can take no
responsibility for any damage or loss suffered as a result of any inadvertent inaccuracy within this
report. Information contained herein should not, in whole or part, be published, reproduced or
referred to without prior approval. Any such reproduction should be credited to DTZ.
© DTZ June 2013

Más contenido relacionado

La actualidad más candente

M&A Deals in Eastern European Countries-2013
M&A Deals in Eastern European Countries-2013M&A Deals in Eastern European Countries-2013
M&A Deals in Eastern European Countries-2013Shiv ognito
 
US lead the M&A surge, but confidence hits European dealmakers
US lead the M&A surge, but confidence hits European dealmakersUS lead the M&A surge, but confidence hits European dealmakers
US lead the M&A surge, but confidence hits European dealmakersDeloitte UK
 
The Deloitte M&A Index 2016
The Deloitte M&A Index 2016The Deloitte M&A Index 2016
The Deloitte M&A Index 2016Deloitte UK
 
Tricumen 1 Q12 Results Update Public
Tricumen 1 Q12 Results Update PublicTricumen 1 Q12 Results Update Public
Tricumen 1 Q12 Results Update Publicsebwalker
 
Tricumen / RWA dynamics FY11-FY14E_070115 open
Tricumen / RWA dynamics FY11-FY14E_070115 openTricumen / RWA dynamics FY11-FY14E_070115 open
Tricumen / RWA dynamics FY11-FY14E_070115 openTricumen Ltd
 
Buyouts September 2009_Panel_Case
Buyouts September 2009_Panel_CaseBuyouts September 2009_Panel_Case
Buyouts September 2009_Panel_Caseandrzejbinkowski
 
Tricumen 2Q12 Results Update Public
Tricumen 2Q12 Results Update PublicTricumen 2Q12 Results Update Public
Tricumen 2Q12 Results Update Publicsebwalker
 
Intrum Justitia: Informe Índice de Pagos 2012
Intrum Justitia: Informe Índice de Pagos 2012Intrum Justitia: Informe Índice de Pagos 2012
Intrum Justitia: Informe Índice de Pagos 2012FIAB
 
2016 Financial Services M&A Predictions: Rising to the challenge
2016 Financial Services M&A Predictions: Rising to the challenge2016 Financial Services M&A Predictions: Rising to the challenge
2016 Financial Services M&A Predictions: Rising to the challengeDeloitte UK
 
Fasanara Capital | Investment Outlook | May 3rd 2013
Fasanara Capital | Investment Outlook | May 3rd 2013Fasanara Capital | Investment Outlook | May 3rd 2013
Fasanara Capital | Investment Outlook | May 3rd 2013Fasanara Capital ltd
 
The Deloitte M &A Index Q4 2015 infographic
The Deloitte M &A Index Q4 2015 infographicThe Deloitte M &A Index Q4 2015 infographic
The Deloitte M &A Index Q4 2015 infographicDeloitte UK
 
Italian banking-foundations-2014-02-05-1
Italian banking-foundations-2014-02-05-1Italian banking-foundations-2014-02-05-1
Italian banking-foundations-2014-02-05-1Lavoce.info
 
Tricumen_3Q11 Sector Review Public
Tricumen_3Q11 Sector Review PublicTricumen_3Q11 Sector Review Public
Tricumen_3Q11 Sector Review Publicsebwalker
 
The Deloitte M&A Index 2016
The Deloitte M&A Index 2016The Deloitte M&A Index 2016
The Deloitte M&A Index 2016Deloitte UK
 

La actualidad más candente (19)

Speech ref+gp apc 13
Speech ref+gp apc 13Speech ref+gp apc 13
Speech ref+gp apc 13
 
M&A Deals in Eastern European Countries-2013
M&A Deals in Eastern European Countries-2013M&A Deals in Eastern European Countries-2013
M&A Deals in Eastern European Countries-2013
 
US lead the M&A surge, but confidence hits European dealmakers
US lead the M&A surge, but confidence hits European dealmakersUS lead the M&A surge, but confidence hits European dealmakers
US lead the M&A surge, but confidence hits European dealmakers
 
The Deloitte M&A Index 2016
The Deloitte M&A Index 2016The Deloitte M&A Index 2016
The Deloitte M&A Index 2016
 
Tricumen 1 Q12 Results Update Public
Tricumen 1 Q12 Results Update PublicTricumen 1 Q12 Results Update Public
Tricumen 1 Q12 Results Update Public
 
Tricumen / RWA dynamics FY11-FY14E_070115 open
Tricumen / RWA dynamics FY11-FY14E_070115 openTricumen / RWA dynamics FY11-FY14E_070115 open
Tricumen / RWA dynamics FY11-FY14E_070115 open
 
Buyouts September 2009_Panel_Case
Buyouts September 2009_Panel_CaseBuyouts September 2009_Panel_Case
Buyouts September 2009_Panel_Case
 
Tricumen 2Q12 Results Update Public
Tricumen 2Q12 Results Update PublicTricumen 2Q12 Results Update Public
Tricumen 2Q12 Results Update Public
 
Oei dec-15
Oei dec-15Oei dec-15
Oei dec-15
 
Intrum Justitia: Informe Índice de Pagos 2012
Intrum Justitia: Informe Índice de Pagos 2012Intrum Justitia: Informe Índice de Pagos 2012
Intrum Justitia: Informe Índice de Pagos 2012
 
2016 Financial Services M&A Predictions: Rising to the challenge
2016 Financial Services M&A Predictions: Rising to the challenge2016 Financial Services M&A Predictions: Rising to the challenge
2016 Financial Services M&A Predictions: Rising to the challenge
 
Fasanara Capital | Investment Outlook | May 3rd 2013
Fasanara Capital | Investment Outlook | May 3rd 2013Fasanara Capital | Investment Outlook | May 3rd 2013
Fasanara Capital | Investment Outlook | May 3rd 2013
 
Volatility
VolatilityVolatility
Volatility
 
The Deloitte M &A Index Q4 2015 infographic
The Deloitte M &A Index Q4 2015 infographicThe Deloitte M &A Index Q4 2015 infographic
The Deloitte M &A Index Q4 2015 infographic
 
HFJ Article sep10
HFJ Article sep10HFJ Article sep10
HFJ Article sep10
 
Italian banking-foundations-2014-02-05-1
Italian banking-foundations-2014-02-05-1Italian banking-foundations-2014-02-05-1
Italian banking-foundations-2014-02-05-1
 
Tricumen_3Q11 Sector Review Public
Tricumen_3Q11 Sector Review PublicTricumen_3Q11 Sector Review Public
Tricumen_3Q11 Sector Review Public
 
The Deloitte M&A Index 2016
The Deloitte M&A Index 2016The Deloitte M&A Index 2016
The Deloitte M&A Index 2016
 
Italian_NPLs
Italian_NPLsItalian_NPLs
Italian_NPLs
 

Destacado

Elizabeth marin saavedra
Elizabeth marin saavedraElizabeth marin saavedra
Elizabeth marin saavedramarin1993
 
VIII Encuentro Empresarial Iberoamericano
VIII Encuentro Empresarial IberoamericanoVIII Encuentro Empresarial Iberoamericano
VIII Encuentro Empresarial IberoamericanoLLYC
 
El clima y los factores que influyen.
El clima y los factores que influyen.El clima y los factores que influyen.
El clima y los factores que influyen.MaestraAlicia
 
Emanuelson don camby
Emanuelson don cambyEmanuelson don camby
Emanuelson don cambydoncamby
 
Opening the "GAIT" for Future Academic Advisors: Developing a Meaningful Grad...
Opening the "GAIT" for Future Academic Advisors: Developing a Meaningful Grad...Opening the "GAIT" for Future Academic Advisors: Developing a Meaningful Grad...
Opening the "GAIT" for Future Academic Advisors: Developing a Meaningful Grad...Margaret G. Garry
 

Destacado (8)

Elizabeth marin saavedra
Elizabeth marin saavedraElizabeth marin saavedra
Elizabeth marin saavedra
 
Sheldon Good
Sheldon GoodSheldon Good
Sheldon Good
 
VIII Encuentro Empresarial Iberoamericano
VIII Encuentro Empresarial IberoamericanoVIII Encuentro Empresarial Iberoamericano
VIII Encuentro Empresarial Iberoamericano
 
ALK-olades
ALK-oladesALK-olades
ALK-olades
 
El clima y los factores que influyen.
El clima y los factores que influyen.El clima y los factores que influyen.
El clima y los factores que influyen.
 
Emanuelson don camby
Emanuelson don cambyEmanuelson don camby
Emanuelson don camby
 
Business Inhabituel Company Profile-1
Business Inhabituel Company Profile-1Business Inhabituel Company Profile-1
Business Inhabituel Company Profile-1
 
Opening the "GAIT" for Future Academic Advisors: Developing a Meaningful Grad...
Opening the "GAIT" for Future Academic Advisors: Developing a Meaningful Grad...Opening the "GAIT" for Future Academic Advisors: Developing a Meaningful Grad...
Opening the "GAIT" for Future Academic Advisors: Developing a Meaningful Grad...
 

Similar a Dtz insight net debt funding gap june 2013

Dtz money into_property_2013_global
Dtz money into_property_2013_globalDtz money into_property_2013_global
Dtz money into_property_2013_globalWorld Office Forum
 
2012 global credit outlook sovereign debt problems weigh on a mostly tepid fo...
2012 global credit outlook sovereign debt problems weigh on a mostly tepid fo...2012 global credit outlook sovereign debt problems weigh on a mostly tepid fo...
2012 global credit outlook sovereign debt problems weigh on a mostly tepid fo...Pim Piepers
 
Deloitte_Deleveraging-Europe_2015-2016
Deloitte_Deleveraging-Europe_2015-2016Deloitte_Deleveraging-Europe_2015-2016
Deloitte_Deleveraging-Europe_2015-2016Ethos Media S.A.
 
BIHC Briefing Greece March 2024, with Crédit Agricole CIB
BIHC Briefing Greece March 2024, with Crédit Agricole CIBBIHC Briefing Greece March 2024, with Crédit Agricole CIB
BIHC Briefing Greece March 2024, with Crédit Agricole CIBNeil Day
 
TheAdvisory_Sept2015_vFINAL
TheAdvisory_Sept2015_vFINALTheAdvisory_Sept2015_vFINAL
TheAdvisory_Sept2015_vFINALMalcolm Fitch
 
Global Powers of Consumer Products 2013
Global Powers of Consumer Products 2013Global Powers of Consumer Products 2013
Global Powers of Consumer Products 2013Melih ÖZCANLI
 
Standard poorstakesvariousratingactionson16eurozonesovereigngovernments spm
Standard poorstakesvariousratingactionson16eurozonesovereigngovernments spmStandard poorstakesvariousratingactionson16eurozonesovereigngovernments spm
Standard poorstakesvariousratingactionson16eurozonesovereigngovernments spmFreelance
 
Sebnem Kalemli Özcan - Debt Overhang, Rollover Risk, and Corporate Investment...
Sebnem Kalemli Özcan - Debt Overhang, Rollover Risk, and Corporate Investment...Sebnem Kalemli Özcan - Debt Overhang, Rollover Risk, and Corporate Investment...
Sebnem Kalemli Özcan - Debt Overhang, Rollover Risk, and Corporate Investment...Structuralpolicyanalysis
 
Deloitte covid 19 economic impact tracker - 2
Deloitte covid 19 economic impact tracker - 2Deloitte covid 19 economic impact tracker - 2
Deloitte covid 19 economic impact tracker - 2Deloitte UK
 
Putnam Perspectives: Capital Market Outlook Q1 2014
Putnam Perspectives: Capital Market Outlook Q1 2014Putnam Perspectives: Capital Market Outlook Q1 2014
Putnam Perspectives: Capital Market Outlook Q1 2014Putnam Investments
 
Euro crisis
Euro crisisEuro crisis
Euro crisisRS P
 
Fiscal multipliers and foreign holdings of public debt - working paper
Fiscal multipliers and foreign holdings of public debt - working paperFiscal multipliers and foreign holdings of public debt - working paper
Fiscal multipliers and foreign holdings of public debt - working paperADEMU_Project
 
2014.10 ethenea-market-commentary-ethna-aktiv-e
2014.10 ethenea-market-commentary-ethna-aktiv-e2014.10 ethenea-market-commentary-ethna-aktiv-e
2014.10 ethenea-market-commentary-ethna-aktiv-eFrank Ragol
 
Swmcef dec 2013_ucits_fund
Swmcef dec 2013_ucits_fundSwmcef dec 2013_ucits_fund
Swmcef dec 2013_ucits_fundFrank Ragol
 
Derrill allatt sovereign debt
Derrill allatt sovereign debtDerrill allatt sovereign debt
Derrill allatt sovereign debticgfmconference
 

Similar a Dtz insight net debt funding gap june 2013 (20)

Dtz money into_property_2013_global
Dtz money into_property_2013_globalDtz money into_property_2013_global
Dtz money into_property_2013_global
 
MTBiz September 2014
MTBiz September 2014MTBiz September 2014
MTBiz September 2014
 
2012 global credit outlook sovereign debt problems weigh on a mostly tepid fo...
2012 global credit outlook sovereign debt problems weigh on a mostly tepid fo...2012 global credit outlook sovereign debt problems weigh on a mostly tepid fo...
2012 global credit outlook sovereign debt problems weigh on a mostly tepid fo...
 
Deloitte_Deleveraging-Europe_2015-2016
Deloitte_Deleveraging-Europe_2015-2016Deloitte_Deleveraging-Europe_2015-2016
Deloitte_Deleveraging-Europe_2015-2016
 
BIHC Briefing Greece March 2024, with Crédit Agricole CIB
BIHC Briefing Greece March 2024, with Crédit Agricole CIBBIHC Briefing Greece March 2024, with Crédit Agricole CIB
BIHC Briefing Greece March 2024, with Crédit Agricole CIB
 
CASE Network Studies and Analyses 421 - Complementarities between barriers to...
CASE Network Studies and Analyses 421 - Complementarities between barriers to...CASE Network Studies and Analyses 421 - Complementarities between barriers to...
CASE Network Studies and Analyses 421 - Complementarities between barriers to...
 
TheAdvisory_Sept2015_vFINAL
TheAdvisory_Sept2015_vFINALTheAdvisory_Sept2015_vFINAL
TheAdvisory_Sept2015_vFINAL
 
Global Powers of Consumer Products 2013
Global Powers of Consumer Products 2013Global Powers of Consumer Products 2013
Global Powers of Consumer Products 2013
 
EIU Global Forecast Report Q4/2020
EIU Global Forecast Report Q4/2020EIU Global Forecast Report Q4/2020
EIU Global Forecast Report Q4/2020
 
Standard poorstakesvariousratingactionson16eurozonesovereigngovernments spm
Standard poorstakesvariousratingactionson16eurozonesovereigngovernments spmStandard poorstakesvariousratingactionson16eurozonesovereigngovernments spm
Standard poorstakesvariousratingactionson16eurozonesovereigngovernments spm
 
Sebnem Kalemli Özcan - Debt Overhang, Rollover Risk, and Corporate Investment...
Sebnem Kalemli Özcan - Debt Overhang, Rollover Risk, and Corporate Investment...Sebnem Kalemli Özcan - Debt Overhang, Rollover Risk, and Corporate Investment...
Sebnem Kalemli Özcan - Debt Overhang, Rollover Risk, and Corporate Investment...
 
Deloitte covid 19 economic impact tracker - 2
Deloitte covid 19 economic impact tracker - 2Deloitte covid 19 economic impact tracker - 2
Deloitte covid 19 economic impact tracker - 2
 
Putnam Perspectives: Capital Market Outlook Q1 2014
Putnam Perspectives: Capital Market Outlook Q1 2014Putnam Perspectives: Capital Market Outlook Q1 2014
Putnam Perspectives: Capital Market Outlook Q1 2014
 
Euro crisis
Euro crisisEuro crisis
Euro crisis
 
Fiscal multipliers and foreign holdings of public debt - working paper
Fiscal multipliers and foreign holdings of public debt - working paperFiscal multipliers and foreign holdings of public debt - working paper
Fiscal multipliers and foreign holdings of public debt - working paper
 
2014.10 ethenea-market-commentary-ethna-aktiv-e
2014.10 ethenea-market-commentary-ethna-aktiv-e2014.10 ethenea-market-commentary-ethna-aktiv-e
2014.10 ethenea-market-commentary-ethna-aktiv-e
 
Swmcef dec 2013_ucits_fund
Swmcef dec 2013_ucits_fundSwmcef dec 2013_ucits_fund
Swmcef dec 2013_ucits_fund
 
Impact of Debt Crisis on EMU
Impact of Debt Crisis on EMUImpact of Debt Crisis on EMU
Impact of Debt Crisis on EMU
 
Derrill allatt sovereign debt
Derrill allatt sovereign debtDerrill allatt sovereign debt
Derrill allatt sovereign debt
 
Oei feb-16
Oei feb-16Oei feb-16
Oei feb-16
 

Más de World Office Forum

Informe vivienda y sector inmobiliario de Bankinter julio 2015
Informe vivienda y sector inmobiliario de Bankinter julio 2015Informe vivienda y sector inmobiliario de Bankinter julio 2015
Informe vivienda y sector inmobiliario de Bankinter julio 2015World Office Forum
 
Guia de Negocios e Inversión de la Alianza del Pacífico 2015-2016 por EY
Guia de Negocios e Inversión de la Alianza del Pacífico 2015-2016 por EYGuia de Negocios e Inversión de la Alianza del Pacífico 2015-2016 por EY
Guia de Negocios e Inversión de la Alianza del Pacífico 2015-2016 por EYWorld Office Forum
 
Ordenación del territorio para la competitividad con una movilidad eficiente
Ordenación del territorio para la competitividad con una movilidad eficienteOrdenación del territorio para la competitividad con una movilidad eficiente
Ordenación del territorio para la competitividad con una movilidad eficienteWorld Office Forum
 
Mercado de oficinas de Cali, 2014 T4 - Colliers
Mercado de oficinas de Cali,  2014 T4 - ColliersMercado de oficinas de Cali,  2014 T4 - Colliers
Mercado de oficinas de Cali, 2014 T4 - ColliersWorld Office Forum
 
Mercado de oficinas Medellin, 2014 T4 - Colliers
Mercado de oficinas Medellin, 2014 T4 - ColliersMercado de oficinas Medellin, 2014 T4 - Colliers
Mercado de oficinas Medellin, 2014 T4 - ColliersWorld Office Forum
 
Mercado de oficinas, Mexico 2014 T4 - Newmark Grubb
Mercado de oficinas, Mexico 2014 T4 - Newmark GrubbMercado de oficinas, Mexico 2014 T4 - Newmark Grubb
Mercado de oficinas, Mexico 2014 T4 - Newmark GrubbWorld Office Forum
 
Mercado de oficinas Lima, 2014 4T,Binswanger
Mercado de oficinas Lima, 2014 4T,BinswangerMercado de oficinas Lima, 2014 4T,Binswanger
Mercado de oficinas Lima, 2014 4T,BinswangerWorld Office Forum
 
Mercado de oficinas Santiago, 2014 T4 - Newmark Grubb
Mercado de oficinas Santiago, 2014 T4 - Newmark GrubbMercado de oficinas Santiago, 2014 T4 - Newmark Grubb
Mercado de oficinas Santiago, 2014 T4 - Newmark GrubbWorld Office Forum
 
Mercado de oficinas Bogotá, 2014 T4 - Colliers
Mercado de oficinas Bogotá, 2014 T4 - ColliersMercado de oficinas Bogotá, 2014 T4 - Colliers
Mercado de oficinas Bogotá, 2014 T4 - ColliersWorld Office Forum
 
Mercado de oficinas Lima 2014 Q4 - colliers
Mercado de oficinas Lima 2014 Q4 - colliersMercado de oficinas Lima 2014 Q4 - colliers
Mercado de oficinas Lima 2014 Q4 - colliersWorld Office Forum
 
México City Office Market 2014 q4 -cbre
México City Office Market 2014 q4 -cbreMéxico City Office Market 2014 q4 -cbre
México City Office Market 2014 q4 -cbreWorld Office Forum
 
Ipms office-buildings-november-20141
Ipms office-buildings-november-20141Ipms office-buildings-november-20141
Ipms office-buildings-november-20141World Office Forum
 

Más de World Office Forum (20)

Amsterdam ema-bidbook
Amsterdam ema-bidbookAmsterdam ema-bidbook
Amsterdam ema-bidbook
 
CBRE accounts 2015
CBRE accounts 2015CBRE accounts 2015
CBRE accounts 2015
 
Informe vivienda y sector inmobiliario de Bankinter julio 2015
Informe vivienda y sector inmobiliario de Bankinter julio 2015Informe vivienda y sector inmobiliario de Bankinter julio 2015
Informe vivienda y sector inmobiliario de Bankinter julio 2015
 
Collaboration scenario
Collaboration scenarioCollaboration scenario
Collaboration scenario
 
Energy waste in buildings
Energy waste in buildingsEnergy waste in buildings
Energy waste in buildings
 
Global cities-skyscrapers
Global cities-skyscrapersGlobal cities-skyscrapers
Global cities-skyscrapers
 
Guia de Negocios e Inversión de la Alianza del Pacífico 2015-2016 por EY
Guia de Negocios e Inversión de la Alianza del Pacífico 2015-2016 por EYGuia de Negocios e Inversión de la Alianza del Pacífico 2015-2016 por EY
Guia de Negocios e Inversión de la Alianza del Pacífico 2015-2016 por EY
 
Ordenación del territorio para la competitividad con una movilidad eficiente
Ordenación del territorio para la competitividad con una movilidad eficienteOrdenación del territorio para la competitividad con una movilidad eficiente
Ordenación del territorio para la competitividad con una movilidad eficiente
 
Mercado de oficinas de Cali, 2014 T4 - Colliers
Mercado de oficinas de Cali,  2014 T4 - ColliersMercado de oficinas de Cali,  2014 T4 - Colliers
Mercado de oficinas de Cali, 2014 T4 - Colliers
 
Mercado de oficinas Medellin, 2014 T4 - Colliers
Mercado de oficinas Medellin, 2014 T4 - ColliersMercado de oficinas Medellin, 2014 T4 - Colliers
Mercado de oficinas Medellin, 2014 T4 - Colliers
 
Bogotá, 2014 Q4 - JLL
Bogotá, 2014 Q4 - JLLBogotá, 2014 Q4 - JLL
Bogotá, 2014 Q4 - JLL
 
Mercado de oficinas, Mexico 2014 T4 - Newmark Grubb
Mercado de oficinas, Mexico 2014 T4 - Newmark GrubbMercado de oficinas, Mexico 2014 T4 - Newmark Grubb
Mercado de oficinas, Mexico 2014 T4 - Newmark Grubb
 
Mercado de oficinas Lima, 2014 4T,Binswanger
Mercado de oficinas Lima, 2014 4T,BinswangerMercado de oficinas Lima, 2014 4T,Binswanger
Mercado de oficinas Lima, 2014 4T,Binswanger
 
Mercado de oficinas Santiago, 2014 T4 - Newmark Grubb
Mercado de oficinas Santiago, 2014 T4 - Newmark GrubbMercado de oficinas Santiago, 2014 T4 - Newmark Grubb
Mercado de oficinas Santiago, 2014 T4 - Newmark Grubb
 
Mercado de oficinas Bogotá, 2014 T4 - Colliers
Mercado de oficinas Bogotá, 2014 T4 - ColliersMercado de oficinas Bogotá, 2014 T4 - Colliers
Mercado de oficinas Bogotá, 2014 T4 - Colliers
 
Mercado de oficinas Lima 2014 Q4 - colliers
Mercado de oficinas Lima 2014 Q4 - colliersMercado de oficinas Lima 2014 Q4 - colliers
Mercado de oficinas Lima 2014 Q4 - colliers
 
Monterrey 2014 q4 - cbre
Monterrey   2014 q4 - cbreMonterrey   2014 q4 - cbre
Monterrey 2014 q4 - cbre
 
México City Office Market 2014 q4 -cbre
México City Office Market 2014 q4 -cbreMéxico City Office Market 2014 q4 -cbre
México City Office Market 2014 q4 -cbre
 
DISTRICT ENERGY IN CITIES
DISTRICT ENERGY IN CITIESDISTRICT ENERGY IN CITIES
DISTRICT ENERGY IN CITIES
 
Ipms office-buildings-november-20141
Ipms office-buildings-november-20141Ipms office-buildings-november-20141
Ipms office-buildings-november-20141
 

Dtz insight net debt funding gap june 2013

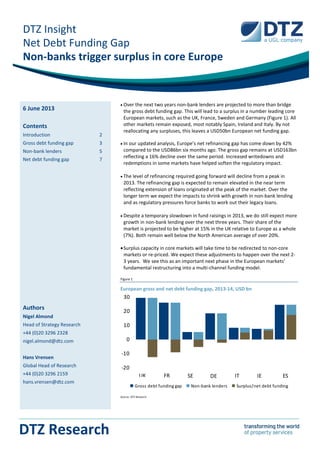
  • 1. DTZ Insight Net Debt Funding Gap Non-banks trigger surplus in core Europe DTZ Research 6 June 2013 Contents Introduction 2 Gross debt funding gap 3 Non-bank lenders 5 Net debt funding gap 7 Authors Nigel Almond Head of Strategy Research +44 (0)20 3296 2328 nigel.almond@dtz.com Hans Vrensen Global Head of Research +44 (0)20 3296 2159 hans.vrensen@dtz.com  Over the next two years non-bank lenders are projected to more than bridge the gross debt funding gap. This will lead to a surplus in a number leading core European markets, such as the UK, France, Sweden and Germany (Figure 1). All other markets remain exposed, most notably Spain, Ireland and Italy. By not reallocating any surpluses, this leaves a USD50bn European net funding gap.  In our updated analysis, Europe’s net refinancing gap has come down by 42% compared to the USD86bn six months ago. The gross gap remains at USD163bn reflecting a 16% decline over the same period. Increased writedowns and redemptions in some markets have helped soften the regulatory impact.  The level of refinancing required going forward will decline from a peak in 2013. The refinancing gap is expected to remain elevated in the near term reflecting extension of loans originated at the peak of the market. Over the longer term we expect the impacts to shrink with growth in non-bank lending and as regulatory pressures force banks to work out their legacy loans.  Despite a temporary slowdown in fund raisings in 2013, we do still expect more growth in non-bank lending over the next three years. Their share of the market is projected to be higher at 15% in the UK relative to Europe as a whole (7%). Both remain well below the North American average of over 20%. Surplus capacity in core markets will take time to be redirected to non-core markets or re-priced. We expect these adjustments to happen over the next 2- 3 years. We see this as an important next phase in the European markets’ fundamental restructuring into a multi-channel funding model. Figure 1 European gross and net debt funding gap, 2013-14, USD bn -20 -10 0 10 20 30  Gross debt funding gap  Non-bank lenders  Surplus/net debt funding UK FR SE DE IT IE ES Source: DTZ Research
  • 2. Net Debt Funding Gap www.dtz.com DTZ Insight 2 Introduction This is the sixth issue in our Debt Funding Gap report series and provides an update on our previous analysis released in November 2012 1 . In estimating the net debt funding gap, we adopt the same four step approach as summarised below: 1. Estimate the refinancing gap based on refinancing of maturing debt vintages 2. Add the impact of bank regulations to provide the gross debt funding gap 3. Estimate the positive impact of non-bank lending sources 4. Subtract the non-bank debt from the gross gap to estimate the net debt funding gap As in our previous report, our methodology for estimating the base refinancing gap remains unchanged. It involves a detailed analysis which takes into account:  Vintage of outstanding loans  Duration of loans by vintage  Loan to value ratios by vintage  Historic and future changes in collateral values, and  Impact of loan extensions Figure 2 Total outstanding debt to real estate, USD tn 0 2 4 6 8 2007 2008 2009 2010 2011 2012 Europe -4% North America -2% Asia Pacific 7% 2012 Growth Global 0% Source: DTZ Research Our analysis remains focussed on the near term refinancing gap as we have greater oversight on the likely trends in future capital values and refinancing LTVs. Both these inputs have a significant impact on the gap. Our model does extend out over future years, which we present, though there is greater uncertainty over the sizing of this gap. Since our last report we have made adjustments to some of the inputs based on discussions with our research and deal teams locally and also updated information provided in the De Montfort University survey on UK commercial property lending 2 . Our starting point this year is the outstanding debt to commercial real estate (CRE) as at the end of 2012. This includes lending by banks, covered bonds and CMBS. In reflecting the evolution of the market we also account for non-bank lenders. We exclude property company bonds as these are not secured against direct assets. Overall, the amount of debt held against CRE was marginally lower globally (-1%) as a rise in Asia Pacific was more than offset by falls in Europe and North America (Figure 2). As a result we have seen the continued reduction in aggregate gearing, also supported by rising equity values (Figure 3). 1 Net Debt Funding Gap, European gap to be bridged by 2015, UK ahead, 14 November 2012 2 The UK Commercial Property Lending Market Research Findings 2012 Mid-year Figure 3 Total debt as a proportion of invested stock 40% 50% 60% 70% 80% 2000 2002 2004 2006 2008 2010 2012 Global N.America Europe Asia Pacific 66% 59% 58% 54% 73% 64% 63% 55% Source: DTZ Research
  • 3. Net Debt Funding Gap www.dtz.com DTZ Insight 3 Gross debt funding gap Deleveraging underway in major markets Compared to a year ago deleveraging is now well underway in many major markets across the globe. Some of the biggest reductions in debt against CRE have been in the UK, Spain and Ireland (Figure 4); markets that we have previously identified as having significant funding gaps. The reduction reflects high levels of writedowns and/or redemptions which has more than offset any new lending. Reductions were also observed in Germany, the Netherlands and Japan. Of the major markets, France sticks out with a modest increase in outstanding debt. UK, Spain and Japan have highest refinancing gaps Despite the reduction in debt, the UK, Spain and Japan all show significant refinancing gaps over the next two years 2013-14 (Figure 5). The remaining refinancing gap is mostly across the rest of Europe, with Italy and Ireland showing relatively high gaps when compared to Germany. Regulatory burden high, but beginning to soften We have previously highlighted the significant impact that regulation will have on the funding gap. In our November report we highlighted that regulation would more than double Europe’s refinancing gap to a gross USD190bn as banks could be forced to delever their loan books by over 7% by the end of 2013. Estimates on the level of deleveraging have not been updated by the IMF since our last report, so we have assumed the same rate. Given that many banks have been actively shrinking their CRE loan books (Figure 4) we have allowed for this reduction in our analysis through stripping out any reductions at a country level from the total 7.3%. As a result the regulatory impact is now less than the refinancing gap. The changes show that the UK, Spain, Italy and Ireland are no longer impacted by this reduction given their already high refinancing gaps. In contrast France, Germany and the Netherlands all take significant hits. Overall regulation adds USD77bn to Europe’s USD86bn refinancing gap to a gross USD163bn (Figure 6). We are aware of other regulations being put in place at a local level, for example slotting in the UK and France. As transparency is poor with regulators applying different approaches both within and across different jurisdictions modelling is not yet possible. Figure 4 Change in outstanding debt against CRE in selected markets, local currency, 2012 -6% -3% 0% 3% 6% Source: DTZ Research Figure 5 Refinancing gap 2013-14, USD bn 0 10 20 30 Source: DTZ Research Figure 6 European gross debt funding gap 2013-14, USD bn 0 30 60 90 120 150 180 0 10 20 30 40  Refinanicing gap  Regulatory impact Source: DTZ Research
  • 4. Net Debt Funding Gap www.dtz.com DTZ Insight 4 Deleveraging eases regulatory burden Compared with our report in November, Europe’s gross debt funding gap has shrunk by 14% to USD163bn (Figure 7). The reduction reflects falls in a number of key markets including Germany, the UK, Italy, Spain and the Netherlands. Despite these falls the gross debt funding gap still remains elevated. Countries with larger stock figures would be expected to have larger funding gaps by virtue of their size. Comparing a country’s funding gap with its stock provides a more realistic measure. On this basis Ireland remains the most exposed market on a relative basis, with its gross funding gap at 6% of its stock (Figure 8). Spain also has a relatively high exposure, with the UK, France and Germany close behind. Despite having a relatively low gross funding gap, Hungary has a high relative exposure of close to 6%. Across Asia we see no major regulatory impacts as we do in Europe. This largely reflects the lower or negligible refinancing gaps. We outline the Asian markets in Figure 8 in brown, and these all sit below the European markets on a relative basis. This includes Japan which has Asia’s largest, though shrinking, gap. Figure 7 Change in European gross debt funding gap, USD bn 0 50 100 150 200 0 10 20 30 40 Nov 12 May 13 Source: DTZ Research Figure 8 Gross debt funding gap 2013-14, USD bn, and as a % of stock FR DE HU IE IT NL ES UK AU JP 0% 3% 6% 9% 12% 0 5 10 15 20 25 30 35 %investedstock Grossdebtfundinggap Key  Europe  Asia Source: DTZ Research
  • 5. Net Debt Funding Gap www.dtz.com DTZ Insight 5 Non-bank lenders Non-banks step up lending but funds are delayed As banks limit new lending or withdraw from markets altogether we are seeing a growing number of non-bank lenders entering the market. In our previous report, we estimate there to be USD173bn of new lending capacity from these non-bank lenders over the period 2013-15 from an estimated 68 funds and insurance companies (Figure 9). We have updated our estimate based on new market entrants and updates on some of the existing funds and insurers who were entering the market (see Table 1 for a list of new market entrants over the last six months). The majority of these funds are domiciled in the UK or US. Although the majority are new funds, we do see some new raising of funds by insurers seeking to target institutional investors who may not have the platform or track records from which to lend directly. For insurers we have based our estimates on stated lending targets. For funds we have used their stated equity raising target. We have also made allowances for new entrants to emerge over the next few years. In Box 1 (overleaf) we outline the impact these new lenders have had on the market to date and their likely share of activity over the near term. Overall, we expect the amount of new lending capacity to be marginally higher at USD181bn from a total of 80 funds. However, we have revised downwards our near term expectations. This reflects lower capacity from funds as we do not expect availability to be as strong as we previously estimated. We expect there to be a pick-up in later years ahead of our previous estimates, especially in 2015. We believe that insurers are in pole position today to take advantage of the market, representing more than half of new lending capacity. We expect to see this proportion shift and be more evenly balanced by 2015 (Figure 10). Figure 9 Lending capacity from non-bank lenders, USD bn 0 25 50 75 100 2013 2014 2015 Nov 12 May 13 No Funds Nov 12 = 68 May 13 = 80 Source: DTZ Research Figure 10 Lending capacity by lender types 0% 25% 50% 75% 100% 2013 2014 2015 Funds Insurers Source: DTZ Research Table 1 Emerging non-bank lenders Lender Type Domicile Focus AEW (UK) Fund UK UK First Property Group Fund UK UK Aviva Core Senior Fund Fund UK UK Pacific Mutual Insurer US UK ARES Capital Fund US Europe Aalto Investment Fund UK Europe Renshaw Bay Fund UK Europe Source: DTZ Research
  • 6. Net Debt Funding Gap www.dtz.com DTZ Insight 6 Beyond the growth in new lenders, the appetite amongst companies to tap into the bond markets has remained strong. 2012 saw close to EUR15bn in new bond issuance in line with our previous predictions. Already in the first quarter this year we have seen issuance in excess of EUR4bn, 15% ahead of Q1 2012. On this basis we expect 2013 issuance to rise above 2012 levels to around EUR17bn (Figure 11). We have also seen similar trends across Asia Pacific. Japan, which has Asia’s largest gap, saw issuance grow 40% in 2012 to nearly USD5bn. Already in Q1 issuance was more than double the level a year ago. Assuming growth of 50% this year would lead to an additional USD7bn of lending capacity. Figure 11 Bond issuance by European property companies, EUR bn 0 3 6 9 12 15 18 2006 2007 2008 2009 2010 2011 2012 2013 2014 Q1 Q2 Q3 Q4 Forecast Source: Bloomberg, DTZ Research Box 1. Trends in non-bank lending Compared to North America the European lending market is dominated by banks. Over three quarters of lending in Europe has been provided by banks (Figure 12). Banks in North America make-up around half of lending, with non-banks, notably life insurers accounting for up to 20% or more, with a similar proportion from CMBS (Figure 12). Lending from insurers has been limited to just a handful of lenders across Europe and their share has to date been relatively small, albeit growing. This reflects a broader range of lenders, including the arrival of US insurers such as TIAA CREF and Mass Mutual (Cornerstone), with traditional European insurers such as AXA, Allianz and Aviva stepping up lending. Sales of both performing and non-performing loans has also led to the entry of private equity funds, with other new funds seeking to raise for both senior and junior lending. As a result non-banks’ share has risen to 2% in Europe and an even higher 7% share in the UK. Looking forward, assuming 75% of non-bank lending capacity is for new loans and that any new lending by banks is offset by deleveraging, we can estimate future market shares. On this basis non-banks increase their market share to 15% in the UK over the next three years and 7% in Europe (Figure 13). This is still short of the 23% average in North America. Figure 12 Outstanding debt by lender type, YE 2012 0% 25% 50% 75% 100% North America Europe Asia Pacific UK Banks Non-banks CMBS Covered bonds Source: DTZ Research Figure 13 Non-bank lenders market share 0% 5% 10% 15% 20% UK only European total Forecast Source: DTZ Research
  • 7. Net Debt Funding Gap www.dtz.com DTZ Insight 7 Net debt funding gap Gap eroding in major markets In analysing the market going forward we have estimated the likely target focus of the non-bank lenders at a country level. With bond issuance able to cover much of the gap in Asia Pacific, the focus of this section is on Europe where we see the biggest challenges. For the major European markets of the UK, France and Germany we have made estimates on capital targeting them based on stated preferences. For the remaining markets we have estimated their share based on the relative size of their debt markets. For bonds we have apportioned according to trends in raising over 2012. We have also made allowances for the major investors whose portfolios span across Europe. Based on this analysis, we estimate that new non-bank lenders could provide sufficient new lending capacity to erode the gross funding gap in the UK, France, Sweden and Germany to zero, with more than sufficient capacity across the UK and France (Figure 14). This reflects the relative size of these markets which benefit from major domestic insurers and funds who are mainly focused on their home market. Spain most exposed on a net basis In Spain we see more limited new lending capacity or bond issuance, which still leaves a significant USD17bn net funding gap over the next two years (Figure 15). With transfers to SAREB completed at the beginning of this year we could see further progress in bank writedowns helping to shrink this gap. Other markets showing marginal risks include Ireland, Italy and the Netherlands. With many Dutch banks under state control we expect government pressures to force further deleveraging. We also expect NAMA to accelerate the work out of loans in Ireland. Looking across other markets in Europe, we can compare the gross and net funding gaps relative to the size of outstanding debt (Figure 16). Those markets below the horizontal dashed line have below average net debt funding gaps. These include the UK, France and Germany, despite having high gross gaps. Spain is highlighted in the top right as being most exposed. This highlights the need for further deleveraging in the country, although a shift of further assets into SAREB may ease some of these burdens. Figure 14 European gross and net debt funding gap 2013-14, USD bn -20 -10 0 10 20 30  Gross debt funding gap  Non-bank lenders  Surplus/net debt funding UK FR SE DE IT IE ES Source: DTZ Research Figure 15 Surplus and net debt funding gap, USD bn, 2013-14 -15 -10 -5 0 5 10 15 20 Source: DTZ Research Figure 16 Gross and net debt funding gap compared to debt outstanding, USD bn FR DE IT NL RU ES NO SE IE UK 100 250 -5 0 5 10 15 20 25 0 5 10 15 20 25 30 35 40 Netdebtfundinggap Gross debt funding gap US JP CN ES DE Outstanding debt USDbn Source: DTZ Research
  • 8. Net Debt Funding Gap www.dtz.com DTZ Insight 8 Surplus to shift to non-core markets For Europe as a whole we see progress in plugging the gap, with Europe’s gap eroding to a net USD50bn, or 30% of its gross level (Figure 17). As we more closely assess the impact across each market, we expect that the bigger, core lending markets are likely to benefit more in the short term from this trend. Surplus capacity in some of these core markets will likely take some time to be re-directed or re-priced. But we do expect this adjustment to happen in the next 2-3 years. We see this as an important next phase in the European markets’ fundamental restructuring into a multi-channel funding model. With an additional USD124bn of equity capital available, combined this should be more than sufficient to bridge the gap, particularly given a high proportion of this is directed at non-core assets 3 . End in sight, but tail of workout will last longer As we move forward we see reasons to be positive that an end is in sight for the funding gap. We see a shrinking refinancing profile across Europe, falling from over USD300bn this year to USD265bn by 2016 (Figure 18). We would expect this to taper away further reflecting the recent reduction in loan extensions. Despite this fall, we still see an increase in the refinancing gap over the near term (Figure 19). This reflects loans originated or refinanced at the peak of the market and that have subsequently extended in recent years. It also reflects limited growth in values that we expect in the near term, with values falling in some markets. Regulation forces deleveraging Given the recent growth in alternative lending sources and the availability of sufficient equity capital, we would expect this to be more than sufficient to bridge the gap. We expect the core European markets to be ahead of the curve as banks actively seek to reduce their balance sheets and manage the cost of holding problematic loans on their balance sheets. Regulatory pressures will also force banks into working out problematic loans as the capital needed to set aside for loans increases. This will lead to further pain and writedowns over the coming years and the likelihood of increasing foreclosures as the economic environment improves. This would be consistent with behaviours in previous cycles. 3 Great Wall of Money, More cross border and non-core coming next, 22 March 2013 Figure 17 European net debt funding gap 2013-14, USD bn 0 30 60 90 120 150 180 Gross debt funding gap Non-bank lenders Net debt funding gap Available equity Refinancing Regulation Insurers Funds Bonds Net gap Source: DTZ Research Figure 18 European refinancing requirements, USD bn 0 50 100 150 200 250 300 350 2013 2014 2015 2016 Source: DTZ Research Figure 19 European refinancing gap 2013-16, USD bn 0 10 20 30 40 50 60 2013 2014 2015 2016 UK Rest ofEurope Spain France Germany Italy Ireland Source: DTZ Research
  • 9. Net Debt Funding Gap www.dtz.com DTZ Insight 9 We also expect to see more activity in markets such as the Netherlands where the state has been proactive in providing support to the banking sector and pressures will be greatest to manage solutions. In more exposed markets such as Ireland and in particular Spain, which is only just establishing its bad bank, we see more of a tail risk. With a longer work-out of loans this may impact the speed of recovery. Greater transparency required on regulation Whilst we see a step-up in the regulations, there remains a lack of transparency both across and within jurisdictions. Given the scale of the crisis over recent years, regulators and other market authorities have a clear chance to enhance their stewardship of banks and other lenders in their markets. A transparent and coordinated approach across Europe would seem a sensible solution going forward. Growth in loan sales as lot sizes reduce Over the past six months we have seen the continued use of loan sales by banks as a means of deleveraging and ensuring they are adequately capitalised. As expected the typical size of loan sales has shrunk over the past three months reflecting the limited appetite amongst investors for billion sized loan portfolios. By reducing the typical portfolio size, banks are able to increase the target investor base. The resulting competition combined with more selective portfolios means the typical discounts are generally remaining at or below 50% for the better performing loans and the trend for discounts across the board has been reducing over the course of this year (Figure 20). There are occasionally steeper discounts applied on non-performing loans. We see the continued use of loan sales by banks over the course of this year, with a number of key portfolios currently on the market. Some of these are more sizeable, reflecting the desire of some banks to completely withdraw from lending altogether or from specific markets (Table 2). Although this does not remove the debt burden completely, by transferring loans to more opportunistic funds, we expect to see further writedowns across the banking sector and the likelihood of an accelerated workout. Figure 20 Growth in loan sales, EUR bn and discounts to face value 0% 25% 50% 75% 100% 0 5 10 15 20 25 Cum. value of loans (LHS) Discount ─ Trend Source: DTZ Research Table 2 Key pending loan sales Lender Size Comment Co-Op £2.1bn UK loan book Deutsche Postbank £2.5bn Mostly UK loan book Eurohypo £4bn UK loan book AIB £200m UK hotel loans IBRC €18.7bn UK and Irish loans Source: DTZ Research
  • 10. Net Debt Funding Gap www.dtz.com DTZ Insight 10 Other DTZ Research Reports Other research reports can be downloaded from www.dtz.com/research. These include: Occupier Perspective Updates on occupational markets from an occupier perspective, with commentary, analysis, charts and data. Global Occupancy Costs Offices Obligations of Occupation Americas Obligations of Occupation Asia Pacific Obligations of Occupation EMEA Office Occupier Review Asia Pacific Office Occupier Review Europe The TMT Sector - October 2012 The European Insurance Sector - June 2012 Property Times Regular updates on occupational markets from a landlord perspective, with commentary, charts, data and forecasts. Coverage includes Asia Pacific, Bangkok, Beijing, Berlin, Brisbane, Bristol, Brussels, Budapest, Central London, Chengdu, Chongqing, Dalian, Edinburgh, Europe, Frankfurt, Glasgow, Guangzhou, Hangzhou, Ho Chi Minh City, Hong Kong, India, Jakarta, Japan, Kuala Lumpur, Luxembourg, Madrid, Manchester, Melbourne, Milan, Nanjing, Newcastle, Paris, Poland, Prague, Qingdao, Rome, Seoul, Shanghai, Shenyang, Shenzhen, Singapore, Stockholm, Sydney, Taipei, Tianjin, Ukraine, Warsaw, Wuhan, Xian. Investment Market Update Regular updates on investment market activity, with commentary, significant deals, charts, data and forecasts. Coverage includes Asia Pacific, Australia, Belgium, Czech Republic, Europe, France, Germany, Italy, Japan, Mainland China, South East Asia, Spain, Sweden and the UK. Money into Property For nearly 40 years, this has been DTZ's flagship research report, analysing invested stock and capital flows into real estate markets across the world. It measures the development and structure of the global investment market. Available for Global, Asia Pacific, Europe, North America and UK. Foresight & Outlook Quarterly commentary, analysis and insight into our in- house data forecasts, including the DTZ Fair Value Index™. Available for the following regions: Global, Asia Pacific, Europe and in the UK. In addition, we have been publishing our Annual Global Outlook report for the last three years. This report provides a concise market outlook for the year ahead and is presented to key client audiences around the globe. Insight Thematic, ad hoc, topical and thought leading reports on areas and issues of specific interest and relevance to real estate markets. China Healthcare – April 2013 European Sustainability Guide – April 2013 Great Wall of Money – March 2013 European Retail Guide - Shopping Centres – March 2013 China Property Market Sentiment Survey - January 2013 India Special Economic Zones - December 2012 Singapore Executive Condominiums - December 2012 UK Secondary market pricing - December 2012 Singapore office demand - December 2012 China Ecommerce & Logistics - November 2012 Net Debt Funding Gap - November 2012 German Open Ended Funds - October 2012 DTZ Research Data Services The following data is available for subscription. Please contact graham.bruty@dtz.com for more information.  Property Market Indicators Time series of commercial property market data in Asia Pacific and Europe.  Real Estate Forecasts, including the DTZ Fair Value Index TM Five-year rolling forecasts of over 200 commercial property markets in Asia Pacific, Europe and the USA.  Investment Transaction Database Aggregated overview of investment activity in Asia Pacific and Europe.  Money into Property Data covering capital flows, size, structure, ownership, developments and findings of annual investor and lender surveys.
  • 11. www.dtz.com DTZ Insight 11 DTZ Research DTZ Research Contacts Global Head of Research Hans Vrensen Phone: +44 (0)20 3296 2159 Email: hans.vrensen@dtz.com Head of Strategy Research Nigel Almond Phone: +44 (0)20 3296 2328 Email: nigel.almond@dtz.com Global Head of Forecasting Fergus Hicks Phone: +44 (0)20 3296 2307 Email: fergus.hicks@dtz.com Head of Asia Pacific Forecasting Kate Barrow Phone: +852 2250 8864 Email: kate.barrow@dtz.com Head of Research Information Management Graham Bruty Phone: +44 (0)20 3296 2297 Email: graham.bruty@dtz.com Head of CEMEA Research Magali Marton Phone: + 33 1 49 64 49 54 Email: magali.marton@dtz.com Head of SEA & ANZ Research Dominic Brown Phone: +61 (0)2 8243 9999 Email: dominic.brown@dtz.com Head of Americas Research John Wickes Phone: +1 312 424 8087 Email: john.wickes@na.ugllimited.com DTZ Business Contacts Head of Valuation EMEA Bryn Williams Phone: +44 (0)20 3296 4474 Email: bryn.williams@dtz.com Head of Valuation UK Charles Smith Phone: +44 (0)20 3296 4411 Email: charles.smith@dtz.com Head of Valuation Netherlands Jacques Boeve Phone: +31 (0)20 8 407 262 Email: jacques.boeve@dtz.com Head of Valuation Germany Klaus Dallafina Phone: +49 (0)69 92 100 400 Email: klaus.dallafina@dtz.com Head of Valuation France Jean-Philippe Carmarans Phone: + 33 1 47 48 77 24 Email: jean-philippe.carmarans@dtz.com Debt Solutions Coordinator Tom Nuttall Phone: +44 (0)20 3296 4571 Email: tom.nuttall@dtz.com Debt Solutions Ireland Maurice O’Neill Phone: +353 1 6399657 Email: maurice.oneill@dtz.ie Debt Solutions London Fergus Jack Phone: +44 (0)20 3296 4494 Email: fergus.jack@dtz.com Debt Solutions UK Regions Richard Murphy Phone: +44 (0)29 2026 2235 Email: richard.murphy@dtz.com Debt Solutions Netherlands Patrick Steenstra Toussaint Phone: +31 20 571 1427 Email: patrick.steenstratoussaint@dtz.com DISCLAIMER This report should not be relied upon as a basis for entering into transactions without seeking specific, qualified, professional advice. Whilst facts have been rigorously checked, DTZ can take no responsibility for any damage or loss suffered as a result of any inadvertent inaccuracy within this report. Information contained herein should not, in whole or part, be published, reproduced or referred to without prior approval. Any such reproduction should be credited to DTZ. © DTZ June 2013