SlideShare una empresa de Scribd logo
1 de 31
Descargar para leer sin conexión
Universidad Alberto Hurtado and
Georgetown University
Faculty of Economics and Business
Thesis to opt to the Master of Applied Economics degree given by
Georgetown University and the Magíster en Economía Aplicada a
Políticas Públicas given by Universidad Alberto Hurtado
The Effect of Grade Retention on
Students’ Outcomes: Evidence from
Chile
Juan Carvajal
supervised by
Dr. Marcela Perticara University of Texas A&M
Santiago, Chile
2016
Universidad Alberto Hurtado and
Georgetown University
Faculty of Economics and Business
The Effect of Grade Retention
on Students’ Outcomes:
Evidence from Chile
Juan Carvajal
supervised by
Dr. Marcela Perticara University of Texas A&M
Director of Master
Dr. Lucas Navarro Georgetown University
Santiago, Chile
2016
Contents
1 Introduction 2
2 Chilean educational system, data and variables 5
2.1 Background . . . . . . . . . . . . . . . . . . . . . . . . . . . . 5
2.2 Data . . . . . . . . . . . . . . . . . . . . . . . . . . . . . . . . 7
2.3 Variables . . . . . . . . . . . . . . . . . . . . . . . . . . . . . 8
3 Estimation strategy using an IV framework 12
3.1 GPA . . . . . . . . . . . . . . . . . . . . . . . . . . . . . . . . 12
3.2 Probability of Attending Secondary School . . . . . . . . . . . 14
3.3 Probability of Dropping Out . . . . . . . . . . . . . . . . . . . 14
4 Results 15
4.1 Model 1 . . . . . . . . . . . . . . . . . . . . . . . . . . . . . . 15
4.1.1 Academic Achievement . . . . . . . . . . . . . . . . . . 15
4.2 Model 2 . . . . . . . . . . . . . . . . . . . . . . . . . . . . . . 18
4.2.1 Attending Secondary School . . . . . . . . . . . . . . . 18
4.3 Model 3 . . . . . . . . . . . . . . . . . . . . . . . . . . . . . . 18
4.3.1 School Abandonment . . . . . . . . . . . . . . . . . . . 18
5 Conclusions 20
6 Appendix 22
6.1 Cohort 2003 . . . . . . . . . . . . . . . . . . . . . . . . . . . . 22
6.1.1 Tables for ever repeating between third and fourth grade 22
6.1.2 Tables for ever repeating between first and fourth grade 25
6.1.3 Tables for ever repeating between first and eighth grade 27
7 Literature 28
1
Abstract
This article estimates the effect of early grade retention on students’ out-
comes in Chile by using administrative data from the ministry of education
(MINEDUC) on academic achievement. Using the 2003 cohort of students
starting first grade of primary school and an instrumental variables approach
to control for grade retention’s endogeneity based on unobserved qualities of
the student, I find that early grade retention has a negative effect on 6th and
8th grade’s academic performance (GPA). I also find a negative effect on the
probability of attending secondary school with a 25 percentage point reduction
if the student repeated any time between 1st and 2th grade. Finally, I find
that early grade retention has a positive effect in the probability of dropping
out of secondary school with a 33.4 percentage point increase in the probabil-
ity. This article concludes with possible policies to counterattack the negative
results on students outcomes given the actual retention policy in the Chilean
educational system.
1 Introduction
Most Latin American countries have been relying on grade retention as an
effective way to re-prepare low achieving students who could not succeed
with the standard academic requirements needed to be promoted to the next
academic year along with his peers. Grade retention is understood as an
educational practice of having a child repeat a grade in school. However, in
recent years, most developed countries have switched from a grade retention
system to an automatic promotion system requiring that all student should
be promoted to the following year. Chile, in this case, falls in the Latin
American category of countries with very high index of grade retention.
In recent years, economists have spent a great amount of resources in
research on the importance of education and the economical results it has
in the labor market. Aware of this importance, economists have focused on
academic achievement and different remedial programs that either encour-
ages or deviate students from achieving their required scores to be promoted
to the following year along with his peers. Grade retention as a remedial
program, therefore, has been a very wide subject that economists have tried
to decode and explain, given its economical implications.
There has been a wide debate on whether children should, in fact, re-
peat grades given the negative social, emotional and cognitive impacts that
2
this includes. Most literature, Jacob and Lefgren (2009), Manacorda (2012),
Elodie Allet (2010), Eide and Showalter (2001) and more, allude to the fact
that grade retention does have some emotional impact on children that could
affect them academically. In the mentioned literature, there is a mix of views
about the effects of grade retention. The first is that there is a positive effect
on children since it provides them with more maturity relative to their peers
and it strengthens the basic and necessary knowledge for posterior years,
Fertig (2004), Jacob and Lefgren (2004). The second; however, reflects grade
retention as to being correlated with later poor academic performance and
eventually abandonment of continued studies. The majority of grade reten-
tion studies find that the practice of requiring students to repeat a grade
decreases self-esteem, school adjustment, and academic achievement, and in-
creases dropout rates, Eide and Showalter (2001).
The main purpose of this work is to try to explain what are the effects
of early grade retention on children’s academic performance, access to sec-
ondary school in Chile, and probability of dropping out of secondary school.
I want to see if repeating a grade is in fact beneficial for the child given the
characteristics of Chile or rather damaging for future cognitive development.
One of the main problems involving this analysis, however, is that there
might be a problem of self-selection, kids who repeat a grade tend to be very
different from children who never do allowing for selection bias. The problem
with this is that we cannot compare one group to the other, which limits the
type of methodology needed to perform this study. Failing to account for the
selection of students into repeating a grade can potentially exaggerate the
harm of retention. Having this in mind, I focused on finding a possible de-
terministic rule to compare students who are close to the cut off line such as
Manacorda (2012) as he uses the fact that in Uruguay if a student fails more
than 3 classes, then he is obliged to repeat the grade. Another work is that of
Jacob and Lefgren (2009) who use the Chicago Accountability Policy where
a student from 3rd and 6th grade is required to perform at predefined levels
of both reading and mathematics in order to be promoted to the next grade1
.
Following this idea we found that in Chile, the ministry of education en-
forced a rule in Article 10 of the supreme decree of education No 40, where
if the student fails to attend more than 85% of the classes throughout the
academic year in addition to achieving a GPA lower than 4 (out a 1-7 chart
being 7 the highest score) then the student would be forced to repeat the
grade. While students moving from 1st to 2nd and from 3rd to 4th grade
1
Jacob and Lefgren (2009)
3
would only require to fill the assistance requirement given that they have
a two year period to achieve the required GPA. One of the problems with
this notion is that “assistance to class” can be easily altered by teachers and
allows manipulation in the event that the student might be slightly under
that threshold in order to promote them. Figure (1) shows that is in fact the
case since there is a big jump right in the 85% assistance rate. This can only
mean that teachers in Chile tend to alter their assistance reports in order to
allow students who are right in that threshold to achieve the necessary re-
quirements to pass. Moreover, being this the only explicit deterministic rule
of enforcement that we could find, the empirical analysis with a regression
discontinuity cannot be used as an empirical method to estimate the effect
of early retention in this article.
Due to a lack of a deterministic rule combined with poor background in-
formation from the database we relied on the instrumental variable approach
to try and correct the endogeneity from our grade retention variable since it
involves unobserved characteristics of the student such as prior cognitive de-
velopment, early academic motivation, maturity, parental involvement, etc.
In order to do this, I had to find a variable that was correlated with my
endogenous variable but which did not explain the output in place. In other
words, I want a variable capable of explaining grade repetition without any
explanatory power over GPA in 6th and 8th grade, probability of attend-
ing secondary school and the probability of dropping out while in secondary
school.
Using standard literature about the subject I will follow Fertig (2004),
Elodie Allet (2010) and Eide and Showalter (2001) and exploit the “relative
maturity” of the student with the number of days from his birthday at the
time of entry in first grade and the quarter of birth as instrumental variables.
According to Eide and showalter (2001) one of the biggest worries when us-
ing this approach is that the instrument would in fact be correlated with the
dependent variable, in this case GPA. Their argument is that children who
started younger relative to their peers have a higher probability of repeat-
ing a grade than those who started older given that they are more mature
and faster learners. However, there is reasonably good evidence that age
differences in scholastic performance at school entry are temporary2
. Shep-
ard and Smith (1986,1987) find that first grade classes typically have 8 or
9 percentile point differences in reading achievement tests between the old-
est and youngest students, but that the age effect disappears by the third
2
Eide and Showalter (2001)
4
grade. Finally, Reynolds (1992) finds that age at school entry does not have
any significant effect on grade 4 outcomes, independent of grade retention3
.
Therefore, we can utilize this argument to prove that maturity at the time
of entry does not have a significant effect on students’ outcomes nor do they
have a significant long-term effect on GPA. Therefore, we can conclude that
the instruments used here are in fact exogenous and do not affect the aca-
demic achievements and outcomes in secondary school.
The results found in this study, while applying the instrumental vari-
able approach, show that repeating at an early age lowers sixth grade GPA
by 0.72 points on average. Eight grade GPA shows similar results with a
decrease of 0.6 points on average. The study also found that early grade
repetition decreases the probability of ever attending secondary school by 25
percentage points at the one percent level of confidence. Finally, the study
showed that there was a 33.4 percentage point increase in the probability
of dropping out of secondary school when repeating at an early age. This
follows the results of Eide and Showalter (2001) as they find repetition to
have a negative impact on students scores and academic achievement.
The remainder of this article is going to be sectioned in 4 parts. Section
2 will give a brief description of the Chilean background and educational
system, the database, and the empirical method used while giving some de-
scriptive statistics. Section 3 will describe the estimation strategy with 3
models used to explain the outcomes. Section 4 will show the table results
of the models and explain the direction and magnitude of the coefficients.
Finally, Section 5 will end with a conclusion and some critics to the negative
results found in section 4.
2 Chilean educational system, data and vari-
ables
2.1 Background
Chile’s educational system is made up by 2 cycles, primary school (enseñanza
básica) and secondary school (enseñanza media). Primary goes from 1st
grade to 8th grade with a minimum age of entry in first grade of 6 years
old, and secondary school from 9th to 12th. According to law 19.876 pri-
3
Ibid
5
mary and secondary education in Chile is mandatory for all children until
the age of 21, which means that every child in the country has the option of
free education without exclusion in certain establishments. The educational
establishments in Chile are distributed into three different types: Public or
municipal schools which represent 41% of total enrollment, non-fee-charging
private schools with 51% of enrollment and fee-charging schools with 7% of
enrollment, Caceres and Giolito (2014). With this in mind, most of the fee-
charging schools in Chile are located in the capital which at them time of
analyzing our data distorts the sample since it is not representative to the
country itself.
In 2008 the government passed the Subvención escolar preferencial (SEP)
or targeted-voucher school law, which establishes that all children considered
vulnerable in the economical sense can apply to any non-fee-charging schools
(private-voucher school) they desire, without any admission test and com-
pletely free. This law was meant to reduce the inequality gap built by the
school system itself and allow a more heterogeneous distribution of students
among schools. One of the feature of this law, is that it provides funds to
all schools that absorb these incoming students which at the same time are
allowed to repeat a grade at least one time per grade without consequence.
However, for this article we wont touch this law since we will be using a
cohort of 2003.
Another important distinction that the Chilean educational system has
is that it allows children to choose between two different type of tracks for
secondary education. There is a Scientific-Humanistic track which encour-
ages and prepares the student for future college education, providing him
with different classes and tools to excel. On the other hand, there is the
Technical-Professional track that prepares the student for immediate techni-
cal work after secondary school. This later track, however, has a duration of
five years instead of the standard four such as the former one.
The basic motivation of this article comes from the relative change that
repetition has had over the past few years. This change, following a recent
study by the ministry of education (2015) and UNESCO4
, shows that in 2012
the repetition rate for primary school (taking into account only the first six
grades) was 4.7%, in 2013, however, it changed to 3.7%. This one percentage
point change represents a question mark in our study since it might hint
a difference in opinion about the effectiveness of the promotion policy in
4
National revision 2015 for ”educaci’on para todos”
6
place. An efficient system is the one where repetition rates are closer to zero,
find the reason why these rates are so high in Chile, represents the type of
questions that this article will try to address.
2.2 Data
I use the detailed administrative data of academic achievement from the min-
istry of education, which provides data from 2002 to 2014 on specific birth
dates, code of the establishment, code of the county and region, an identifi-
cation number specific to each student that allows me to follow them even
in the case of transferring to another establishment throughout the period,
gender, and general GPA after the end of the academic year. I exploit the
fact that the data base provides a 12 year period to construct a panel data
that allows me to follow a student from the first day he joined the educa-
tional system all the way until he finished. Therefore, the data allows me
to observe a specific cohort for an entire period of time. Constructing the
panel, I obtained my 2003 cohort5
with students all over Chile; however,
to avoid too much heterogeneity between establishments I focused on non-
fee-charging private and municipal establishments since they constitute the
majority of the student body that have similar characteristics, leaving the
private fee-charging establishments out of the study. The data also provides
with important information of the final situation of the student at the end
of the academic year. This allows for the creation of most of the variables
of interest, such as whether the student dropped out of secondary school or
how his GPA looked like. I am also able to construct the repetition variables
by observing the amount of times the ID number is seen on a determined
grade and establishment. I therefore use a predetermined cohort (2003) and
use it as a cross-section study having only one observation per individual,
but allowing for dummies such as repeated any time between first and second
grade, third and fourth grade and finally first and eight grade. Making the
analysis in this way more manageable.
5
I also applied this same study using a 2002 cohort given the fact that students ob-
served in 2002 in first grade could also be repeaters from the previous year, and since the
information for it did not come with the data, we used the following year to see what the
fraction of repeaters looked like and concluded that the difference was significant; therefore
causing distortions
7
2.3 Variables
For my outcome variables I study the direct effect of repetition of 6th and
8th grade GPA. I focus specially on early grade repetition and the effect this
one has on later outcomes in primary and secondary school. With it I intend
to see the impact that repeating at an early age has on the psychological and
academical outcomes of the student. In the case of the probability of assisting
secondary school, I generated a dummy equal to 1 if the student’s identifi-
cation number appeared at least once in the records of secondary school, I
did this in order to see the probability the repeater has to ever graduate
from primary school and enroll in the subsequent level. Finally, I created
my dropout variable focusing only in secondary school due to administrative
errors in the data, where students would suddenly disappear in early grades
causing error and noise in the estimations. This last variable was created by
looking at the last year the student appeared in the database and creating a
dummy equal to 1 if the last year observed was less to 2014.
When creating my repetition variables I wanted to explain the effect of
early repetition on the outcomes the student might have in the future. There-
fore, I focused on four different possibilities of repetition. The first is having
repeated a grade at least once while coursing 1st and 2nd of primary school.
the second explains having ever repeated 3rd or 4th grade, the third explains
repetition between 1st to 4th grade and finally, the fourth repetition variable
show having ever repeated grade in primary school (1st to 8th grade). These
variables will try to explain the real effect that early repetition has on long-
run effects in student achievement. To have ever repeated primary school
can affect directly the output of the student the subsequent year, moreover,
I expect to see a bigger effect on dropout and the probability of attending
secondary school in the upcoming results.
The instruments I utilize in this article come from the literature of Fertig
(2004), Elodie Allet (2010) and Eide and Showalter (2001). This literature
uses the physical maturity of the student at the time he first joins the educa-
tional system in first grade of primary school relative to his peers. The main
idea is that the younger the child is relative to his classmates the more will the
probability be of repeating first and second grade. Elodie Allet (2010) uses
the number of days from the birthday to the cut off date and determines a
difference in days from the youngest to the oldest to account for how younger
is one student relative to anotherr. Elodie Allet (2010) experiments with two
variables of the number of days and estimates their respective coefficients.
The first is using the variable as continuous and the second as dummy vari-
8
ables. One conclusion she provides is that the difference in implied effect of
retention between the dummy variable estimates and the ndays estimate is
that ndays gives equal weight to days far beyond the cut-offs which some-
times is not supported by the data. Therefore, the correct way and the one
used in this article is to use dummies to correct for the weight distribution
within days from the cut off date. The literature also uses the quarter of
birth as a controlling variable of the cut off date when the children must join
school, which happens to be in March 31st, McEwan and Saphiro (2006),
with a flexible period for late entering students of three months or until July
1st. The quarter of birth will also control for those students that just missed
the cut off date and will eventually have to wait another year to be submitted
into first grade.
Finally, given that the data used in this work is limited to characteris-
tics of the establishment and some characteristics of the student, there is no
family background or social status that will allow me to control for certain
differences between the students within an establishment. However, I utilize
gender of the student to control for possible heterogeneity between boys and
girls, which is standard in this literature. I will eventually find that there is a
negative correlation between being a boy and having a higher GPA, having a
higher probability of attending secondary school, and a lower dropout rates.
The following models will describe the real purpose of this article and what
is it that this study is trying achieve by explaining he effect of early grade
retention of long-term student’s outcomes.
Some Descriptive statistics are shown below to specify the variables uses
in this study.
Table 1 shows a summary statistics of the variables that will be utilized
in the models. As shown, the general point average (GPA) for students at
the end of sixth grade grade is 5.6 out of a scale of 1 through 7 in the Chilean
score system. This is an elevated score for a sample of over 139 thousand
observations, meaning that in general students do very well in their scores
by the end of their academic year. GPA for eighth grade is very similar to
sixth, which only shows that students, on average, tend to be persistent in
their scores throughout primary school. As for the probability of attending
secondary school, we observe that about 93 percent of the student body
in our sample get to graduate primary school, which in fact is mandatory.
Nonetheless, there is still a big part of the sample, about 6.7 percent, that
do not get to finish primary and either disappear from the sample. Dropout
is about a tenth of the sample in secondary school only. The variables for
9
Table 1: Summary statistics
Variable Mean Std. Dev. Min. Max. N
Establishment (RBD) 8778.523 7000.187 5 25810 139613
ID number 10875154.995 6696498.007 150 25024246 139613
RBD in 6th grade 9394.735 7418.757 5 40403 135626
RBD in 8th grade 9556.023 7609.111 5 40436 132458
RBD in Primary 9321.127 7337.136 5 40298 139613
GPA in 6th grade 5.608 0.616 1 62 135626
GPA in 8th grade 5.579 0.583 1 48 132458
Prob.attending S. School 0.933 0.25 0 1 139613
Repeated between 1-2 0.028 0.164 0 1 139613
Repeated between 3-4 0.054 0.227 0 1 139613
Repeated between 1-4 0.077 0.266 0 1 139613
Repeated between 1-8 0.18 0.384 0 1 139613
Dropout 0.105 0.307 0 1 139613
ndays 128.519 125.963 -382 678 139602
ndaysme271 0 0.011 0 1 139613
ndaysme181_270 0.001 0.039 0 1 139613
ndaysme91_180 0.004 0.059 0 1 139613
ndaysme61_90 0.043 0.204 0 1 139613
ndaysme31_60 0.055 0.229 0 1 139613
ndaysme30_30 0.141 0.348 0 1 139613
ndaysma31_60 0.077 0.266 0 1 139613
ndaysma61_90 0.081 0.273 0 1 139613
ndaysma91_180 0.249 0.433 0 1 139613
ndaysma181_270 0.244 0.429 0 1 139613
ndaysma271_360 0.074 0.262 0 1 139613
ndaysma361 0.03 0.17 0 1 139613
Student’s gender 0.509 0.5 0 1 139613
Quarter of Birth 2.546 1.123 1 4 139613
10
the number of days a student has from his birthday to the last cut off date
he can be admitted that year ranges from a year early to about two years. In
other words, ages go from five to seven years of age in the sample. Another
important statistic to notice is that about 50% of the students in the sample
are within the range of 91 and 270 days of age from the cut off date which
implies that about half of the students will belong to the second quarter of
the year and will most likely have to wait another year to be admitted to
first grade. Table 2 shows in more detail the outcome variables used in this
article.
Table 2: Tabulations
Item Number Per cent
Dropped out in S. School
Attending 124,888 89
Dropout 14,725 11
Total 139,613 100
Repeated between 1-4
Didn’t repeat 128,919 92
Repeated grade 10,694 8
Total 139,613 100
Repeated between 1-2
Didn’t repeat 135,732 97
Repeated grade 3,881 3
Total 139,613 100
Repeated between 3-4
Didn’t repeat 132,010 95
Repeated grade 7,603 5
Total 139,613 100
Repeated in Primary School
Didn’t repeat 114,459 82
Repeated grade 25,154 18
Total 139,613 100
Attended S. School
Attending S. School 130,224 93
Not attending S. School 9,389 7
Total 139,613 100
11
Table 2 shows some detailed descriptions for the major variables used,
taking into account both exogenous and endogenous variables. It is impor-
tant to notice that our dropout rate in secondary school is 11%, meaning
that about a tenth of the children disappear from the data before finishing
in 2014. Dropout rate in primary school shows up to be smaller that the
secondary school dropout rate, which might be counter intuitive since most
of the children tend to quit school at an early age. However, these results
account for administrative errors for which the students in first grade tend
to disappear. Moreover, we will be using only the dropout rate for secondary
school in this study. Another interesting statistic is that of ever repeating a
grade between first and second, third and fourth, and first and fourth. The
fraction of students who did not attend secondary school is very low for the
size of the data of only 7%; however, it has a high positive correlation with
those students who repeated grade at an early age.
3 Estimation strategy using an IV framework
I begin by presenting three simple models of grade retention as a key to ana-
lyze some of the most important effects that early repetition has on student’s
outcomes 6
.
3.1 GPA
The first outcome I present is divided into two separate models to show the
impacts of early retention into immediate and long-term outcomes. The first
explains the effect of early repetition as function of immediate academic out-
comes, in this case, 6th grade GPA. The second, focuses on the impact in
8th grade GPA. This important distinction is made in order to see whether
repeating as an early child has long lasting effects on GPA or if this effect
actually dissipates over time.
6th Grade Model:
GPA_6ir = β0 + β1Repite_1_2ir + γXir + δr + uir (1)
6
This study was made to see the true effect of grade repetition at an early age, which
we account as ever repeating between first and second grade. The results and models are
also presented in the appendix for grade repetition in third to fourth grade, first to fourth
grade, and first to eight grade. We focus on repetition between first and second grade
given the fact that our instruments are only relevant during the first years of primary
school education.
12
From equation (1) we have that the subscript i represents the individual
student and r represents the establishment where he is located at that mo-
ment 7
. The vector Xir is the vector of the control variables described in the
previous section, in this case, we only focus on the gender of the individual.
This model will try to explain the causal effect that repeating a grade
in the early years of primary school has on the academic achievement of the
child at the end of the school year. To do this, I use the instrumental variable
approach using the quarter of birth and the relative age in days from the cut
off date as variables describing the physical maturity of the child. Moreover,
I will run a first stage where I will test the relevance of the instruments in
the model. Equation (2) shows the structure of the first stage where Zir
represents the vector of my instrumental variables.
Repite_1_2ir = γ0 + γXir + θZirδr + eir (2)
8th Grade Model:
The second model provides information about the achievement of the
child in the subsequent years after repeating grade at an early age for the
first time. It tries to explain whether the effects of repetition in a student’s
performance (if it helps him or if it hurts him) have a long lasting effect in
primary school. This is important to address, given the implications that
poor academic scores mean in the development of the student. Jacob and
Lefgren (2004), use a regression discontinuity approach to study this par-
ticular effect, the results they obtained showed a positive effect of taking
summer school and repeating a grade on third grade achievement in math as
well as reading. However, the impact that it had on later years became less
significant and they concluded that it started to fade by roughly 25 to 40%
all the way to sixth grade8
.
GPA_8ir = β0 + β1Repite_1_2ir + γXir + δr + uir (3)
By looking at GPA, this article will attempt to explain the effect that re-
peating grade has on achievement and academic progression. If by repeating
a grade a student will move higher in achievement, then that will give prove
that the current Chilean system works. However, if the contrary happens,
we will see that repeating a grade will cause a student to go even lower in
7
The establishment will change according to the outcome variable, and with it the
number of observations.
8
They also explain that this effect is consistent with the fadeout of program effects
found in other evaluations (Bernett 1995)
13
his academic achievement affecting him psychologically in the long term for
multiple reasons.
3.2 Probability of Attending Secondary School
For the second model I want to estimate the probability of attending sec-
ondary school when the child has repeated at an early age. The purpose is
to see the real impact that repetition has on children. The negative psycho-
logical effects this generates, and the possible solutions we could address to
avoid this damage.
The model starts with the definition of attending secondary school, by
this we mean having ever completed primary school and entering first grade
of secondary school between the period of 2002 and 2014. Whether the stu-
dent left for a long period of time or not, if the observation we have of the
student appears once in our data base in secondary school, then we consider
that individual as part of the sample in study.
emediair = βo + β1Repite_1_2ir + γXir + δr + uir (4)
What equation (5) will try to explain is the true effect of early grade
repetition on the probability that a student ever attends secondary school.
In Chile, secondary school is, by law, mandatory9
. However, it can be seen
throughout the country that a vast majority of rural schools still experience
large quantities of their students who finish primary school without contin-
uing to secondary school as the following step for their education.
3.3 Probability of Dropping Out
Our last model shows the effect of early grade retention in the probability of
dropping out of secondary school. This model tries to imitate the literature
of Eide and Showalter (2001). They found that retaining a child results in
an 8.8% increase in the probability of dropping out of high school10
using
OLS. However, they find this result to be not economically significant given
that OLS would not capture the causal effect of repetition since this variable
is endogenous on unobserved characteristics. When controlling for IV, they
9
Mandatory only means that the government provides all the possibilities and resources
towards municipal schools and non-fee-charging schools for all students to attend it.
10
Eide and Showalter (2001)
14
find expected signs implying a positive effect of retention on dropout.
Dropoutir = β0 + β1Repite_1_2ir + γXir + δr + uir (5)
As Eide and Showalter (2001) show, I also find, after controlling for the endo-
geneity of early grade retention, that there is a positive correlation between
repeating a grade in primary school and dropping out of secondary school.
I use the instrumental variable approach to find the causal effect of this
relation; however, there might still be some bias regarding the students char-
acteristics making the coefficients to be exaggerated upwards. Given that I
use administrative data that has no records on family background, I am not
able to control for parents education (which previous literature focus on);
however, I expect that controlling for establishment captures most of this
effect. Chilean education is very segregated and usually the establishment
can capture the social status of the family11
.
4 Results
4.1 Model 1
4.1.1 Academic Achievement
Table 3 shows the ordinary least squares, fixed effect and instrumental
variable estimations of early repetition on students GPA. When interpreting
this table casually, we can see that OLS and FE give similar estimators for
the effect of retention on GPA. In sixth grade GPA we can see that by repeat-
ing at an early age the average score will fall by 0.5 points on average with
OLS, and about 0.47 points with FE. This decrease on GPA allows us to have
an idea of the direction repetition has on academic achievement. However,
we cannot rely on these results to make the ultimate conclusions given that
they contain the selection bias explained before. What is interesting as well
is the effect that gender has on average scores. This implies that being a male
reduces also the academic achievement of the child. Eight grade scores show
11
This will change later on with a targeting voucher policy (SEP) that was put in place in
2008. This policy allows vulnerable students with no resources to apply to any municipal,
private-voucher school in the country without paying, as long as they qualify for it. There
might also be an effect in retention given that vulnerable students are allowed to repeat
grade at least once for a specific grade without affecting their eligibility. Nonetheless, it
does not apply to our study since the 2003 cohort I use does not experience this policy for
the time studied.
15
Table3:Model1:Theeffectofrepeatingin1-2gradeon6thand8thgradeGPA
GPA6thGPA6thGPA6thGPA8thGPA8thGPA8th
OLSFEIVOLSFEIV
Repeatedbetween1-2-0.505∗∗∗
-0.464∗∗∗
-0.724∗∗∗
-0.387∗∗∗
-0.362∗∗∗
-0.595∗∗∗
(0.0105)(0.0109)(0.0273)(0.0111)(0.0113)(0.0294)
Gender-0.183∗∗∗
-0.186∗∗∗
-0.185∗∗∗
-0.156∗∗∗
-0.158∗∗∗
-0.158∗∗∗
(0.00328)(0.00379)(0.00327)(0.00317)(0.00395)(0.00313)
Constant5.711∗∗∗
5.730∗∗∗
5.736∗∗∗
5.664∗∗∗
5.671∗∗∗
5.675∗∗∗
(0.00225)(0.00382)(0.00380)(0.00222)(0.00408)(0.00379)
Observations135626135626135626132458132458132458
Standarderrorsinparentheses
∗
p<.1,∗∗
p<.05,∗∗∗
p<.01
16
a similar result, nevertheless, the impact is not as negative as the immediate
effect in sixth grade. We see on the results that early repetition reduces GPA
in around 0.4 points for both OLS and FE.
Table 3 also shows the results for our instrumental variable approach. As
we can see, the direction of the coefficient follows that the standard litera-
ture and shows that early grade repetition has a negative effect on 6th grade
and 8th grade GPA. We can see that repeating in first or second grade, af-
ter controlling for the maturity of the child, lowers sixth grade GPA in 0.72
points on average being statistically significant at the 1 percent level. 8th
grade GPA shows a similar result of about 0.6 points. These results attempt
to show the causal effect of grade repetition on academic achievement on
6th and 8th grade. To see, however, the effect that the results are in fact
unbiased we will see the first stage results in table 4 to test whether our
instruments are exogenous and statistically significant.
Table 4 shows the first stage for 6th and 8th grades respectively. One
of the most interesting results that we found in our first stage is that of the
number of days the student has with respect to the cut off date in first grade.
As we can see, there is a negative correlation between repeating a grade as
an early child and the number of days. This only supports the theory behind
the previous literature, implying that the younger the student is the more
the probability of repeating. We can also see that for the quarter of birth.
Our second quarter accounts for a negative correlation with grade repetition,
while the first and third show a positive correlation. This also makes sense
due to the cut off date where children are allowed to be submitted into their
first year. According to the Chilean educational system, children born after
March 31st have to wait until the next year to be admitted into first grade,
therefore, those born in the second quarter will always be older that those
born in the first, giving a negative correlation between being older and re-
peating a grade (supporting in this way the theory planted in this article).
The coefficients of our instruments follow the signs expected in the study
and they are also statistically significant at the one percent level. We can
therefore argue that the instruments used in this article will in fact control
for the endogenous features of repetition.
Therefore, this first model shows that academic achievement in the form
of average general points throughout the year has a negative relation with
grade repetition. This can only pinpoint the fact that, if GPA is really the
best measure of student academic achievement, then grade repetition is af-
fecting negatively their performance instead of repairing the problem. Most
17
schools and universities focus on this measure of achievement as a reliable
source to select their students and allow them to continue studying. How-
ever, if repeating hurts the student in the long run, as it is shown in the
regression, then it might not be the most effective policy.
4.2 Model 2
4.2.1 Attending Secondary School
Table (5) shows the effect that early grade retention has on the probability
of the child to ever attend secondary school and graduate from primary
school. As we can see, OLS estimation overestimates the result given the
selection bias. When using fixed effects to control for the heterogeneity of
the establishment and control for some of the parental background, we can see
that the coefficient becomes less negative to a 16 percentage point decrease
in the probability of attending secondary school. Moreover, we expect the
coefficient of out instrumental variable approach to be smaller than when
using OLS estimation, for which this is the case. IV estimation shows a
25 percentage point decrease in the probability of ever attending secondary
school being statistically significant at the one percent level. This result is
economically significant since it represents a big decrease in the probability.
Allowing children to repeat grade at an early age therefore, results in a very
negative outcome in the long run. If this is the causal effect that repetition
has on attending secondary school, it then requires a closer focus by the
Chilean educational authority.
4.3 Model 3
4.3.1 School Abandonment
Table 6 shows the final set of regression results which focus on the effect
that early grade retention has on the probability of a student to dropout of
secondary school. Its important to notice that there is a positive correla-
tion between repetition and secondary school dropout. Column 1 shows the
coefficients of ordinary least squares estimation with a 5.7 percentage point
increase in the probability of dropping out of secondary school. This result is
important since it provides us with information about the size and direction
18
Table 4: First Stage - Repeating betw een 1-2 (6th grade GPA)
Variable Coefficient (Std. Err.)
Student’s gender .0013703 (.0007226)
ndays < -271 -.3854225 (.0333188)
-270 < ndays < -181 -.3525221 (.0094594)
-180 < ndays < -91 -.3626432 (.0064068)
-90 < ndays < -61 -.3751106 (.0032886)
-60 < ndays < -31 -.3754839 (.0031936)
-30 < ndays < 30 -.3752266 (.002792)
31 < ndays < 60 -.3741157 (.0029857)
61 < ndays < 90 -.3769847 (.0029314)
91 < ndays < 180 -.3818646 (.0031299)
181 < ndays < 270 -.3665173 (.0030901)
271 < ndays < 360 -.3302267 (.002979)
ndays > 360 0 (omitted)
First Quarter 0 (empty)
Second Quarter .0022029 (.0017097)
Third Quarter -.0116519 (.0029583)
Fourth Quarter .0050125 (.0033092)
Intercept .3888705 (.0028034)
Number of Obs 135626 135626
19
Table 5: Model 2: The effect of repeating in 1-2 grade on the probability of
attending s. school
S. School S. School S. School
OLS FE IV
Repeated between 1-2 -0.463∗∗∗
-0.163∗∗∗
-0.249∗∗∗
(0.00803) (0.00823) (0.00748)
Gender -0.0270∗∗∗
-0.00578∗∗∗
-0.00616∗∗∗
(0.00127) (0.000837) (0.000794)
Constant 0.959∗∗∗
0.975∗∗∗
0.981∗∗∗
(0.000795) (0.000928) (0.000818)
Observations 139613 132458 132458
Standard errors in parentheses
∗
p < .1, ∗∗
p < .05, ∗∗∗
p < .01
of the bias. Column 2 shows the results controlling for establishment and the
output becomes smaller by this with a 3.5 percentage point increase. Both
these results are not too relevant considering the magnitude of the coefficient
and the size of its standard error. However, when applying the instrumental
variable approach we can observe that the direction of the result remains,
while the magnitude changes describing a 33.4 percentage point increase in
the probability of dropping out when repeating a grade at an early age being
statistically significant at the one percent level and economically significant.
5 Conclusions
Grade retention has remained a controversial remedial policy all around de-
veloping countries. There are those who argue that it provides the neces-
sary tools and additional maturity to withstand the following grades. Other
suggest that retention put negative psychological restraint on children for
their academical and cognitive development. In this article, we analyze the
effect that early grade retention has on children in their academic achieve-
ment along primary school, their probability of graduation and progression
to secondary school and their probability of abandonment. We also try to
demonstrate that through an instrumental variable approach we can approx-
imate the causal effect and counter-strike the endogenous characteristics of
repetition.
20
Table 6: Model 3: The effect of repeating in 1-2 grade on the probability of
dropping out of s. school
S. School Dropout S. School Dropout S. School Dropout
OLS FE IV
Repeated between 1-2 0.0572∗∗∗
0.0358∗∗∗
0.334∗∗∗
(0.00598) (0.00647) (0.0122)
Gender 0.0173∗∗∗
0.0153∗∗∗
0.0133∗∗∗
(0.00164) (0.00172) (0.00169)
Constant 0.0951∗∗∗
0.102∗∗∗
0.0927∗∗∗
(0.00113) (0.00156) (0.00159)
Observations 139613 139613 139613
Standard errors in parentheses
∗
p < .1, ∗∗
p < .05, ∗∗∗
p < .01
For the three models described in this study, we demonstrate that grade
repetition has a negative impact on students outcomes. The first model ex-
plains that having ever repeated between first and second grade reduces the
general point average by 0.72 points. This reduction becomes significant
since it describes a decrease in the most important achievement determinant
and therefore, describes future outcomes of the child. The second model is
probably the most significant one since it explains the graduation rate from
primary school. With a reduction of 25 percentage points in the probability
of attending secondary school there is a significant negative effect on future
outcomes for the child. This reduction in the probability represents a big
result given that labor market options will become narrower in the future
and the probability of criminal acts will increase. Finally, The probability
of dropout from secondary school provides a glimpse of the lack of deter-
mination to complete school. The fact that early repetition has a positive
and significant correlation with dropout with 33 percentage point increase
in the probability suggests that schools that allow this remedial policy are
sentencing the child to under-perform in their future classes allowing them
to chose abandonment in the future. Looking at these results one can argue
that in the Chilean educational system grade repetition might not be the best
remedial policy to counter-attack the growing difficulty levels in primary and
secondary school, at least in the early stages. Moreover, other options of re-
medial policies should be suggested to avoid most of these negative outcomes.
Most developed countries have switched towards a more linear approach
21
which is the automatic progression policy, which allows the student to auto-
matically pass the grade regardless of their final grade. In the case of Finland,
students who score lower than the required threshold obtain special support
by specific professors to allow them to strengthen the courses in which they
are failing. This policy allows students to continue with their initial group of
peers and corrects for some of the psychological effects concerned with grade
repetition. Jacob and Lefgren (2009) explain that another possible remedial
solution might be a pre-course or summer course before making the decision
to repeat the grade. They showed that summer school has a positive effect
in math and reading scores in the short run allowing the students to improve
and enhance those skills that weren’t learned during the course of the first
program. Even though these effects were only noticeable in the first few years
after summer school and were not significant in following years, this could be
more than necessary to correct for the immediate necessity of strengthening
their weak subjects and still give the children the opportunity to continue
with their initial group.
Finally, there are many other methods already used in many developed
countries who have already seen the negative effects of early grade repetition.
Some will continue to utilize, however, grade retention as the main remedial
policy continuing, in this way, with this controversial subject. In the case of
Chile, what is important in not necessarily trying find what the best remedial
method for children is, but to understand the real causes of this decrease in
productivity and academic achievement for students whose only fault is their
lack of initial maturity.
6 Appendix
6.1 Cohort 2003
6.1.1 Tables for ever repeating between third and fourth grade
22
Figure 1: Yearly Assistance Rate
Table 7: Model 1: The effect of repeating in 3-4 grade on 6th and 8th grade
GPA
GPA 6 GPA 6 GPA 6 GPA 8 GPA 8 GPA 8
MCO FE IV MCO FE IV
Repeat 3-4 -0.539∗∗∗
-0.489∗∗∗
-3.827∗∗∗
-0.432∗∗∗
-0.396∗∗∗
-3.571∗∗∗
(0.00607) (0.00675) (0.183) (0.00661) (0.00701) (0.212)
Gender -0.174∗∗∗
-0.178∗∗∗
-0.110∗∗∗
-0.150∗∗∗
-0.153∗∗∗
-0.108∗∗∗
(0.00325) (0.00375) (0.00628) (0.00314) (0.00390) (0.00564)
Constant 5.723∗∗∗
5.742∗∗∗
5.871∗∗∗
5.673∗∗∗
5.681∗∗∗
5.806∗∗∗
(0.00224) (0.00379) (0.00900) (0.00222) (0.00407) (0.00970)
Observations 135626 135626 135626 132458 132458 132458
Standard errors in parentheses
∗
p < .1, ∗∗
p < .05, ∗∗∗
p < .01
23
Table 8: Model 2: The effect of repeating in 3-4 grade on the probability of
attending s. school
S. School S. School S. School
MCO FE IV
Repeated 3-4 -0.289∗∗∗
-0.108∗∗∗
-0.732∗∗∗
(0.00547) (0.00461) (0.0473)
Gender -0.0237∗∗∗
-0.00449∗∗∗
0.00373∗∗∗
(0.00128) (0.000830) (0.00125)
Constant 0.961∗∗∗
0.977∗∗∗
1.008∗∗∗
(0.000811) (0.000927) (0.00220)
Observations 139613 132458 132458
Standard errors in parentheses
∗
p < .1, ∗∗
p < .05, ∗∗∗
p < .01
Table 9: Model 3: The effect of repeating in 3-4 grade on the probability of
dropping out of s. school
Dropout Dropout Dropout
MCO FE IV
Repeated 3-4 0.0401∗∗∗
0.0244∗∗∗
0.797∗∗∗
(0.00414) (0.00424) (0.0617)
Gender 0.0168∗∗∗
0.0150∗∗∗
-0.00276
(0.00164) (0.00173) (0.00240)
Constant 0.0948∗∗∗
0.102∗∗∗
0.0634∗∗∗
(0.00113) (0.00156) (0.00344)
Observations 139613 139613 139613
Standard errors in parentheses
∗
p < .1, ∗∗
p < .05, ∗∗∗
p < .01
24
6.1.2 Tables for ever repeating between first and fourth grade
Table 10: Model 1: The effect of repeating in 1-4 grade on 6th and 8th grade
GPA
GPA 6 GPA 6 GPA 6 GPA 8 GPA 8 GPA 8
MCO FE IV MCO FE IV
Repeat 1-4 -0.538∗∗∗
-0.497∗∗∗
-0.787∗∗∗
-0.426∗∗∗
-0.398∗∗∗
-0.661∗∗∗
(0.00548) (0.00613) (0.0271) (0.00590) (0.00637) (0.0294)
Gender -0.173∗∗∗
-0.177∗∗∗
-0.172∗∗∗
-0.150∗∗∗
-0.153∗∗∗
-0.149∗∗∗
(0.00323) (0.00373) (0.00328) (0.00313) (0.00390) (0.00314)
Constant 5.731∗∗∗
5.753∗∗∗
5.774∗∗∗
5.679∗∗∗
5.689∗∗∗
5.704∗∗∗
(0.00223) (0.00380) (0.00417) (0.00222) (0.00408) (0.00415)
Observations 135626 135626 135626 132458 132458 132458
Standard errors in parentheses
∗
p < .1, ∗∗
p < .05, ∗∗∗
p < .01
25
Table 11: Model 2: The effect of repeating in 1-4 grade on the probability of
attending s. school
S. School S. School S. School
MCO FE IV
Repeat 1-4 -0.334∗∗∗
-0.118∗∗∗
-0.242∗∗∗
(0.00471) (0.00405) (0.00754)
Gender -0.0211∗∗∗
-0.00434∗∗∗
-0.00296∗∗∗
(0.00124) (0.000825) (0.000809)
Constant 0.969∗∗∗
0.980∗∗∗
0.991∗∗∗
(0.000771) (0.000886) (0.000940)
Observations 139613 132458 132458
Standard errors in parentheses
∗
p < .1, ∗∗
p < .05, ∗∗∗
p < .01
Table 12: Model 3: The effect of repeating in 1-4 grade on the probability of
dropping out of s. school
Dropout Dropout Dropout
MCO FE IV
Repeat 1-4 0.0529∗∗∗
0.0358∗∗∗
0.309∗∗∗
(0.00362) (0.00387) (0.0123)
Gender 0.0162∗∗∗
0.0146∗∗∗
0.00735∗∗∗
(0.00164) (0.00173) (0.00174)
Constant 0.0932∗∗∗
0.101∗∗∗
0.0797∗∗∗
(0.00113) (0.00157) (0.00179)
Observations 139613 139613 139613
Standard errors in parentheses
∗
p < .1, ∗∗
p < .05, ∗∗∗
p < .01
26
6.1.3 Tables for ever repeating between first and eighth grade
Table 13: Model 2: The effect of repeating in 1-8 grade on the probability of
attending s. school
S. School S. School S. School
MCO FE IV
Repeat all Primary -0.246∗∗∗
-0.103∗∗∗
-0.232∗∗∗
(0.00283) (0.00234) (0.00771)
Gender -0.0112∗∗∗
0.000260 0.00794∗∗∗
(0.00122) (0.000805) (0.000943)
Constant 0.983∗∗∗
0.988∗∗∗
1.009∗∗∗
(0.000712) (0.000777) (0.00142)
Observations 139613 132458 132458
Standard errors in parentheses
∗
p < .1, ∗∗
p < .05, ∗∗∗
p < .01
27
Table 14: Model 3: The effect of repeating in 1-8 grade on the probability of
dropping out of s. school
Dropout Dropout Dropout
MCO FE IV
Repeat all Primary 0.103∗∗∗
0.0961∗∗∗
0.297∗∗∗
(0.00262) (0.00289) (0.0128)
Gender 0.00960∗∗∗
0.00801∗∗∗
-0.00752∗∗∗
(0.00163) (0.00171) (0.00197)
Constant 0.0821∗∗∗
0.0883∗∗∗
0.0571∗∗∗
(0.00112) (0.00157) (0.00250)
Observations 139613 139613 139613
Standard errors in parentheses
∗
p < .1, ∗∗
p < .05, ∗∗∗
p < .01
7 Literature
References
[1] Cáceres-Delpiano, J. and Giolito, E. The impact of age of entry on aca-
demic progression. Journal of Economic Literature, 2014.
[2] Eide, E. and Showalter, M. The effect of grade retention on educational
and labor market outcomes. Economics of Education Review, Vol. 20,
issue 6, December 2001.
[3] Elodie, A. Is grade repetition a second chance?. Journal of Economic
Literature, January 2010.
[4] Fertig, M. and Kluve, J. The effect of age at school entry on educational
attainment in Germany. The institute for the Study of Labor (IZA),
March 2005.
[5] Jacob, B. and Lefgren, L. Remedial education and student achievement: A
regression discontinuity analysis. The Review of Economics and Statistics,
Vol. 86, issue 1, February 2004.
[6] Jacob, B. and Lefgren, L. The effect of grade retention on High School
completion. Journal of Pubic Economics, Vol. 1, issue 3, July 2009.
28
[7] Manacorda, M. The cost of grade retention. The Review of Economics
and Statistics, Vol. 94, issue 2, May 2012.
[8] McEwan, P. and Shapiro, J. The benefits of delayed primary school en-
rollment: Discontinuity estimates using exact birth dates. The Journal of
Human Resources, July 2006.
29

Más contenido relacionado

La actualidad más candente

mathematics efficacy, anxiety and students performance in introductory techno...
mathematics efficacy, anxiety and students performance in introductory techno...mathematics efficacy, anxiety and students performance in introductory techno...
mathematics efficacy, anxiety and students performance in introductory techno...mustapha adeniyi
 
My Thesis (Draft 3) September 02, 2017 9:57 pm
My Thesis (Draft 3) September 02, 2017 9:57 pmMy Thesis (Draft 3) September 02, 2017 9:57 pm
My Thesis (Draft 3) September 02, 2017 9:57 pmRigino Macunay Jr.
 
Comparative analysis of_learner_satisfaction_and_learning_outcomes[1]
Comparative analysis of_learner_satisfaction_and_learning_outcomes[1]Comparative analysis of_learner_satisfaction_and_learning_outcomes[1]
Comparative analysis of_learner_satisfaction_and_learning_outcomes[1]u053675
 
Donna Holt, National Refereed Article Published in NATIONAL FORUM JOURNALS -...
Donna Holt,  National Refereed Article Published in NATIONAL FORUM JOURNALS -...Donna Holt,  National Refereed Article Published in NATIONAL FORUM JOURNALS -...
Donna Holt, National Refereed Article Published in NATIONAL FORUM JOURNALS -...William Kritsonis
 
The Over Reliance on Standardized Testing in Cameroon Implications for the Pr...
The Over Reliance on Standardized Testing in Cameroon Implications for the Pr...The Over Reliance on Standardized Testing in Cameroon Implications for the Pr...
The Over Reliance on Standardized Testing in Cameroon Implications for the Pr...ijtsrd
 
Ace conference presentation 2015
Ace conference presentation 2015Ace conference presentation 2015
Ace conference presentation 2015Mike Mel
 
Faheem, shima mohamed successful use of science process skills nftej v25...
Faheem, shima mohamed successful use of science process skills nftej v25...Faheem, shima mohamed successful use of science process skills nftej v25...
Faheem, shima mohamed successful use of science process skills nftej v25...William Kritsonis
 
EVALUATE THE AFFECTED FACTORS ON STUDENTS’ MATHEMATICS PERFORMANCE IN RURAL A...
EVALUATE THE AFFECTED FACTORS ON STUDENTS’ MATHEMATICS PERFORMANCE IN RURAL A...EVALUATE THE AFFECTED FACTORS ON STUDENTS’ MATHEMATICS PERFORMANCE IN RURAL A...
EVALUATE THE AFFECTED FACTORS ON STUDENTS’ MATHEMATICS PERFORMANCE IN RURAL A...ijejournal
 
Dr. Fred C. Lunenburg - reporting to parents and families schooling v1 n1 2010
Dr. Fred C. Lunenburg - reporting to parents and families schooling v1 n1 2010Dr. Fred C. Lunenburg - reporting to parents and families schooling v1 n1 2010
Dr. Fred C. Lunenburg - reporting to parents and families schooling v1 n1 2010William Kritsonis
 
Hemmer, lynn a cross case state analysis ijobe v2 n1 2014
Hemmer, lynn a cross case state analysis ijobe v2 n1 2014Hemmer, lynn a cross case state analysis ijobe v2 n1 2014
Hemmer, lynn a cross case state analysis ijobe v2 n1 2014William Kritsonis
 
A Multidimensional Analysis of Teacher Preparation in Texas
 A Multidimensional Analysis of Teacher Preparation in Texas A Multidimensional Analysis of Teacher Preparation in Texas
A Multidimensional Analysis of Teacher Preparation in TexasResearch Journal of Education
 
Steven Norfleet, PhD Proposal Defense, Dr. William Allan Kritsonis, Dissertat...
Steven Norfleet, PhD Proposal Defense, Dr. William Allan Kritsonis, Dissertat...Steven Norfleet, PhD Proposal Defense, Dr. William Allan Kritsonis, Dissertat...
Steven Norfleet, PhD Proposal Defense, Dr. William Allan Kritsonis, Dissertat...William Kritsonis
 

La actualidad más candente (16)

mathematics efficacy, anxiety and students performance in introductory techno...
mathematics efficacy, anxiety and students performance in introductory techno...mathematics efficacy, anxiety and students performance in introductory techno...
mathematics efficacy, anxiety and students performance in introductory techno...
 
My Thesis (Draft 3) September 02, 2017 9:57 pm
My Thesis (Draft 3) September 02, 2017 9:57 pmMy Thesis (Draft 3) September 02, 2017 9:57 pm
My Thesis (Draft 3) September 02, 2017 9:57 pm
 
Comparative analysis of_learner_satisfaction_and_learning_outcomes[1]
Comparative analysis of_learner_satisfaction_and_learning_outcomes[1]Comparative analysis of_learner_satisfaction_and_learning_outcomes[1]
Comparative analysis of_learner_satisfaction_and_learning_outcomes[1]
 
2 study
2 study2 study
2 study
 
2 caldero done
2 caldero done2 caldero done
2 caldero done
 
Eunetra Ellison-Simpson
Eunetra Ellison-SimpsonEunetra Ellison-Simpson
Eunetra Ellison-Simpson
 
Donna Holt, National Refereed Article Published in NATIONAL FORUM JOURNALS -...
Donna Holt,  National Refereed Article Published in NATIONAL FORUM JOURNALS -...Donna Holt,  National Refereed Article Published in NATIONAL FORUM JOURNALS -...
Donna Holt, National Refereed Article Published in NATIONAL FORUM JOURNALS -...
 
The Over Reliance on Standardized Testing in Cameroon Implications for the Pr...
The Over Reliance on Standardized Testing in Cameroon Implications for the Pr...The Over Reliance on Standardized Testing in Cameroon Implications for the Pr...
The Over Reliance on Standardized Testing in Cameroon Implications for the Pr...
 
Assessment 3
Assessment 3Assessment 3
Assessment 3
 
Ace conference presentation 2015
Ace conference presentation 2015Ace conference presentation 2015
Ace conference presentation 2015
 
Faheem, shima mohamed successful use of science process skills nftej v25...
Faheem, shima mohamed successful use of science process skills nftej v25...Faheem, shima mohamed successful use of science process skills nftej v25...
Faheem, shima mohamed successful use of science process skills nftej v25...
 
EVALUATE THE AFFECTED FACTORS ON STUDENTS’ MATHEMATICS PERFORMANCE IN RURAL A...
EVALUATE THE AFFECTED FACTORS ON STUDENTS’ MATHEMATICS PERFORMANCE IN RURAL A...EVALUATE THE AFFECTED FACTORS ON STUDENTS’ MATHEMATICS PERFORMANCE IN RURAL A...
EVALUATE THE AFFECTED FACTORS ON STUDENTS’ MATHEMATICS PERFORMANCE IN RURAL A...
 
Dr. Fred C. Lunenburg - reporting to parents and families schooling v1 n1 2010
Dr. Fred C. Lunenburg - reporting to parents and families schooling v1 n1 2010Dr. Fred C. Lunenburg - reporting to parents and families schooling v1 n1 2010
Dr. Fred C. Lunenburg - reporting to parents and families schooling v1 n1 2010
 
Hemmer, lynn a cross case state analysis ijobe v2 n1 2014
Hemmer, lynn a cross case state analysis ijobe v2 n1 2014Hemmer, lynn a cross case state analysis ijobe v2 n1 2014
Hemmer, lynn a cross case state analysis ijobe v2 n1 2014
 
A Multidimensional Analysis of Teacher Preparation in Texas
 A Multidimensional Analysis of Teacher Preparation in Texas A Multidimensional Analysis of Teacher Preparation in Texas
A Multidimensional Analysis of Teacher Preparation in Texas
 
Steven Norfleet, PhD Proposal Defense, Dr. William Allan Kritsonis, Dissertat...
Steven Norfleet, PhD Proposal Defense, Dr. William Allan Kritsonis, Dissertat...Steven Norfleet, PhD Proposal Defense, Dr. William Allan Kritsonis, Dissertat...
Steven Norfleet, PhD Proposal Defense, Dr. William Allan Kritsonis, Dissertat...
 

Destacado

Bán, cho thuê bộ cắt băng khánh thành giá rẻ nhất tại TP.HCM
Bán, cho thuê bộ cắt băng khánh thành giá rẻ nhất tại TP.HCMBán, cho thuê bộ cắt băng khánh thành giá rẻ nhất tại TP.HCM
Bán, cho thuê bộ cắt băng khánh thành giá rẻ nhất tại TP.HCMSEOGOOGLE
 
Super copa gaúcha artilharia
Super copa gaúcha   artilhariaSuper copa gaúcha   artilharia
Super copa gaúcha artilhariaRafael Passos
 
The Zen of Python
The Zen of PythonThe Zen of Python
The Zen of Python7pairs
 
Ninguém explica deus violin i
Ninguém explica deus   violin iNinguém explica deus   violin i
Ninguém explica deus violin iAlbertino Moura
 
(0341)553240 Vokasi ub, Vokasi ub 2015, Vokasi ub malang, Program Vokasi Braw...
(0341)553240 Vokasi ub, Vokasi ub 2015, Vokasi ub malang, Program Vokasi Braw...(0341)553240 Vokasi ub, Vokasi ub 2015, Vokasi ub malang, Program Vokasi Braw...
(0341)553240 Vokasi ub, Vokasi ub 2015, Vokasi ub malang, Program Vokasi Braw...Puteri Aisah
 
Examen neurologico
Examen neurologicoExamen neurologico
Examen neurologicofenix27
 
Presentation1
Presentation1Presentation1
Presentation1lfbvlblb
 
Origins of Public Relations
Origins of Public RelationsOrigins of Public Relations
Origins of Public RelationsKelli Burns
 
Recent Advances in NGS Technologies, LaserGen & Baylor College of Medicine, M...
Recent Advances in NGS Technologies, LaserGen & Baylor College of Medicine, M...Recent Advances in NGS Technologies, LaserGen & Baylor College of Medicine, M...
Recent Advances in NGS Technologies, LaserGen & Baylor College of Medicine, M...Copenhagenomics
 

Destacado (18)

Analisis dan interpretasi dat1
Analisis dan interpretasi dat1Analisis dan interpretasi dat1
Analisis dan interpretasi dat1
 
apuntes
apuntesapuntes
apuntes
 
Bán, cho thuê bộ cắt băng khánh thành giá rẻ nhất tại TP.HCM
Bán, cho thuê bộ cắt băng khánh thành giá rẻ nhất tại TP.HCMBán, cho thuê bộ cắt băng khánh thành giá rẻ nhất tại TP.HCM
Bán, cho thuê bộ cắt băng khánh thành giá rẻ nhất tại TP.HCM
 
Super copa gaúcha artilharia
Super copa gaúcha   artilhariaSuper copa gaúcha   artilharia
Super copa gaúcha artilharia
 
Welcome students 3201 ago 15
Welcome students 3201 ago 15Welcome students 3201 ago 15
Welcome students 3201 ago 15
 
The Zen of Python
The Zen of PythonThe Zen of Python
The Zen of Python
 
15 november 1902 pdf
15 november 1902 pdf15 november 1902 pdf
15 november 1902 pdf
 
CEOs-and-CHROs
CEOs-and-CHROsCEOs-and-CHROs
CEOs-and-CHROs
 
UNL Final Presentation
UNL Final PresentationUNL Final Presentation
UNL Final Presentation
 
Ninguém explica deus violin i
Ninguém explica deus   violin iNinguém explica deus   violin i
Ninguém explica deus violin i
 
(0341)553240 Vokasi ub, Vokasi ub 2015, Vokasi ub malang, Program Vokasi Braw...
(0341)553240 Vokasi ub, Vokasi ub 2015, Vokasi ub malang, Program Vokasi Braw...(0341)553240 Vokasi ub, Vokasi ub 2015, Vokasi ub malang, Program Vokasi Braw...
(0341)553240 Vokasi ub, Vokasi ub 2015, Vokasi ub malang, Program Vokasi Braw...
 
Examen neurologico
Examen neurologicoExamen neurologico
Examen neurologico
 
Presentation1
Presentation1Presentation1
Presentation1
 
Working with vulnerable people
Working with vulnerable peopleWorking with vulnerable people
Working with vulnerable people
 
Anthony's CV 030616
Anthony's CV 030616Anthony's CV 030616
Anthony's CV 030616
 
Trastornos gastricos
Trastornos gastricosTrastornos gastricos
Trastornos gastricos
 
Origins of Public Relations
Origins of Public RelationsOrigins of Public Relations
Origins of Public Relations
 
Recent Advances in NGS Technologies, LaserGen & Baylor College of Medicine, M...
Recent Advances in NGS Technologies, LaserGen & Baylor College of Medicine, M...Recent Advances in NGS Technologies, LaserGen & Baylor College of Medicine, M...
Recent Advances in NGS Technologies, LaserGen & Baylor College of Medicine, M...
 

Similar a THESIS

Discussion 5Critically think about ethnocentrism, culture, and
Discussion 5Critically think about ethnocentrism, culture, andDiscussion 5Critically think about ethnocentrism, culture, and
Discussion 5Critically think about ethnocentrism, culture, andLyndonPelletier761
 
Edtech 505 Evaluation final
Edtech 505 Evaluation finalEdtech 505 Evaluation final
Edtech 505 Evaluation finalKMacca
 
FINAL PROJECT- THIRD DRAFT
FINAL PROJECT- THIRD DRAFTFINAL PROJECT- THIRD DRAFT
FINAL PROJECT- THIRD DRAFTRobert Patterson
 
PROPOSAL Students need a better Education to be ready for Co.docx
 PROPOSAL  Students need a better Education to be ready for Co.docx PROPOSAL  Students need a better Education to be ready for Co.docx
PROPOSAL Students need a better Education to be ready for Co.docxaryan532920
 
Gpa Test Scores
Gpa Test ScoresGpa Test Scores
Gpa Test ScoresDani Cox
 
The Role of Service Learning in the Retention of
The Role of Service Learning in the Retention ofThe Role of Service Learning in the Retention of
The Role of Service Learning in the Retention ofJoan Johns Maloney
 
Eunetra Ellison Simpson, PhD Proposal Defense, Dr. William Allan Kritsonis, D...
Eunetra Ellison Simpson, PhD Proposal Defense, Dr. William Allan Kritsonis, D...Eunetra Ellison Simpson, PhD Proposal Defense, Dr. William Allan Kritsonis, D...
Eunetra Ellison Simpson, PhD Proposal Defense, Dr. William Allan Kritsonis, D...William Kritsonis
 
Advocating School Intervention Program among Junior High Students
Advocating School Intervention Program among Junior High StudentsAdvocating School Intervention Program among Junior High Students
Advocating School Intervention Program among Junior High Studentsijtsrd
 
Fixing America’s Standardized Testing
Fixing America’s Standardized TestingFixing America’s Standardized Testing
Fixing America’s Standardized TestingAlex Cortez
 
Huff, patrick the fight against common core schooling v 5 n1 2014
Huff, patrick the fight against common core schooling v 5 n1 2014Huff, patrick the fight against common core schooling v 5 n1 2014
Huff, patrick the fight against common core schooling v 5 n1 2014William Kritsonis
 
Educational NegligenceTaya Hervey-McNuttStrayer Univer
Educational NegligenceTaya Hervey-McNuttStrayer UniverEducational NegligenceTaya Hervey-McNuttStrayer Univer
Educational NegligenceTaya Hervey-McNuttStrayer UniverEvonCanales257
 
FACTORS AFFECTING PERFORMANCE IN SCIENCE OF FOURTH YEAR STUDENTS IN THE NATIO...
FACTORS AFFECTING PERFORMANCE IN SCIENCE OF FOURTH YEAR STUDENTS IN THE NATIO...FACTORS AFFECTING PERFORMANCE IN SCIENCE OF FOURTH YEAR STUDENTS IN THE NATIO...
FACTORS AFFECTING PERFORMANCE IN SCIENCE OF FOURTH YEAR STUDENTS IN THE NATIO...ASU-CHARRM
 
Unfinished: Insights From Ongoing Work to Accelerate Outcomes for Students Wi...
Unfinished: Insights From Ongoing Work to Accelerate Outcomes for Students Wi...Unfinished: Insights From Ongoing Work to Accelerate Outcomes for Students Wi...
Unfinished: Insights From Ongoing Work to Accelerate Outcomes for Students Wi...Jeremy Knight
 

Similar a THESIS (14)

Empirical Reasearch Project
Empirical Reasearch ProjectEmpirical Reasearch Project
Empirical Reasearch Project
 
Discussion 5Critically think about ethnocentrism, culture, and
Discussion 5Critically think about ethnocentrism, culture, andDiscussion 5Critically think about ethnocentrism, culture, and
Discussion 5Critically think about ethnocentrism, culture, and
 
Edtech 505 Evaluation final
Edtech 505 Evaluation finalEdtech 505 Evaluation final
Edtech 505 Evaluation final
 
FINAL PROJECT- THIRD DRAFT
FINAL PROJECT- THIRD DRAFTFINAL PROJECT- THIRD DRAFT
FINAL PROJECT- THIRD DRAFT
 
PROPOSAL Students need a better Education to be ready for Co.docx
 PROPOSAL  Students need a better Education to be ready for Co.docx PROPOSAL  Students need a better Education to be ready for Co.docx
PROPOSAL Students need a better Education to be ready for Co.docx
 
Gpa Test Scores
Gpa Test ScoresGpa Test Scores
Gpa Test Scores
 
The Role of Service Learning in the Retention of
The Role of Service Learning in the Retention ofThe Role of Service Learning in the Retention of
The Role of Service Learning in the Retention of
 
Eunetra Ellison Simpson, PhD Proposal Defense, Dr. William Allan Kritsonis, D...
Eunetra Ellison Simpson, PhD Proposal Defense, Dr. William Allan Kritsonis, D...Eunetra Ellison Simpson, PhD Proposal Defense, Dr. William Allan Kritsonis, D...
Eunetra Ellison Simpson, PhD Proposal Defense, Dr. William Allan Kritsonis, D...
 
Advocating School Intervention Program among Junior High Students
Advocating School Intervention Program among Junior High StudentsAdvocating School Intervention Program among Junior High Students
Advocating School Intervention Program among Junior High Students
 
Fixing America’s Standardized Testing
Fixing America’s Standardized TestingFixing America’s Standardized Testing
Fixing America’s Standardized Testing
 
Huff, patrick the fight against common core schooling v 5 n1 2014
Huff, patrick the fight against common core schooling v 5 n1 2014Huff, patrick the fight against common core schooling v 5 n1 2014
Huff, patrick the fight against common core schooling v 5 n1 2014
 
Educational NegligenceTaya Hervey-McNuttStrayer Univer
Educational NegligenceTaya Hervey-McNuttStrayer UniverEducational NegligenceTaya Hervey-McNuttStrayer Univer
Educational NegligenceTaya Hervey-McNuttStrayer Univer
 
FACTORS AFFECTING PERFORMANCE IN SCIENCE OF FOURTH YEAR STUDENTS IN THE NATIO...
FACTORS AFFECTING PERFORMANCE IN SCIENCE OF FOURTH YEAR STUDENTS IN THE NATIO...FACTORS AFFECTING PERFORMANCE IN SCIENCE OF FOURTH YEAR STUDENTS IN THE NATIO...
FACTORS AFFECTING PERFORMANCE IN SCIENCE OF FOURTH YEAR STUDENTS IN THE NATIO...
 
Unfinished: Insights From Ongoing Work to Accelerate Outcomes for Students Wi...
Unfinished: Insights From Ongoing Work to Accelerate Outcomes for Students Wi...Unfinished: Insights From Ongoing Work to Accelerate Outcomes for Students Wi...
Unfinished: Insights From Ongoing Work to Accelerate Outcomes for Students Wi...
 

THESIS

  • 1. Universidad Alberto Hurtado and Georgetown University Faculty of Economics and Business Thesis to opt to the Master of Applied Economics degree given by Georgetown University and the Magíster en Economía Aplicada a Políticas Públicas given by Universidad Alberto Hurtado The Effect of Grade Retention on Students’ Outcomes: Evidence from Chile Juan Carvajal supervised by Dr. Marcela Perticara University of Texas A&M Santiago, Chile 2016
  • 2. Universidad Alberto Hurtado and Georgetown University Faculty of Economics and Business The Effect of Grade Retention on Students’ Outcomes: Evidence from Chile Juan Carvajal supervised by Dr. Marcela Perticara University of Texas A&M Director of Master Dr. Lucas Navarro Georgetown University Santiago, Chile 2016
  • 3. Contents 1 Introduction 2 2 Chilean educational system, data and variables 5 2.1 Background . . . . . . . . . . . . . . . . . . . . . . . . . . . . 5 2.2 Data . . . . . . . . . . . . . . . . . . . . . . . . . . . . . . . . 7 2.3 Variables . . . . . . . . . . . . . . . . . . . . . . . . . . . . . 8 3 Estimation strategy using an IV framework 12 3.1 GPA . . . . . . . . . . . . . . . . . . . . . . . . . . . . . . . . 12 3.2 Probability of Attending Secondary School . . . . . . . . . . . 14 3.3 Probability of Dropping Out . . . . . . . . . . . . . . . . . . . 14 4 Results 15 4.1 Model 1 . . . . . . . . . . . . . . . . . . . . . . . . . . . . . . 15 4.1.1 Academic Achievement . . . . . . . . . . . . . . . . . . 15 4.2 Model 2 . . . . . . . . . . . . . . . . . . . . . . . . . . . . . . 18 4.2.1 Attending Secondary School . . . . . . . . . . . . . . . 18 4.3 Model 3 . . . . . . . . . . . . . . . . . . . . . . . . . . . . . . 18 4.3.1 School Abandonment . . . . . . . . . . . . . . . . . . . 18 5 Conclusions 20 6 Appendix 22 6.1 Cohort 2003 . . . . . . . . . . . . . . . . . . . . . . . . . . . . 22 6.1.1 Tables for ever repeating between third and fourth grade 22 6.1.2 Tables for ever repeating between first and fourth grade 25 6.1.3 Tables for ever repeating between first and eighth grade 27 7 Literature 28 1
  • 4. Abstract This article estimates the effect of early grade retention on students’ out- comes in Chile by using administrative data from the ministry of education (MINEDUC) on academic achievement. Using the 2003 cohort of students starting first grade of primary school and an instrumental variables approach to control for grade retention’s endogeneity based on unobserved qualities of the student, I find that early grade retention has a negative effect on 6th and 8th grade’s academic performance (GPA). I also find a negative effect on the probability of attending secondary school with a 25 percentage point reduction if the student repeated any time between 1st and 2th grade. Finally, I find that early grade retention has a positive effect in the probability of dropping out of secondary school with a 33.4 percentage point increase in the probabil- ity. This article concludes with possible policies to counterattack the negative results on students outcomes given the actual retention policy in the Chilean educational system. 1 Introduction Most Latin American countries have been relying on grade retention as an effective way to re-prepare low achieving students who could not succeed with the standard academic requirements needed to be promoted to the next academic year along with his peers. Grade retention is understood as an educational practice of having a child repeat a grade in school. However, in recent years, most developed countries have switched from a grade retention system to an automatic promotion system requiring that all student should be promoted to the following year. Chile, in this case, falls in the Latin American category of countries with very high index of grade retention. In recent years, economists have spent a great amount of resources in research on the importance of education and the economical results it has in the labor market. Aware of this importance, economists have focused on academic achievement and different remedial programs that either encour- ages or deviate students from achieving their required scores to be promoted to the following year along with his peers. Grade retention as a remedial program, therefore, has been a very wide subject that economists have tried to decode and explain, given its economical implications. There has been a wide debate on whether children should, in fact, re- peat grades given the negative social, emotional and cognitive impacts that 2
  • 5. this includes. Most literature, Jacob and Lefgren (2009), Manacorda (2012), Elodie Allet (2010), Eide and Showalter (2001) and more, allude to the fact that grade retention does have some emotional impact on children that could affect them academically. In the mentioned literature, there is a mix of views about the effects of grade retention. The first is that there is a positive effect on children since it provides them with more maturity relative to their peers and it strengthens the basic and necessary knowledge for posterior years, Fertig (2004), Jacob and Lefgren (2004). The second; however, reflects grade retention as to being correlated with later poor academic performance and eventually abandonment of continued studies. The majority of grade reten- tion studies find that the practice of requiring students to repeat a grade decreases self-esteem, school adjustment, and academic achievement, and in- creases dropout rates, Eide and Showalter (2001). The main purpose of this work is to try to explain what are the effects of early grade retention on children’s academic performance, access to sec- ondary school in Chile, and probability of dropping out of secondary school. I want to see if repeating a grade is in fact beneficial for the child given the characteristics of Chile or rather damaging for future cognitive development. One of the main problems involving this analysis, however, is that there might be a problem of self-selection, kids who repeat a grade tend to be very different from children who never do allowing for selection bias. The problem with this is that we cannot compare one group to the other, which limits the type of methodology needed to perform this study. Failing to account for the selection of students into repeating a grade can potentially exaggerate the harm of retention. Having this in mind, I focused on finding a possible de- terministic rule to compare students who are close to the cut off line such as Manacorda (2012) as he uses the fact that in Uruguay if a student fails more than 3 classes, then he is obliged to repeat the grade. Another work is that of Jacob and Lefgren (2009) who use the Chicago Accountability Policy where a student from 3rd and 6th grade is required to perform at predefined levels of both reading and mathematics in order to be promoted to the next grade1 . Following this idea we found that in Chile, the ministry of education en- forced a rule in Article 10 of the supreme decree of education No 40, where if the student fails to attend more than 85% of the classes throughout the academic year in addition to achieving a GPA lower than 4 (out a 1-7 chart being 7 the highest score) then the student would be forced to repeat the grade. While students moving from 1st to 2nd and from 3rd to 4th grade 1 Jacob and Lefgren (2009) 3
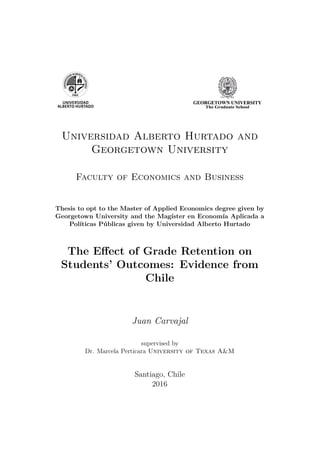
  • 6. would only require to fill the assistance requirement given that they have a two year period to achieve the required GPA. One of the problems with this notion is that “assistance to class” can be easily altered by teachers and allows manipulation in the event that the student might be slightly under that threshold in order to promote them. Figure (1) shows that is in fact the case since there is a big jump right in the 85% assistance rate. This can only mean that teachers in Chile tend to alter their assistance reports in order to allow students who are right in that threshold to achieve the necessary re- quirements to pass. Moreover, being this the only explicit deterministic rule of enforcement that we could find, the empirical analysis with a regression discontinuity cannot be used as an empirical method to estimate the effect of early retention in this article. Due to a lack of a deterministic rule combined with poor background in- formation from the database we relied on the instrumental variable approach to try and correct the endogeneity from our grade retention variable since it involves unobserved characteristics of the student such as prior cognitive de- velopment, early academic motivation, maturity, parental involvement, etc. In order to do this, I had to find a variable that was correlated with my endogenous variable but which did not explain the output in place. In other words, I want a variable capable of explaining grade repetition without any explanatory power over GPA in 6th and 8th grade, probability of attend- ing secondary school and the probability of dropping out while in secondary school. Using standard literature about the subject I will follow Fertig (2004), Elodie Allet (2010) and Eide and Showalter (2001) and exploit the “relative maturity” of the student with the number of days from his birthday at the time of entry in first grade and the quarter of birth as instrumental variables. According to Eide and showalter (2001) one of the biggest worries when us- ing this approach is that the instrument would in fact be correlated with the dependent variable, in this case GPA. Their argument is that children who started younger relative to their peers have a higher probability of repeat- ing a grade than those who started older given that they are more mature and faster learners. However, there is reasonably good evidence that age differences in scholastic performance at school entry are temporary2 . Shep- ard and Smith (1986,1987) find that first grade classes typically have 8 or 9 percentile point differences in reading achievement tests between the old- est and youngest students, but that the age effect disappears by the third 2 Eide and Showalter (2001) 4
  • 7. grade. Finally, Reynolds (1992) finds that age at school entry does not have any significant effect on grade 4 outcomes, independent of grade retention3 . Therefore, we can utilize this argument to prove that maturity at the time of entry does not have a significant effect on students’ outcomes nor do they have a significant long-term effect on GPA. Therefore, we can conclude that the instruments used here are in fact exogenous and do not affect the aca- demic achievements and outcomes in secondary school. The results found in this study, while applying the instrumental vari- able approach, show that repeating at an early age lowers sixth grade GPA by 0.72 points on average. Eight grade GPA shows similar results with a decrease of 0.6 points on average. The study also found that early grade repetition decreases the probability of ever attending secondary school by 25 percentage points at the one percent level of confidence. Finally, the study showed that there was a 33.4 percentage point increase in the probability of dropping out of secondary school when repeating at an early age. This follows the results of Eide and Showalter (2001) as they find repetition to have a negative impact on students scores and academic achievement. The remainder of this article is going to be sectioned in 4 parts. Section 2 will give a brief description of the Chilean background and educational system, the database, and the empirical method used while giving some de- scriptive statistics. Section 3 will describe the estimation strategy with 3 models used to explain the outcomes. Section 4 will show the table results of the models and explain the direction and magnitude of the coefficients. Finally, Section 5 will end with a conclusion and some critics to the negative results found in section 4. 2 Chilean educational system, data and vari- ables 2.1 Background Chile’s educational system is made up by 2 cycles, primary school (enseñanza básica) and secondary school (enseñanza media). Primary goes from 1st grade to 8th grade with a minimum age of entry in first grade of 6 years old, and secondary school from 9th to 12th. According to law 19.876 pri- 3 Ibid 5
  • 8. mary and secondary education in Chile is mandatory for all children until the age of 21, which means that every child in the country has the option of free education without exclusion in certain establishments. The educational establishments in Chile are distributed into three different types: Public or municipal schools which represent 41% of total enrollment, non-fee-charging private schools with 51% of enrollment and fee-charging schools with 7% of enrollment, Caceres and Giolito (2014). With this in mind, most of the fee- charging schools in Chile are located in the capital which at them time of analyzing our data distorts the sample since it is not representative to the country itself. In 2008 the government passed the Subvención escolar preferencial (SEP) or targeted-voucher school law, which establishes that all children considered vulnerable in the economical sense can apply to any non-fee-charging schools (private-voucher school) they desire, without any admission test and com- pletely free. This law was meant to reduce the inequality gap built by the school system itself and allow a more heterogeneous distribution of students among schools. One of the feature of this law, is that it provides funds to all schools that absorb these incoming students which at the same time are allowed to repeat a grade at least one time per grade without consequence. However, for this article we wont touch this law since we will be using a cohort of 2003. Another important distinction that the Chilean educational system has is that it allows children to choose between two different type of tracks for secondary education. There is a Scientific-Humanistic track which encour- ages and prepares the student for future college education, providing him with different classes and tools to excel. On the other hand, there is the Technical-Professional track that prepares the student for immediate techni- cal work after secondary school. This later track, however, has a duration of five years instead of the standard four such as the former one. The basic motivation of this article comes from the relative change that repetition has had over the past few years. This change, following a recent study by the ministry of education (2015) and UNESCO4 , shows that in 2012 the repetition rate for primary school (taking into account only the first six grades) was 4.7%, in 2013, however, it changed to 3.7%. This one percentage point change represents a question mark in our study since it might hint a difference in opinion about the effectiveness of the promotion policy in 4 National revision 2015 for ”educaci’on para todos” 6
  • 9. place. An efficient system is the one where repetition rates are closer to zero, find the reason why these rates are so high in Chile, represents the type of questions that this article will try to address. 2.2 Data I use the detailed administrative data of academic achievement from the min- istry of education, which provides data from 2002 to 2014 on specific birth dates, code of the establishment, code of the county and region, an identifi- cation number specific to each student that allows me to follow them even in the case of transferring to another establishment throughout the period, gender, and general GPA after the end of the academic year. I exploit the fact that the data base provides a 12 year period to construct a panel data that allows me to follow a student from the first day he joined the educa- tional system all the way until he finished. Therefore, the data allows me to observe a specific cohort for an entire period of time. Constructing the panel, I obtained my 2003 cohort5 with students all over Chile; however, to avoid too much heterogeneity between establishments I focused on non- fee-charging private and municipal establishments since they constitute the majority of the student body that have similar characteristics, leaving the private fee-charging establishments out of the study. The data also provides with important information of the final situation of the student at the end of the academic year. This allows for the creation of most of the variables of interest, such as whether the student dropped out of secondary school or how his GPA looked like. I am also able to construct the repetition variables by observing the amount of times the ID number is seen on a determined grade and establishment. I therefore use a predetermined cohort (2003) and use it as a cross-section study having only one observation per individual, but allowing for dummies such as repeated any time between first and second grade, third and fourth grade and finally first and eight grade. Making the analysis in this way more manageable. 5 I also applied this same study using a 2002 cohort given the fact that students ob- served in 2002 in first grade could also be repeaters from the previous year, and since the information for it did not come with the data, we used the following year to see what the fraction of repeaters looked like and concluded that the difference was significant; therefore causing distortions 7
  • 10. 2.3 Variables For my outcome variables I study the direct effect of repetition of 6th and 8th grade GPA. I focus specially on early grade repetition and the effect this one has on later outcomes in primary and secondary school. With it I intend to see the impact that repeating at an early age has on the psychological and academical outcomes of the student. In the case of the probability of assisting secondary school, I generated a dummy equal to 1 if the student’s identifi- cation number appeared at least once in the records of secondary school, I did this in order to see the probability the repeater has to ever graduate from primary school and enroll in the subsequent level. Finally, I created my dropout variable focusing only in secondary school due to administrative errors in the data, where students would suddenly disappear in early grades causing error and noise in the estimations. This last variable was created by looking at the last year the student appeared in the database and creating a dummy equal to 1 if the last year observed was less to 2014. When creating my repetition variables I wanted to explain the effect of early repetition on the outcomes the student might have in the future. There- fore, I focused on four different possibilities of repetition. The first is having repeated a grade at least once while coursing 1st and 2nd of primary school. the second explains having ever repeated 3rd or 4th grade, the third explains repetition between 1st to 4th grade and finally, the fourth repetition variable show having ever repeated grade in primary school (1st to 8th grade). These variables will try to explain the real effect that early repetition has on long- run effects in student achievement. To have ever repeated primary school can affect directly the output of the student the subsequent year, moreover, I expect to see a bigger effect on dropout and the probability of attending secondary school in the upcoming results. The instruments I utilize in this article come from the literature of Fertig (2004), Elodie Allet (2010) and Eide and Showalter (2001). This literature uses the physical maturity of the student at the time he first joins the educa- tional system in first grade of primary school relative to his peers. The main idea is that the younger the child is relative to his classmates the more will the probability be of repeating first and second grade. Elodie Allet (2010) uses the number of days from the birthday to the cut off date and determines a difference in days from the youngest to the oldest to account for how younger is one student relative to anotherr. Elodie Allet (2010) experiments with two variables of the number of days and estimates their respective coefficients. The first is using the variable as continuous and the second as dummy vari- 8
  • 11. ables. One conclusion she provides is that the difference in implied effect of retention between the dummy variable estimates and the ndays estimate is that ndays gives equal weight to days far beyond the cut-offs which some- times is not supported by the data. Therefore, the correct way and the one used in this article is to use dummies to correct for the weight distribution within days from the cut off date. The literature also uses the quarter of birth as a controlling variable of the cut off date when the children must join school, which happens to be in March 31st, McEwan and Saphiro (2006), with a flexible period for late entering students of three months or until July 1st. The quarter of birth will also control for those students that just missed the cut off date and will eventually have to wait another year to be submitted into first grade. Finally, given that the data used in this work is limited to characteris- tics of the establishment and some characteristics of the student, there is no family background or social status that will allow me to control for certain differences between the students within an establishment. However, I utilize gender of the student to control for possible heterogeneity between boys and girls, which is standard in this literature. I will eventually find that there is a negative correlation between being a boy and having a higher GPA, having a higher probability of attending secondary school, and a lower dropout rates. The following models will describe the real purpose of this article and what is it that this study is trying achieve by explaining he effect of early grade retention of long-term student’s outcomes. Some Descriptive statistics are shown below to specify the variables uses in this study. Table 1 shows a summary statistics of the variables that will be utilized in the models. As shown, the general point average (GPA) for students at the end of sixth grade grade is 5.6 out of a scale of 1 through 7 in the Chilean score system. This is an elevated score for a sample of over 139 thousand observations, meaning that in general students do very well in their scores by the end of their academic year. GPA for eighth grade is very similar to sixth, which only shows that students, on average, tend to be persistent in their scores throughout primary school. As for the probability of attending secondary school, we observe that about 93 percent of the student body in our sample get to graduate primary school, which in fact is mandatory. Nonetheless, there is still a big part of the sample, about 6.7 percent, that do not get to finish primary and either disappear from the sample. Dropout is about a tenth of the sample in secondary school only. The variables for 9
  • 12. Table 1: Summary statistics Variable Mean Std. Dev. Min. Max. N Establishment (RBD) 8778.523 7000.187 5 25810 139613 ID number 10875154.995 6696498.007 150 25024246 139613 RBD in 6th grade 9394.735 7418.757 5 40403 135626 RBD in 8th grade 9556.023 7609.111 5 40436 132458 RBD in Primary 9321.127 7337.136 5 40298 139613 GPA in 6th grade 5.608 0.616 1 62 135626 GPA in 8th grade 5.579 0.583 1 48 132458 Prob.attending S. School 0.933 0.25 0 1 139613 Repeated between 1-2 0.028 0.164 0 1 139613 Repeated between 3-4 0.054 0.227 0 1 139613 Repeated between 1-4 0.077 0.266 0 1 139613 Repeated between 1-8 0.18 0.384 0 1 139613 Dropout 0.105 0.307 0 1 139613 ndays 128.519 125.963 -382 678 139602 ndaysme271 0 0.011 0 1 139613 ndaysme181_270 0.001 0.039 0 1 139613 ndaysme91_180 0.004 0.059 0 1 139613 ndaysme61_90 0.043 0.204 0 1 139613 ndaysme31_60 0.055 0.229 0 1 139613 ndaysme30_30 0.141 0.348 0 1 139613 ndaysma31_60 0.077 0.266 0 1 139613 ndaysma61_90 0.081 0.273 0 1 139613 ndaysma91_180 0.249 0.433 0 1 139613 ndaysma181_270 0.244 0.429 0 1 139613 ndaysma271_360 0.074 0.262 0 1 139613 ndaysma361 0.03 0.17 0 1 139613 Student’s gender 0.509 0.5 0 1 139613 Quarter of Birth 2.546 1.123 1 4 139613 10
  • 13. the number of days a student has from his birthday to the last cut off date he can be admitted that year ranges from a year early to about two years. In other words, ages go from five to seven years of age in the sample. Another important statistic to notice is that about 50% of the students in the sample are within the range of 91 and 270 days of age from the cut off date which implies that about half of the students will belong to the second quarter of the year and will most likely have to wait another year to be admitted to first grade. Table 2 shows in more detail the outcome variables used in this article. Table 2: Tabulations Item Number Per cent Dropped out in S. School Attending 124,888 89 Dropout 14,725 11 Total 139,613 100 Repeated between 1-4 Didn’t repeat 128,919 92 Repeated grade 10,694 8 Total 139,613 100 Repeated between 1-2 Didn’t repeat 135,732 97 Repeated grade 3,881 3 Total 139,613 100 Repeated between 3-4 Didn’t repeat 132,010 95 Repeated grade 7,603 5 Total 139,613 100 Repeated in Primary School Didn’t repeat 114,459 82 Repeated grade 25,154 18 Total 139,613 100 Attended S. School Attending S. School 130,224 93 Not attending S. School 9,389 7 Total 139,613 100 11
  • 14. Table 2 shows some detailed descriptions for the major variables used, taking into account both exogenous and endogenous variables. It is impor- tant to notice that our dropout rate in secondary school is 11%, meaning that about a tenth of the children disappear from the data before finishing in 2014. Dropout rate in primary school shows up to be smaller that the secondary school dropout rate, which might be counter intuitive since most of the children tend to quit school at an early age. However, these results account for administrative errors for which the students in first grade tend to disappear. Moreover, we will be using only the dropout rate for secondary school in this study. Another interesting statistic is that of ever repeating a grade between first and second, third and fourth, and first and fourth. The fraction of students who did not attend secondary school is very low for the size of the data of only 7%; however, it has a high positive correlation with those students who repeated grade at an early age. 3 Estimation strategy using an IV framework I begin by presenting three simple models of grade retention as a key to ana- lyze some of the most important effects that early repetition has on student’s outcomes 6 . 3.1 GPA The first outcome I present is divided into two separate models to show the impacts of early retention into immediate and long-term outcomes. The first explains the effect of early repetition as function of immediate academic out- comes, in this case, 6th grade GPA. The second, focuses on the impact in 8th grade GPA. This important distinction is made in order to see whether repeating as an early child has long lasting effects on GPA or if this effect actually dissipates over time. 6th Grade Model: GPA_6ir = β0 + β1Repite_1_2ir + γXir + δr + uir (1) 6 This study was made to see the true effect of grade repetition at an early age, which we account as ever repeating between first and second grade. The results and models are also presented in the appendix for grade repetition in third to fourth grade, first to fourth grade, and first to eight grade. We focus on repetition between first and second grade given the fact that our instruments are only relevant during the first years of primary school education. 12
  • 15. From equation (1) we have that the subscript i represents the individual student and r represents the establishment where he is located at that mo- ment 7 . The vector Xir is the vector of the control variables described in the previous section, in this case, we only focus on the gender of the individual. This model will try to explain the causal effect that repeating a grade in the early years of primary school has on the academic achievement of the child at the end of the school year. To do this, I use the instrumental variable approach using the quarter of birth and the relative age in days from the cut off date as variables describing the physical maturity of the child. Moreover, I will run a first stage where I will test the relevance of the instruments in the model. Equation (2) shows the structure of the first stage where Zir represents the vector of my instrumental variables. Repite_1_2ir = γ0 + γXir + θZirδr + eir (2) 8th Grade Model: The second model provides information about the achievement of the child in the subsequent years after repeating grade at an early age for the first time. It tries to explain whether the effects of repetition in a student’s performance (if it helps him or if it hurts him) have a long lasting effect in primary school. This is important to address, given the implications that poor academic scores mean in the development of the student. Jacob and Lefgren (2004), use a regression discontinuity approach to study this par- ticular effect, the results they obtained showed a positive effect of taking summer school and repeating a grade on third grade achievement in math as well as reading. However, the impact that it had on later years became less significant and they concluded that it started to fade by roughly 25 to 40% all the way to sixth grade8 . GPA_8ir = β0 + β1Repite_1_2ir + γXir + δr + uir (3) By looking at GPA, this article will attempt to explain the effect that re- peating grade has on achievement and academic progression. If by repeating a grade a student will move higher in achievement, then that will give prove that the current Chilean system works. However, if the contrary happens, we will see that repeating a grade will cause a student to go even lower in 7 The establishment will change according to the outcome variable, and with it the number of observations. 8 They also explain that this effect is consistent with the fadeout of program effects found in other evaluations (Bernett 1995) 13
  • 16. his academic achievement affecting him psychologically in the long term for multiple reasons. 3.2 Probability of Attending Secondary School For the second model I want to estimate the probability of attending sec- ondary school when the child has repeated at an early age. The purpose is to see the real impact that repetition has on children. The negative psycho- logical effects this generates, and the possible solutions we could address to avoid this damage. The model starts with the definition of attending secondary school, by this we mean having ever completed primary school and entering first grade of secondary school between the period of 2002 and 2014. Whether the stu- dent left for a long period of time or not, if the observation we have of the student appears once in our data base in secondary school, then we consider that individual as part of the sample in study. emediair = βo + β1Repite_1_2ir + γXir + δr + uir (4) What equation (5) will try to explain is the true effect of early grade repetition on the probability that a student ever attends secondary school. In Chile, secondary school is, by law, mandatory9 . However, it can be seen throughout the country that a vast majority of rural schools still experience large quantities of their students who finish primary school without contin- uing to secondary school as the following step for their education. 3.3 Probability of Dropping Out Our last model shows the effect of early grade retention in the probability of dropping out of secondary school. This model tries to imitate the literature of Eide and Showalter (2001). They found that retaining a child results in an 8.8% increase in the probability of dropping out of high school10 using OLS. However, they find this result to be not economically significant given that OLS would not capture the causal effect of repetition since this variable is endogenous on unobserved characteristics. When controlling for IV, they 9 Mandatory only means that the government provides all the possibilities and resources towards municipal schools and non-fee-charging schools for all students to attend it. 10 Eide and Showalter (2001) 14
  • 17. find expected signs implying a positive effect of retention on dropout. Dropoutir = β0 + β1Repite_1_2ir + γXir + δr + uir (5) As Eide and Showalter (2001) show, I also find, after controlling for the endo- geneity of early grade retention, that there is a positive correlation between repeating a grade in primary school and dropping out of secondary school. I use the instrumental variable approach to find the causal effect of this relation; however, there might still be some bias regarding the students char- acteristics making the coefficients to be exaggerated upwards. Given that I use administrative data that has no records on family background, I am not able to control for parents education (which previous literature focus on); however, I expect that controlling for establishment captures most of this effect. Chilean education is very segregated and usually the establishment can capture the social status of the family11 . 4 Results 4.1 Model 1 4.1.1 Academic Achievement Table 3 shows the ordinary least squares, fixed effect and instrumental variable estimations of early repetition on students GPA. When interpreting this table casually, we can see that OLS and FE give similar estimators for the effect of retention on GPA. In sixth grade GPA we can see that by repeat- ing at an early age the average score will fall by 0.5 points on average with OLS, and about 0.47 points with FE. This decrease on GPA allows us to have an idea of the direction repetition has on academic achievement. However, we cannot rely on these results to make the ultimate conclusions given that they contain the selection bias explained before. What is interesting as well is the effect that gender has on average scores. This implies that being a male reduces also the academic achievement of the child. Eight grade scores show 11 This will change later on with a targeting voucher policy (SEP) that was put in place in 2008. This policy allows vulnerable students with no resources to apply to any municipal, private-voucher school in the country without paying, as long as they qualify for it. There might also be an effect in retention given that vulnerable students are allowed to repeat grade at least once for a specific grade without affecting their eligibility. Nonetheless, it does not apply to our study since the 2003 cohort I use does not experience this policy for the time studied. 15
  • 19. a similar result, nevertheless, the impact is not as negative as the immediate effect in sixth grade. We see on the results that early repetition reduces GPA in around 0.4 points for both OLS and FE. Table 3 also shows the results for our instrumental variable approach. As we can see, the direction of the coefficient follows that the standard litera- ture and shows that early grade repetition has a negative effect on 6th grade and 8th grade GPA. We can see that repeating in first or second grade, af- ter controlling for the maturity of the child, lowers sixth grade GPA in 0.72 points on average being statistically significant at the 1 percent level. 8th grade GPA shows a similar result of about 0.6 points. These results attempt to show the causal effect of grade repetition on academic achievement on 6th and 8th grade. To see, however, the effect that the results are in fact unbiased we will see the first stage results in table 4 to test whether our instruments are exogenous and statistically significant. Table 4 shows the first stage for 6th and 8th grades respectively. One of the most interesting results that we found in our first stage is that of the number of days the student has with respect to the cut off date in first grade. As we can see, there is a negative correlation between repeating a grade as an early child and the number of days. This only supports the theory behind the previous literature, implying that the younger the student is the more the probability of repeating. We can also see that for the quarter of birth. Our second quarter accounts for a negative correlation with grade repetition, while the first and third show a positive correlation. This also makes sense due to the cut off date where children are allowed to be submitted into their first year. According to the Chilean educational system, children born after March 31st have to wait until the next year to be admitted into first grade, therefore, those born in the second quarter will always be older that those born in the first, giving a negative correlation between being older and re- peating a grade (supporting in this way the theory planted in this article). The coefficients of our instruments follow the signs expected in the study and they are also statistically significant at the one percent level. We can therefore argue that the instruments used in this article will in fact control for the endogenous features of repetition. Therefore, this first model shows that academic achievement in the form of average general points throughout the year has a negative relation with grade repetition. This can only pinpoint the fact that, if GPA is really the best measure of student academic achievement, then grade repetition is af- fecting negatively their performance instead of repairing the problem. Most 17
  • 20. schools and universities focus on this measure of achievement as a reliable source to select their students and allow them to continue studying. How- ever, if repeating hurts the student in the long run, as it is shown in the regression, then it might not be the most effective policy. 4.2 Model 2 4.2.1 Attending Secondary School Table (5) shows the effect that early grade retention has on the probability of the child to ever attend secondary school and graduate from primary school. As we can see, OLS estimation overestimates the result given the selection bias. When using fixed effects to control for the heterogeneity of the establishment and control for some of the parental background, we can see that the coefficient becomes less negative to a 16 percentage point decrease in the probability of attending secondary school. Moreover, we expect the coefficient of out instrumental variable approach to be smaller than when using OLS estimation, for which this is the case. IV estimation shows a 25 percentage point decrease in the probability of ever attending secondary school being statistically significant at the one percent level. This result is economically significant since it represents a big decrease in the probability. Allowing children to repeat grade at an early age therefore, results in a very negative outcome in the long run. If this is the causal effect that repetition has on attending secondary school, it then requires a closer focus by the Chilean educational authority. 4.3 Model 3 4.3.1 School Abandonment Table 6 shows the final set of regression results which focus on the effect that early grade retention has on the probability of a student to dropout of secondary school. Its important to notice that there is a positive correla- tion between repetition and secondary school dropout. Column 1 shows the coefficients of ordinary least squares estimation with a 5.7 percentage point increase in the probability of dropping out of secondary school. This result is important since it provides us with information about the size and direction 18
  • 21. Table 4: First Stage - Repeating betw een 1-2 (6th grade GPA) Variable Coefficient (Std. Err.) Student’s gender .0013703 (.0007226) ndays < -271 -.3854225 (.0333188) -270 < ndays < -181 -.3525221 (.0094594) -180 < ndays < -91 -.3626432 (.0064068) -90 < ndays < -61 -.3751106 (.0032886) -60 < ndays < -31 -.3754839 (.0031936) -30 < ndays < 30 -.3752266 (.002792) 31 < ndays < 60 -.3741157 (.0029857) 61 < ndays < 90 -.3769847 (.0029314) 91 < ndays < 180 -.3818646 (.0031299) 181 < ndays < 270 -.3665173 (.0030901) 271 < ndays < 360 -.3302267 (.002979) ndays > 360 0 (omitted) First Quarter 0 (empty) Second Quarter .0022029 (.0017097) Third Quarter -.0116519 (.0029583) Fourth Quarter .0050125 (.0033092) Intercept .3888705 (.0028034) Number of Obs 135626 135626 19
  • 22. Table 5: Model 2: The effect of repeating in 1-2 grade on the probability of attending s. school S. School S. School S. School OLS FE IV Repeated between 1-2 -0.463∗∗∗ -0.163∗∗∗ -0.249∗∗∗ (0.00803) (0.00823) (0.00748) Gender -0.0270∗∗∗ -0.00578∗∗∗ -0.00616∗∗∗ (0.00127) (0.000837) (0.000794) Constant 0.959∗∗∗ 0.975∗∗∗ 0.981∗∗∗ (0.000795) (0.000928) (0.000818) Observations 139613 132458 132458 Standard errors in parentheses ∗ p < .1, ∗∗ p < .05, ∗∗∗ p < .01 of the bias. Column 2 shows the results controlling for establishment and the output becomes smaller by this with a 3.5 percentage point increase. Both these results are not too relevant considering the magnitude of the coefficient and the size of its standard error. However, when applying the instrumental variable approach we can observe that the direction of the result remains, while the magnitude changes describing a 33.4 percentage point increase in the probability of dropping out when repeating a grade at an early age being statistically significant at the one percent level and economically significant. 5 Conclusions Grade retention has remained a controversial remedial policy all around de- veloping countries. There are those who argue that it provides the neces- sary tools and additional maturity to withstand the following grades. Other suggest that retention put negative psychological restraint on children for their academical and cognitive development. In this article, we analyze the effect that early grade retention has on children in their academic achieve- ment along primary school, their probability of graduation and progression to secondary school and their probability of abandonment. We also try to demonstrate that through an instrumental variable approach we can approx- imate the causal effect and counter-strike the endogenous characteristics of repetition. 20
  • 23. Table 6: Model 3: The effect of repeating in 1-2 grade on the probability of dropping out of s. school S. School Dropout S. School Dropout S. School Dropout OLS FE IV Repeated between 1-2 0.0572∗∗∗ 0.0358∗∗∗ 0.334∗∗∗ (0.00598) (0.00647) (0.0122) Gender 0.0173∗∗∗ 0.0153∗∗∗ 0.0133∗∗∗ (0.00164) (0.00172) (0.00169) Constant 0.0951∗∗∗ 0.102∗∗∗ 0.0927∗∗∗ (0.00113) (0.00156) (0.00159) Observations 139613 139613 139613 Standard errors in parentheses ∗ p < .1, ∗∗ p < .05, ∗∗∗ p < .01 For the three models described in this study, we demonstrate that grade repetition has a negative impact on students outcomes. The first model ex- plains that having ever repeated between first and second grade reduces the general point average by 0.72 points. This reduction becomes significant since it describes a decrease in the most important achievement determinant and therefore, describes future outcomes of the child. The second model is probably the most significant one since it explains the graduation rate from primary school. With a reduction of 25 percentage points in the probability of attending secondary school there is a significant negative effect on future outcomes for the child. This reduction in the probability represents a big result given that labor market options will become narrower in the future and the probability of criminal acts will increase. Finally, The probability of dropout from secondary school provides a glimpse of the lack of deter- mination to complete school. The fact that early repetition has a positive and significant correlation with dropout with 33 percentage point increase in the probability suggests that schools that allow this remedial policy are sentencing the child to under-perform in their future classes allowing them to chose abandonment in the future. Looking at these results one can argue that in the Chilean educational system grade repetition might not be the best remedial policy to counter-attack the growing difficulty levels in primary and secondary school, at least in the early stages. Moreover, other options of re- medial policies should be suggested to avoid most of these negative outcomes. Most developed countries have switched towards a more linear approach 21
  • 24. which is the automatic progression policy, which allows the student to auto- matically pass the grade regardless of their final grade. In the case of Finland, students who score lower than the required threshold obtain special support by specific professors to allow them to strengthen the courses in which they are failing. This policy allows students to continue with their initial group of peers and corrects for some of the psychological effects concerned with grade repetition. Jacob and Lefgren (2009) explain that another possible remedial solution might be a pre-course or summer course before making the decision to repeat the grade. They showed that summer school has a positive effect in math and reading scores in the short run allowing the students to improve and enhance those skills that weren’t learned during the course of the first program. Even though these effects were only noticeable in the first few years after summer school and were not significant in following years, this could be more than necessary to correct for the immediate necessity of strengthening their weak subjects and still give the children the opportunity to continue with their initial group. Finally, there are many other methods already used in many developed countries who have already seen the negative effects of early grade repetition. Some will continue to utilize, however, grade retention as the main remedial policy continuing, in this way, with this controversial subject. In the case of Chile, what is important in not necessarily trying find what the best remedial method for children is, but to understand the real causes of this decrease in productivity and academic achievement for students whose only fault is their lack of initial maturity. 6 Appendix 6.1 Cohort 2003 6.1.1 Tables for ever repeating between third and fourth grade 22
  • 25. Figure 1: Yearly Assistance Rate Table 7: Model 1: The effect of repeating in 3-4 grade on 6th and 8th grade GPA GPA 6 GPA 6 GPA 6 GPA 8 GPA 8 GPA 8 MCO FE IV MCO FE IV Repeat 3-4 -0.539∗∗∗ -0.489∗∗∗ -3.827∗∗∗ -0.432∗∗∗ -0.396∗∗∗ -3.571∗∗∗ (0.00607) (0.00675) (0.183) (0.00661) (0.00701) (0.212) Gender -0.174∗∗∗ -0.178∗∗∗ -0.110∗∗∗ -0.150∗∗∗ -0.153∗∗∗ -0.108∗∗∗ (0.00325) (0.00375) (0.00628) (0.00314) (0.00390) (0.00564) Constant 5.723∗∗∗ 5.742∗∗∗ 5.871∗∗∗ 5.673∗∗∗ 5.681∗∗∗ 5.806∗∗∗ (0.00224) (0.00379) (0.00900) (0.00222) (0.00407) (0.00970) Observations 135626 135626 135626 132458 132458 132458 Standard errors in parentheses ∗ p < .1, ∗∗ p < .05, ∗∗∗ p < .01 23
  • 26. Table 8: Model 2: The effect of repeating in 3-4 grade on the probability of attending s. school S. School S. School S. School MCO FE IV Repeated 3-4 -0.289∗∗∗ -0.108∗∗∗ -0.732∗∗∗ (0.00547) (0.00461) (0.0473) Gender -0.0237∗∗∗ -0.00449∗∗∗ 0.00373∗∗∗ (0.00128) (0.000830) (0.00125) Constant 0.961∗∗∗ 0.977∗∗∗ 1.008∗∗∗ (0.000811) (0.000927) (0.00220) Observations 139613 132458 132458 Standard errors in parentheses ∗ p < .1, ∗∗ p < .05, ∗∗∗ p < .01 Table 9: Model 3: The effect of repeating in 3-4 grade on the probability of dropping out of s. school Dropout Dropout Dropout MCO FE IV Repeated 3-4 0.0401∗∗∗ 0.0244∗∗∗ 0.797∗∗∗ (0.00414) (0.00424) (0.0617) Gender 0.0168∗∗∗ 0.0150∗∗∗ -0.00276 (0.00164) (0.00173) (0.00240) Constant 0.0948∗∗∗ 0.102∗∗∗ 0.0634∗∗∗ (0.00113) (0.00156) (0.00344) Observations 139613 139613 139613 Standard errors in parentheses ∗ p < .1, ∗∗ p < .05, ∗∗∗ p < .01 24
  • 27. 6.1.2 Tables for ever repeating between first and fourth grade Table 10: Model 1: The effect of repeating in 1-4 grade on 6th and 8th grade GPA GPA 6 GPA 6 GPA 6 GPA 8 GPA 8 GPA 8 MCO FE IV MCO FE IV Repeat 1-4 -0.538∗∗∗ -0.497∗∗∗ -0.787∗∗∗ -0.426∗∗∗ -0.398∗∗∗ -0.661∗∗∗ (0.00548) (0.00613) (0.0271) (0.00590) (0.00637) (0.0294) Gender -0.173∗∗∗ -0.177∗∗∗ -0.172∗∗∗ -0.150∗∗∗ -0.153∗∗∗ -0.149∗∗∗ (0.00323) (0.00373) (0.00328) (0.00313) (0.00390) (0.00314) Constant 5.731∗∗∗ 5.753∗∗∗ 5.774∗∗∗ 5.679∗∗∗ 5.689∗∗∗ 5.704∗∗∗ (0.00223) (0.00380) (0.00417) (0.00222) (0.00408) (0.00415) Observations 135626 135626 135626 132458 132458 132458 Standard errors in parentheses ∗ p < .1, ∗∗ p < .05, ∗∗∗ p < .01 25
  • 28. Table 11: Model 2: The effect of repeating in 1-4 grade on the probability of attending s. school S. School S. School S. School MCO FE IV Repeat 1-4 -0.334∗∗∗ -0.118∗∗∗ -0.242∗∗∗ (0.00471) (0.00405) (0.00754) Gender -0.0211∗∗∗ -0.00434∗∗∗ -0.00296∗∗∗ (0.00124) (0.000825) (0.000809) Constant 0.969∗∗∗ 0.980∗∗∗ 0.991∗∗∗ (0.000771) (0.000886) (0.000940) Observations 139613 132458 132458 Standard errors in parentheses ∗ p < .1, ∗∗ p < .05, ∗∗∗ p < .01 Table 12: Model 3: The effect of repeating in 1-4 grade on the probability of dropping out of s. school Dropout Dropout Dropout MCO FE IV Repeat 1-4 0.0529∗∗∗ 0.0358∗∗∗ 0.309∗∗∗ (0.00362) (0.00387) (0.0123) Gender 0.0162∗∗∗ 0.0146∗∗∗ 0.00735∗∗∗ (0.00164) (0.00173) (0.00174) Constant 0.0932∗∗∗ 0.101∗∗∗ 0.0797∗∗∗ (0.00113) (0.00157) (0.00179) Observations 139613 139613 139613 Standard errors in parentheses ∗ p < .1, ∗∗ p < .05, ∗∗∗ p < .01 26
  • 29. 6.1.3 Tables for ever repeating between first and eighth grade Table 13: Model 2: The effect of repeating in 1-8 grade on the probability of attending s. school S. School S. School S. School MCO FE IV Repeat all Primary -0.246∗∗∗ -0.103∗∗∗ -0.232∗∗∗ (0.00283) (0.00234) (0.00771) Gender -0.0112∗∗∗ 0.000260 0.00794∗∗∗ (0.00122) (0.000805) (0.000943) Constant 0.983∗∗∗ 0.988∗∗∗ 1.009∗∗∗ (0.000712) (0.000777) (0.00142) Observations 139613 132458 132458 Standard errors in parentheses ∗ p < .1, ∗∗ p < .05, ∗∗∗ p < .01 27
  • 30. Table 14: Model 3: The effect of repeating in 1-8 grade on the probability of dropping out of s. school Dropout Dropout Dropout MCO FE IV Repeat all Primary 0.103∗∗∗ 0.0961∗∗∗ 0.297∗∗∗ (0.00262) (0.00289) (0.0128) Gender 0.00960∗∗∗ 0.00801∗∗∗ -0.00752∗∗∗ (0.00163) (0.00171) (0.00197) Constant 0.0821∗∗∗ 0.0883∗∗∗ 0.0571∗∗∗ (0.00112) (0.00157) (0.00250) Observations 139613 139613 139613 Standard errors in parentheses ∗ p < .1, ∗∗ p < .05, ∗∗∗ p < .01 7 Literature References [1] Cáceres-Delpiano, J. and Giolito, E. The impact of age of entry on aca- demic progression. Journal of Economic Literature, 2014. [2] Eide, E. and Showalter, M. The effect of grade retention on educational and labor market outcomes. Economics of Education Review, Vol. 20, issue 6, December 2001. [3] Elodie, A. Is grade repetition a second chance?. Journal of Economic Literature, January 2010. [4] Fertig, M. and Kluve, J. The effect of age at school entry on educational attainment in Germany. The institute for the Study of Labor (IZA), March 2005. [5] Jacob, B. and Lefgren, L. Remedial education and student achievement: A regression discontinuity analysis. The Review of Economics and Statistics, Vol. 86, issue 1, February 2004. [6] Jacob, B. and Lefgren, L. The effect of grade retention on High School completion. Journal of Pubic Economics, Vol. 1, issue 3, July 2009. 28
  • 31. [7] Manacorda, M. The cost of grade retention. The Review of Economics and Statistics, Vol. 94, issue 2, May 2012. [8] McEwan, P. and Shapiro, J. The benefits of delayed primary school en- rollment: Discontinuity estimates using exact birth dates. The Journal of Human Resources, July 2006. 29