SlideShare a Scribd company logo
1 of 6
Download to read offline
ECONOMIC
UPDATE                                                                                                                 Capital Markets Research


                                                                                                                                                                                                             4 January 2012


 Thai Economic Update
  November Economic Data                                                                                                                                                        Nalin Chutchotitham
                                                                                                                                                                                nalin.c@kasikornbank.com
 •       SET index closed lower in 2011 as European
         debt crisis worsens; Thai baht among the                                                                                                                               Puttikul Ackarachalanonth
                                                                                                                                                                                puttikul.a@kasikornbank.com
         weakest in the region in December
 •       Farm income index declined from the decrease
         in rice production
 •       Manufacturing     production   declined     in
         November due to direct and indirect effects in
         the production from the floods
 •       Private consumption index dropped to the
         lowest level for this year and private
         investment declined significantly
 •       Exports and imports dropped which result in
         lower trade surplus and current account deficit
 •       Bond yields rebounded towards the end of
         December upon news of large bond issuance


 December Inflation Data
 •       Headline inflation declined to 3.53% after
         flooding conditions improved and caused
         prices of food and transportation
 •       Core inflation lowered to 2.66% from 2.90%
 •       Deposit rates and lending rates remained
         largely unchanged in December


 For private circulation only. The foregoing is for informational purposes only and not to be considered as an offer to buy or sell, or a solicitation of an offer to buy or sell any security. Although the information herein was obtained
 from sources we believe to be reliable, we do not guarantee its accuracy nor do we assume responsibility for any error or mistake contained herein.
 Further information on the securities referred to herein may be obtained upon request.


                                                                                                                                                                                                                      Page 1 of 6
Economic Update

              Monthly Economic Data
    SET index closed lower in 2011 as European                                                                                 of expectation that China would continue its stronger-
    debt crisis worsens; Thai baht among the                                                                                   yuan policy to boost domestic demand and yuan’s
                                                                                                                               flexibility and usage in the financial markets. At the same
    weakest in the region in December                                                                                          time, Thai baht was deemed less attractive due to the
                                                                                                                               floods (affecting foreign investments and exports growth)
    1200                                                                                                                       as well as the decline in policy rate. Meanwhile, imports
                                                                       1107.36        1144.14
    1100                                                                                                                       of gold (after gold price hit several months’ low in
                                                                                                     1025.32
                                                                                                                               December) by local investors also played a part in driving
    1000
                                                                                                                               the Thai baht weaker.
     900
                                                                                            855.45
     800                                                                                                                           2000                                                                                               72
                                737.28                                                                                                                                                                                                73
     700                                                                                                                           1900                                                                                               74
     600                                                                                                                           1800                                                                                               75
       Jan-10         May-10          Sep-10           Jan-11          May-11       Sep-11                                                                                                                                            76
                                                                                                                                   1700                                                                                               77
                                                           SET Index
                                                                                                                                                                                                                                      78
                                                                                                                                   1600                                                                                               79
    SET index saw much volatility in the year 2011 compared                                                                                                                                                                           80
                                                                                                                                   1500
    to the year 2012, mainly due to uncertainties in the global                                                                                                                                                                       81
    financial markets and doubts about the continuity of                                                                           1400                                                                                               82
                                                                                                                                      Jun-11                    Aug-11                   Oct-11                  Dec-11
    global economic growth. The index closed at 1032.76 in
    the year 2010 and 1025.32 in the year 2011. A major                                                                                                    Gold ($/ounce, LHS)              Dollar Index (RHS, inverted)
    slump was observed in September-October period when
    the risk of the euro-zone breaking up was escalating and                                                                   Farm income index declined                                                          from             the
    European leaders lacked a credible plan to ameliorate
                                                                                                                               decrease in rice production
    the situation. In any case, SET index found support from
    local investors from the tax-saving LTF and RMF                                                                            Agricultural production decreased by 7.2% YoY due to
    purchases towards year-end.                                                                                                decrease in rice production that was damaged by the
    $ mn                              Foreign net buy in SET (year-to-date, $ mn)                                              flooding. Meanwhile, rubber and oil palm production
     2000
                                                                                                                               continued to increase from the expansion of the planting
     1500                                                                                                                      areas. In November, farm income dropped by 8.6% YoY
     1000                                                                                                                      with 1.5% decline in agricultural price. Agricultural price
      500
                                                                                                                               mainly declined as rubber price decline from the concern
                                                                                                                               in global economy slowdown, production of several
        0
                                                                                                                               automobile manufacturers’ disruption from the floods and
     -500                                                                                                                      increase in global supply.
    -1000

    -1500
        Jan-11         Mar-11         May-11              Jul-11        Sep-11       Nov-11
                                                                                                                               Manufacturing     production   declined     in
                                                                                                                               November due to direct and indirect effects in
    The degree of volatility in the SET index can be observed                                                                  the production from the floods
    from the foreign net-buying value as well. Throughout the
                                                                                                                                % yoy                                                                                                %
    year, year-to-date net-buying value had swung from a                                                                           40                                                                                                 70
    low of – USD1,229mn to a high of USD 1,082mn. At                                                                               30
                                                                                                                                   20                                                                                                 65
    year-end, foreign investors had sold USD167mn of local
                                                                                                                                   10                                                                                                 60
    stocks, compared to the net-buy position of USD2,687mn                                                                          0
    as of end-2010.                                                                                                               -10                                                                                                 55
                                                                                                                                  -20
                                                                                                                                  -30                                                                                                 50
                                                                                                                                  -40                                                                                                 45
       JPY                                                                                       1.5%
                     Change against USD, 1 month,                                                                                 -50
      CNY                                                                                     1.1%                                -60                                                                                                 40
                     as of end 4th Jan 2012
      MYR                                                           -0.1%                                                            Jan-07 Jul-07 Jan-08 Jul-08 Jan-09 Jul-09 Jan-10 Jul-10 Jan-11 Jul-11
      TWD                                                      -0.4%
                                                                                                                                          Manufacturing production index ISIC (%yoy, left)               Capacity Utilization (%, right)
      SGD                                                   -0.6%
       IDR                                        -1.2%
       PHP                                     -1.3%                                                                           Production continued to drop in most of the sectors as
      KRW                                 -1.6%                                                                                the manufacturing plants temporarily shutdown due to
       THB                    -2.4%                                                                                            direct and indirect effects (supply chain disruotpion) from
       INR            -2.9%                                                                                                    the flooding situation. Manufacturing Production Index
            -4.0%        -3.0%           -2.0%            -1.0%             0.0%     1.0%            2.0%                      (MPI) dropped by 48.6% YoY. The most affected
                                                                                                                               industries were vehicles (-84% YoY), hard disk drive (-
                                                                                                                               81.6% YoY) and integrated circuit (-75.5% YoY).
    The performance of Thai baht was one of the weakest in
                                                                                                                               Following the declining MPI, capacity utilization in
    the region for the month of December. Notably, Asian
                                                                                                                               November declined from October to 40.1.
    currencies were mostly weakening against the U.S. dollar
    as investors sought refuge in the traditional safe haven
    assets, including the dollar and the yen. Only the
    Chinese yuan managed to continue gaining on the back
      For private circulation only. The foregoing is for informational purposes only and not to be considered as an offer to buy or sell, or a solicitation of an offer to buy or sell any security. Although the information herein was obtained
      from sources we believe to be reliable, we do not guarantee its accuracy nor do we assume responsibility for any error or mistake contained herein.
      Further information on the securities referred to herein may be obtained upon request.


                                                                                                                                                                                                                           Page 2 of 6
Economic Update

     Private consumption index dropped to the                                                                                     Exports and imports dropped, resulting in a
     lowest level for this year and private                                                                                       lower trade surplus and a current account
     investment declined significantly                                                                                            deficit

      % YoY                                                                                               Index                     % yoy
        10                                                                                                   150                      80
         8                                                                                                   145                      60
         6                                                                                                   140
                                                                                                             135                      40
         4
                                                                                                             130                      20
         2
                                                                                                             125
         0                                                                                                                             0
                                                                                                             120
        -2                                                                                                   115                     -20
        -4                                                                                                   110                     -40
        -6                                                                                                   105
        -8                                                                                                   100                     -60
          Jan-07               Jan-08           Jan-09              Jan-10             Jan-11                                           Jan-08      Jul-08      Jan-09      Jul-09     Jan-10       Jul-10       Jan-11    Jul-11

                       PCI Growth (left axis)              Private Consumtption Index (sa, right axis)                                                                      Exports                    Imports


     Private Consumption Index (PCI) decreased from 135.8                                                                         Export value dropped by 13.1% YoY in November,
     in October to 135.1 in November, especially from the                                                                         amounting to USD15.3bn. This was the lowest export
     contraction in the indicator for domestic automobile sales                                                                   value since July 2010 due to manufacturing production
     and VAT. A decline in domestic automobile sales was                                                                          contraction. Moreover, exports of computer and
     due to the shortage of the supplies in the car production                                                                    integrated circuit dropped on the back of the slowdown in
     while VAT declined from the reduced consumption in                                                                           global economy, especially in the U.S. and the euro area.
     products and services. Compared to the same period last
     year, PCI decreased 1.6% and decreased 0.5% from the                                                                         Import value dropped by 1.9% YoY in November,
     previous month.                                                                                                              amounting to USD15bn. This resulted from the decline in
                                                                                                                                  the electronic component, raw material used in the
         PII                                                                                              PCI                     chemical and plastic industries as well as the decrease in
        180                                                                                                150                    electrical machinery imports due to the shrinkage in the
        170                                                                                                145
                                                                                                                                  production sector.
        160
        150                                                                                                140                      US$, mn
        140                                                                                                135                        6000
        130                                                                                                130                        5000
        120                                                                                                                           4000
        110                                                                                                125                        3000
        100                                                                                                120                        2000
          Jan-07                Jan-08          Jan-09             Jan-10             Jan-11                                          1000
                                                                                                                                         0
                Private Investment Index (sa, left axis)           Private Consumtption Index (sa, right axis)                       -1000
                                                                                                                                     -2000
                                                                                                                                     -3000
     The investment side showed the same picture. Private
                                                                                                                                              Sep-10           Dec-10             Mar-11            Jun-11            Sep-11
     Investment Index (PII) decreased from 198.9 in October
     to 186.4 in November from the shrinkage in the                                                                                               Trade balance               Services and transfers               Balance of Payments

     production sector. Imports of capital goods declined in
     almost all product categories and commercial car sales                                                                       This resulted in the reduction in the trade balance. Trade
     dropped from temporary shutdown of the automobile                                                                            balance in November was only USD218m, compared to
     industry.                                                                                                                    the trade surplus of USD1.01bn in October. Income and
                                                                                                                                  service account registered a deficit at USD355m even
        50 = neutral                            Thai Business Sentiment Indices                                                   though there was an increase in the transfer receipt from
        60                                                                                                                        foreign insurance companies to the local insurers
        55                                                                                                                        regarding to the flood damage. This, together with the
        50
                                                                                                                                  lower trade surplus, resulted in the current account deficit
                                                                                                                                  of USD136m. Capital and financial account in November
        45
                                                                                                                                  reported a deficit of USD1.38bn, mainly from the
        40                                                                                                                        repayment of short-term loan of the commercial banks.
        35                                                                                                                        Balance of Payment in November registered a deficit of
        30                                                                                                                        USD1.5 resulting in the forth month of the deficit
          Jul-07                  Jul-08              Jul-09                 Jul-10              Jul-11                           continually.
                                   BSI                         BSI 3m forward expectations
                                                                                                                                  Foreign tourist arrival was 1.2 million people, decreased
                                                                                                                                  by 17.5% yoy This was due to the decline of foreign
     Business Sentiment Index (BSI) in November increased                                                                         tourist arrival in almost all of the countries – especially
     from 36.7 in October (the lowest level since early 2009)                                                                     from ASEAN, China, India and Japan. The seasonally-
     to 39.0 in November. However, BSI in November was still                                                                      adjusted foreign tourist arrival in November dropped
     lower than September’s level of 48.5. The indicator for                                                                      21.3% from October’s level due to the trip cancellations
     next 3 months’ outlook surveyed in November was 54.4,                                                                        when many parts of Bangkok were flooded. However,
     higher than 42.9 in October survey.                                                                                          hotel occupancy rate did not shrink, mainly because of
                                                                                                                                  temporary residential evacuation from flooded areas
                                                                                                                                  which offset the reduction in hotel occupancy from the
                                                                                                                                  decline in foreign tourist arrival.


     For private circulation only. The foregoing is for informational purposes only and not to be considered as an offer to buy or sell, or a solicitation of an offer to buy or sell any security. Although the information herein was
     obtained from sources we believe to be reliable, we do not guarantee its accuracy nor do we assume responsibility for any error or mistake contained herein.
     Further information on the securities referred to herein may be obtained upon request.


                                                                                                                                                                                                                          Page 3 of 6
Economic Update

                                                                                                                                       %                                  Government bond yield curve
        2,000                                                                                                 75
                                                                                                                                       3.50
                                                                                                              70
        1,800                                                                                                                          3.40
                                                                                                              65
        1,600                                                                                                 60                       3.30
                                                                                                              55                       3.20
        1,400
                                                                                                              50
                                                                                                                                       3.10
        1,200                                                                                                 45
                                                                                                                                       3.00
                                                                                                              40
        1,000                                                                                                                          2.90
                                                                                                              35
             800                                                                                              30                       2.80
                Jan-08    Jul-08      Jan-09      Jul-09       Jan-10      Jul-10    Jan-11      Jul-11                                          6m      1y       2y     3y       4y      5y      6y       7y      8y        9y    10y
                            Tourist arrival ('000 left axis)               Hotel occupany rate (right axis)                                            30-Dec-11                   20-Dec-11                     30-Nov-11                TTM


                                                                                                                                  The market has priced in a larger bond supply in Q1 –
                                                                                                                                  THB108bn is announced during the last week of the year
     Inflation rate    declined  significantly  in
                                                                                                                                  while the Finance Ministry also said that another
     December after flooding conditions improved                                                                                  THB53.5bn of supply would likely be added once the
     Headline consumer price index (CPI) declined by 0.48%                                                                        FY2012 budget bill becomes law in February. This is
     mom in December, indicating that price pressure has                                                                          much larger than issuance during the past few quarters,
     eased more than expected and the headline inflation rate                                                                     even if we skip the Oct-Dec 2011 period where issuance
     is down to 3.53% from 4.19% in November. For the year                                                                        was merely THB32bn. At the same time, investors are
     2011, inflation rate averaged at 3.81%, in line with the                                                                     also aware that issuance during the second half of fiscal
     forecast of the Ministry of Commerce.                                                                                        year is not any less. Taking into consideration the
                                                                                                                                  planned issuance of THB540bn of government bonds
      %                              Headline CPI mom                          Headline CPI yoy
       5.0                                                                                                                        (LBs and FRBs only, not including saving bonds) in total
       4.5                                                                                                                        for the year, we are likely to be left with THB320bn of
       4.0                                                                                                                        issuance in Q3 and Q4. Despite the high level of liquidity,
       3.5
       3.0                                                                                                                        it is likely that the yield curve would continue to steepen
       2.5                                                                                                                        going forward. The issuance of LB540bn of government
       2.0                                                      1.4
       1.5                                                                                                                        bonds do take into consideration THB400bn of planned
       1.0                                     0.5 0.4 0.5
                                                                        0.3 0.1 0.2 0.4
                                                                                                                                  budget deficit and about THB340bn of debt restructuring,
       0.5     0.2 0.2          0.0 0.2 0.2                                                      0.2 0.2
       0.0
                                                                                                                                  but had not taken into consideration the cabinet’s plan to
      -0.5               -0.1                                                                                                     borrow an additional THB200bn via an emergency
                                                                                          -0.3             -0.5
      -1.0                                                                                                                        decree (not finalized so far). In any case, government
              Jul-10        Oct-10            Jan-11           Apr-11          Jul-11         Oct-11
                                                                                                                                  funding needs is likely to be hefty for the year and the
                                                                                                                                  market may not like it much although the room for
     There were several conditions at play in December. First                                                                     government’s borrowing over the long-run remains
     of the all, retail oil prices had declined in line with the fall                                                             substantial, with the public debt to GDP ratio standing at
     of world crude oil prices. Meanwhile, flooding conditions                                                                    41.03 as of end October.
     in Thailand had ameliorated and supply of necessary
     goods and food began to return to normal. Transportation                                                                     Deposit and lending rates stayed unchanged
     costs had also reduced due to the above reasons.                                                                             while growth of loans and deposits slowed
     Notably, the CPI for raw food and energy items declined
                                                                                                                                  down
     by 1.94% mom in December while the CPI for food and
     beverages fell by 1.20%.
                                                                                                                                      %
                                                                                                                                      4.5
     Meanwhile, the core inflation rate (excluding raw food
                                                                                                                                      4.0
     and energy items) was at 2.66% in December, a
                                                                                                                                      3.5
     deceleration from November’s level at 2.90%. For the
     whole year, core inflation rate averaged at 2.36%.                                                                               3.0
                                                                                                                                      2.5

     Bond yields rebounded towards the end of                                                                                         2.0
                                                                                                                                      1.5
     December upon news of large bond issuance
                                                                                                                                      1.0
                                                                                                                                        Jan-11         Mar-11          May-11           Jul-11          Sep-11          Nov-11
     In December, bond yields declined by 5-13bp across the                                                                                           Repo rate                   12m deposit rate                  MLR - 4%
     curve when compared to their levels as of end-
     November. The fall in 4-year yield was as much as 31bp
                                                                                                                                  The 4 large banks’ average 1-year time deposit rate and
     during mid-month as global markets turned to safer
                                                                                                                                  minimum lending rate (MLR) remained unchanged in
     assets such as bonds and the local market was
                                                                                                                                  December at 2.74% and 7.25%, respectively. This was
     expecting low levels of bond issuance in the coming
                                                                                                                                  despite of the 25bp rate cut by the BoT on November
     quarter due to the delay in the FY2012 budget bill. Yet,                                                                       th
                                                                                                                                  30 .
     towards the end of the month, yields rebounded and the
     yield curve steepened somewhat, driving the 2-10 spread
                                                                                                                                  Commercial banks had to keep their deposit rates
     to 24bp from 21bp as of end-November.
                                                                                                                                  competitive with the state-own banks. Due to the
                                                                                                                                  upcoming government’s projects and increased financing
                                                                                                                                  needs for reconstruction efforts, state-own banks had
                                                                                                                                  been offering attractive returns for depositors in order to
                                                                                                                                  amass sufficient funds. As for lending rates, they had to

     For private circulation only. The foregoing is for informational purposes only and not to be considered as an offer to buy or sell, or a solicitation of an offer to buy or sell any security. Although the information herein was
     obtained from sources we believe to be reliable, we do not guarantee its accuracy nor do we assume responsibility for any error or mistake contained herein.
     Further information on the securities referred to herein may be obtained upon request.


                                                                                                                                                                                                                        Page 4 of 6
Economic Update

     be kept high on increased credit risks (due to poorer
     economic outlook) and the unchanged deposit rates as
     well. In any case, there is a high chance that both deposit
     and lending rates would fall should the policy rate be
     reduced to 3.00% (according to our forecast) as of end-
     January.
        % yoy
        14
        12
        10
          8
          6
          4
          2
          0
         -2
              Jan-07   Jul-07      Jan-08      Jul-08      Jan-09      Jul-09     Jan-10        Jul-10

                         Private credit                 Private deposits                   M2

     Private credit growth moderated to 16.0%yoy in
     November from 17%yoy in the previous month.
     Meanwhile, deposit growth remained strong but slowed
     down to 10.3% yoy from 11.3%.


     For private circulation only. The foregoing is for informational purposes only and not to be considered as an offer to buy or sell, or a solicitation of an offer to buy or sell any security. Although the information herein was
     obtained from sources we believe to be reliable, we do not guarantee its accuracy nor do we assume responsibility for any error or mistake contained herein.
     Further information on the securities referred to herein may be obtained upon request.


                                                                                                                                                                                                                       Page 5 of 6
Economic Update
                               Bank of Thailand Data Table                                                                                                                        2011
                                                                                                           May-11              Jun-11               Jul-11             Aug-11               Sep-11              Oct-11              Nov-11
     The Real Sector (%yoy , unless specified otherwise)
     Manufacturing Production Index, seasonally adjusted (level)                                                182.9               193.9               185.7               196.1               188.2               132.8                   99.2
     Manufacturing Production Index, without seasonal adjustment (level)                                        178.1               201.6               188.9               196.1               200.8               133.7                   97.9
     Manufacturing Production Index, without seasonal adjustment                                                  -3.7                  3.8                -0.7                 6.8                -0.3              -30.1                 -48.6
     Industrial Capacity Utilization (%)                                                                          58.8                64.1                63.1                65.0                65.5                46.4                  40.1
     Private Consumption Indicators (%yoy)
         Retail Sales (at 2002 prices)                                                                              6.1                 6.1                 6.1               13.5                11.3                 -3.0                 n.a.
         Passenger Car Sales (units)                                                                             -15.2                 -0.5               12.2                26.4                29.4               -38.8                 -62.1
         Motorcycle Sales (units)                                                                                 14.7                22.9                  0.4               26.1                16.4               -14.1                 -22.4
         Imports of Consumer Goods (at 2000 prices)                                                               14.4                  4.2                 9.5               17.1                15.7                  2.7                  0.2
     Private Investment Indicators
         Commercial Car Sales (units)                                                                              -6.2                -0.3               10.1                15.7                25.7               -41.8                 -71.5
         Imports of Capital Goods (at 2000 prices)                                                                  9.2                 8.9               10.4                17.0                  5.5                 1.3                 -5.2
         Cement Sales (tons)                                                                                       -3.2                 3.7                 6.6               11.8                11.4                10.2                  -2.2
     Government Cash Balance (billions of baht)                                                                   13.9              178.7                -38.6                 -9.8               95.6               -64.9                 -28.6
     Consumer Price Index                                                                                         4.19                4.06                4.08                4.29                4.03                4.19                  4.19
         Food                                                                                                     8.38                7.76                7.17                8.43                8.84                9.86                 10.21
         Non-Food                                                                                                 1.69                1.81                2.21                1.77                1.07                0.75                  0.54
         Core Inflation (excluding raw food and energy)                                                           2.48                2.55                2.59                2.85                2.92                2.89                  2.90
     External Accounts (Millions of US$, unless specified otherwise)
         Exports                                                                                              19,284              20,384              21,098               20,940              21,259              17,019                 15,287
         ( % yoy)                                                                                                 17.3                14.0                36.4                28.4                18.4                 -0.1                -13.1
         Imports                                                                                              17,098              17,017              16,546               20,235              18,840              16,006                 15,068
         ( % yoy)                                                                                                 34.5                23.6                13.2                45.9                42.6                20.6                  -1.9
         Trade Balance                                                                                          2,186               3,366               4,552                  705              2,419               1,013                   218
         Current Account Balance                                                                                  -656              1,969               3,438                 -697                 404                   39                 -136
         Capital Account                                                                                           -65                    0                   0                 -40                  34                   0                   0
         Financial Account                                                                                        -294             -2,304              -2,496                  161                 317             -1,459                 -1,381
           - Monetary authority (central bank)                                                                 -2,048                 -448              2,316              -1,451                 -755                -307                  -392
           - Government                                                                                            236                  23                 873                 922                    6                  67                 165
           - Other depository corporations (banks)                                                              1,534                 -178             -5,708                  883              3,866              -4,103                 -3,653
           - Others                                                                                                -16             -1,700                    23               -193             -2,800               2,884                  2,498
         Balance of Payments                                                                                   -2,600                 -972                 541                -556             -1,674              -1,886                 -1,506
         Official Reserves (billions of US$)                                                                    185.5               184.9               187.6               188.3               180.1               182.0                  178.3
     Monetary Statistics (End of period) (Billions of baht)
         Monetary Base                                                                                       1,193.5              1,223.4             1,206.8             1,219.2             1,229.5             1,311.0             1,259.8
         ( % yoy)                                                                                                   9.6               14.1                13.1                16.6                10.0                22.3                  13.5
         Narrow Money (M1)                                                                                    1,395.8             1,336.6             1,336.3             1,345.1             1,328.0             1,362.7             1,363.5
         ( % yoy)                                                                                                 10.6                13.3                13.9                13.9                13.0                13.3                  10.4
         Broad Money (M2)                                                                                   12,577.2            12,614.4            12,799.4            12,875.3            12,913.9            13,152.9            13,325.0
         ( % yoy)                                                                                                 14.3                16.3                17.6                17.4                16.2                16.2                  15.9
         Other Depository Corporations Deposits                                                             11,092.8            10,993.2            11,077.8            11,153.5            11,082.1            11,364.3            11,455.0
         ( % yoy)                                                                                                   8.4               10.1                11.1                11.4                  9.8               11.3                  10.3
         Other Depository Corporations Private Credits                                                      10,517.7            10,679.1            10,718.9            10,899.7            11,079.9            11,209.6            11,308.7
         ( % yoy)                                                                                                 15.6                16.1                16.3                17.2                17.5                17.0                  16.0
     Interest Rates (% p.a.)
         Repurchase Rate, 1 day (closing rate daily average)                                                      2.75                3.00                3.16                3.32                3.50                3.50                  3.49
         Overnight Interbank Rate (mode daily average)                                                            2.62                2.90                3.06                3.22                3.40                3.41                  3.39
         Fixed Deposit Rate (1 year)                                                                       2.00-2.30           2.20-2.50           2.45-2.75           2.45-3.00           2.70-3.00           2.70-3.00           2.70-3.00
         Prime Rate (MLR)                                                                                  6.75-7.13           6.87-7.25           7.12-7.50           7.12-7.50         7.25-7.625          7.25-7.625          7.25-7.625
     Exchange Rate (Baht : US$)                                                                                 30.25               30.52               30.07               29.87               30.42               30.86                  30.95
     Source: Bank of Thailand


     For private circulation only. The foregoing is for informational purposes only and not to be considered as an offer to buy or sell, or a solicitation of an offer to buy or sell any security. Although the information herein was
     obtained from sources we believe to be reliable, we do not guarantee its accuracy nor do we assume responsibility for any error or mistake contained herein.
     Further information on the securities referred to herein may be obtained upon request.


                                                                                                                                                                                                                       Page 6 of 6

More Related Content

Viewers also liked

Viewers also liked (8)

Market watch jan 19
Market watch jan 19Market watch jan 19
Market watch jan 19
 
Cmb seminar khun kobsidthi 2011 12-15
Cmb seminar khun kobsidthi 2011 12-15Cmb seminar khun kobsidthi 2011 12-15
Cmb seminar khun kobsidthi 2011 12-15
 
K bank multi asset strategies feb 2011
K bank multi asset strategies   feb 2011K bank multi asset strategies   feb 2011
K bank multi asset strategies feb 2011
 
KBank capital market perspectives dec 20 trade
KBank capital market perspectives dec 20   tradeKBank capital market perspectives dec 20   trade
KBank capital market perspectives dec 20 trade
 
Market watch feb 23
Market watch feb 23Market watch feb 23
Market watch feb 23
 
KBank Economics update Mar 2012
KBank Economics update   Mar 2012KBank Economics update   Mar 2012
KBank Economics update Mar 2012
 
KBank Capital Market Perspectives Oct 19
KBank Capital Market Perspectives Oct 19 KBank Capital Market Perspectives Oct 19
KBank Capital Market Perspectives Oct 19
 
KBank Capital Market perspectives Portugal in focus
KBank Capital Market perspectives   Portugal in focusKBank Capital Market perspectives   Portugal in focus
KBank Capital Market perspectives Portugal in focus
 

Similar to KBank Econ update jan 2012

Keynote capitals india morning note january 30-'12
Keynote capitals india morning note january 30-'12Keynote capitals india morning note january 30-'12
Keynote capitals india morning note january 30-'12Keynote Capitals Ltd.
 
Economic Reform and Trade Liberalization- Story of India
Economic Reform and Trade Liberalization- Story of IndiaEconomic Reform and Trade Liberalization- Story of India
Economic Reform and Trade Liberalization- Story of IndiaANM Farukh
 
Keynote capitals india morning note october 4-'11
Keynote capitals india morning note october 4-'11Keynote capitals india morning note october 4-'11
Keynote capitals india morning note october 4-'11Keynote Capitals Ltd.
 
Scenarios for the Nordic Financial Industry 2009
Scenarios for the Nordic Financial Industry 2009Scenarios for the Nordic Financial Industry 2009
Scenarios for the Nordic Financial Industry 2009Alexander Huun
 
Keynote capitals india morning note august 26-'11
Keynote capitals india morning note august 26-'11Keynote capitals india morning note august 26-'11
Keynote capitals india morning note august 26-'11Keynote Capitals Ltd.
 
Access Bank Seminar Session 3b - Ebenezer Olufowose
Access Bank Seminar Session 3b - Ebenezer OlufowoseAccess Bank Seminar Session 3b - Ebenezer Olufowose
Access Bank Seminar Session 3b - Ebenezer Olufowoseproshare
 

Similar to KBank Econ update jan 2012 (9)

Reforming Wall Street, Protecting Main Street
Reforming Wall Street, Protecting Main StreetReforming Wall Street, Protecting Main Street
Reforming Wall Street, Protecting Main Street
 
KBank econ update jan 2011
KBank econ update jan 2011KBank econ update jan 2011
KBank econ update jan 2011
 
Keynote capitals india morning note january 30-'12
Keynote capitals india morning note january 30-'12Keynote capitals india morning note january 30-'12
Keynote capitals india morning note january 30-'12
 
Economic Reform and Trade Liberalization- Story of India
Economic Reform and Trade Liberalization- Story of IndiaEconomic Reform and Trade Liberalization- Story of India
Economic Reform and Trade Liberalization- Story of India
 
Keynote capitals india morning note october 4-'11
Keynote capitals india morning note october 4-'11Keynote capitals india morning note october 4-'11
Keynote capitals india morning note october 4-'11
 
Scenarios for the Nordic Financial Industry 2009
Scenarios for the Nordic Financial Industry 2009Scenarios for the Nordic Financial Industry 2009
Scenarios for the Nordic Financial Industry 2009
 
Keynote capitals india morning note august 26-'11
Keynote capitals india morning note august 26-'11Keynote capitals india morning note august 26-'11
Keynote capitals india morning note august 26-'11
 
Access Bank Seminar Session 3b - Ebenezer Olufowose
Access Bank Seminar Session 3b - Ebenezer OlufowoseAccess Bank Seminar Session 3b - Ebenezer Olufowose
Access Bank Seminar Session 3b - Ebenezer Olufowose
 
Weekly market outlook 11.02.12
Weekly market outlook 11.02.12Weekly market outlook 11.02.12
Weekly market outlook 11.02.12
 

More from KBank Fx Dealing Room

KBank Capital Market perspectives May 18 markets wrap up - positioning for ...
KBank Capital Market perspectives   May 18 markets wrap up - positioning for ...KBank Capital Market perspectives   May 18 markets wrap up - positioning for ...
KBank Capital Market perspectives May 18 markets wrap up - positioning for ...KBank Fx Dealing Room
 
KBank Capital Market perspective May 18 greece
KBank Capital Market perspective May 18 greeceKBank Capital Market perspective May 18 greece
KBank Capital Market perspective May 18 greeceKBank Fx Dealing Room
 
KBank CMB Seminar Khun Kitti 2012 04-19
KBank CMB Seminar  Khun Kitti  2012 04-19KBank CMB Seminar  Khun Kitti  2012 04-19
KBank CMB Seminar Khun Kitti 2012 04-19KBank Fx Dealing Room
 
KBank CMB Seminar Khun Kobsidthi 2012 04-19
KBank CMB Seminar Khun Kobsidthi 2012 04-19KBank CMB Seminar Khun Kobsidthi 2012 04-19
KBank CMB Seminar Khun Kobsidthi 2012 04-19KBank Fx Dealing Room
 
KBank CMB Seminar Khun Kitti 2012 04-19
KBank CMB Seminar  Khun Kitti  2012 04-19KBank CMB Seminar  Khun Kitti  2012 04-19
KBank CMB Seminar Khun Kitti 2012 04-19KBank Fx Dealing Room
 
KBank Capital Market perspectives Apr 26 fomc
KBank Capital Market perspectives Apr 26  fomcKBank Capital Market perspectives Apr 26  fomc
KBank Capital Market perspectives Apr 26 fomcKBank Fx Dealing Room
 
KBank Capital Market perspective, FATFs slap on the wrist
KBank Capital Market perspective, FATFs slap on the wristKBank Capital Market perspective, FATFs slap on the wrist
KBank Capital Market perspective, FATFs slap on the wristKBank Fx Dealing Room
 
KBank Capital Market Perspective Feb 20 - gdp q4
KBank Capital Market Perspective   Feb 20 - gdp q4KBank Capital Market Perspective   Feb 20 - gdp q4
KBank Capital Market Perspective Feb 20 - gdp q4KBank Fx Dealing Room
 
KBank CMB Seminar Khun Kitti 2012 02-17
KBank CMB Seminar Khun Kitti  2012 02-17KBank CMB Seminar Khun Kitti  2012 02-17
KBank CMB Seminar Khun Kitti 2012 02-17KBank Fx Dealing Room
 
KฺฺฺBank CMB seminar Khun Kobsidthi 2012 02-17
KฺฺฺBank CMB seminar Khun Kobsidthi 2012 02-17KฺฺฺBank CMB seminar Khun Kobsidthi 2012 02-17
KฺฺฺBank CMB seminar Khun Kobsidthi 2012 02-17KBank Fx Dealing Room
 
KBank Multi Asset Strategies Jan 2012
KBank Multi Asset Strategies   Jan 2012KBank Multi Asset Strategies   Jan 2012
KBank Multi Asset Strategies Jan 2012KBank Fx Dealing Room
 
K bank multi asset strategies jan 2012
K bank multi asset strategies   jan 2012K bank multi asset strategies   jan 2012
K bank multi asset strategies jan 2012KBank Fx Dealing Room
 
KBank Capital Market perspectives Dec 30 flooding and economic slowdown in n...
KBank Capital Market perspectives Dec 30  flooding and economic slowdown in n...KBank Capital Market perspectives Dec 30  flooding and economic slowdown in n...
KBank Capital Market perspectives Dec 30 flooding and economic slowdown in n...KBank Fx Dealing Room
 
KBank Multi Asset Strategies dec 2011 th
KBank Multi Asset Strategies dec 2011   thKBank Multi Asset Strategies dec 2011   th
KBank Multi Asset Strategies dec 2011 thKBank Fx Dealing Room
 
KBank Capital Market perspectives Nov 21.2011
KBank Capital Market perspectives Nov 21.2011KBank Capital Market perspectives Nov 21.2011
KBank Capital Market perspectives Nov 21.2011KBank Fx Dealing Room
 

More from KBank Fx Dealing Room (20)

KBank Capital Market perspectives May 18 markets wrap up - positioning for ...
KBank Capital Market perspectives   May 18 markets wrap up - positioning for ...KBank Capital Market perspectives   May 18 markets wrap up - positioning for ...
KBank Capital Market perspectives May 18 markets wrap up - positioning for ...
 
KBank Capital Market perspective May 18 greece
KBank Capital Market perspective May 18 greeceKBank Capital Market perspective May 18 greece
KBank Capital Market perspective May 18 greece
 
KBank CMB Seminar Khun Kitti 2012 04-19
KBank CMB Seminar  Khun Kitti  2012 04-19KBank CMB Seminar  Khun Kitti  2012 04-19
KBank CMB Seminar Khun Kitti 2012 04-19
 
KBank CMB Seminar Khun Kobsidthi 2012 04-19
KBank CMB Seminar Khun Kobsidthi 2012 04-19KBank CMB Seminar Khun Kobsidthi 2012 04-19
KBank CMB Seminar Khun Kobsidthi 2012 04-19
 
KBank CMB Seminar Khun Kitti 2012 04-19
KBank CMB Seminar  Khun Kitti  2012 04-19KBank CMB Seminar  Khun Kitti  2012 04-19
KBank CMB Seminar Khun Kitti 2012 04-19
 
KBank Capital Market perspectives Apr 26 fomc
KBank Capital Market perspectives Apr 26  fomcKBank Capital Market perspectives Apr 26  fomc
KBank Capital Market perspectives Apr 26 fomc
 
KBank CMB's event mar (Thai)
KBank CMB's event mar (Thai)KBank CMB's event mar (Thai)
KBank CMB's event mar (Thai)
 
KBank Capital Market perspective, FATFs slap on the wrist
KBank Capital Market perspective, FATFs slap on the wristKBank Capital Market perspective, FATFs slap on the wrist
KBank Capital Market perspective, FATFs slap on the wrist
 
KBank Capital Market Perspective Feb 20 - gdp q4
KBank Capital Market Perspective   Feb 20 - gdp q4KBank Capital Market Perspective   Feb 20 - gdp q4
KBank Capital Market Perspective Feb 20 - gdp q4
 
KBank CMB Seminar Khun Kitti 2012 02-17
KBank CMB Seminar Khun Kitti  2012 02-17KBank CMB Seminar Khun Kitti  2012 02-17
KBank CMB Seminar Khun Kitti 2012 02-17
 
KฺฺฺBank CMB seminar Khun Kobsidthi 2012 02-17
KฺฺฺBank CMB seminar Khun Kobsidthi 2012 02-17KฺฺฺBank CMB seminar Khun Kobsidthi 2012 02-17
KฺฺฺBank CMB seminar Khun Kobsidthi 2012 02-17
 
Prariwat feb23
Prariwat feb23Prariwat feb23
Prariwat feb23
 
KBank Multi Asset Strategies Jan 2012
KBank Multi Asset Strategies   Jan 2012KBank Multi Asset Strategies   Jan 2012
KBank Multi Asset Strategies Jan 2012
 
K bank multi asset strategies jan 2012
K bank multi asset strategies   jan 2012K bank multi asset strategies   jan 2012
K bank multi asset strategies jan 2012
 
KBank Capital Market perspectives Dec 30 flooding and economic slowdown in n...
KBank Capital Market perspectives Dec 30  flooding and economic slowdown in n...KBank Capital Market perspectives Dec 30  flooding and economic slowdown in n...
KBank Capital Market perspectives Dec 30 flooding and economic slowdown in n...
 
KBank Multi Asset Strategies dec 2011 th
KBank Multi Asset Strategies dec 2011   thKBank Multi Asset Strategies dec 2011   th
KBank Multi Asset Strategies dec 2011 th
 
Cmb seminar khun kitti 2011 12-15
Cmb seminar khun kitti  2011 12-15Cmb seminar khun kitti  2011 12-15
Cmb seminar khun kitti 2011 12-15
 
K bank daily nov 22
K bank daily nov 22K bank daily nov 22
K bank daily nov 22
 
KBank Capital Market perspectives Nov 21.2011
KBank Capital Market perspectives Nov 21.2011KBank Capital Market perspectives Nov 21.2011
KBank Capital Market perspectives Nov 21.2011
 
KBank Daily Update Nov 21.2011
KBank Daily Update Nov 21.2011KBank Daily Update Nov 21.2011
KBank Daily Update Nov 21.2011
 

Recently uploaded

government_intervention_in_business_ownership[1].pdf
government_intervention_in_business_ownership[1].pdfgovernment_intervention_in_business_ownership[1].pdf
government_intervention_in_business_ownership[1].pdfshaunmashale756
 
(办理原版一样)QUT毕业证昆士兰科技大学毕业证学位证留信学历认证成绩单补办
(办理原版一样)QUT毕业证昆士兰科技大学毕业证学位证留信学历认证成绩单补办(办理原版一样)QUT毕业证昆士兰科技大学毕业证学位证留信学历认证成绩单补办
(办理原版一样)QUT毕业证昆士兰科技大学毕业证学位证留信学历认证成绩单补办fqiuho152
 
letter-from-the-chair-to-the-fca-relating-to-british-steel-pensions-scheme-15...
letter-from-the-chair-to-the-fca-relating-to-british-steel-pensions-scheme-15...letter-from-the-chair-to-the-fca-relating-to-british-steel-pensions-scheme-15...
letter-from-the-chair-to-the-fca-relating-to-british-steel-pensions-scheme-15...Henry Tapper
 
Call Girls Near Delhi Pride Hotel, New Delhi|9873777170
Call Girls Near Delhi Pride Hotel, New Delhi|9873777170Call Girls Near Delhi Pride Hotel, New Delhi|9873777170
Call Girls Near Delhi Pride Hotel, New Delhi|9873777170Sonam Pathan
 
Overview of Inkel Unlisted Shares Price.
Overview of Inkel Unlisted Shares Price.Overview of Inkel Unlisted Shares Price.
Overview of Inkel Unlisted Shares Price.Precize Formely Leadoff
 
Kempen ' UK DB Endgame Paper Apr 24 final3.pdf
Kempen ' UK DB Endgame Paper Apr 24 final3.pdfKempen ' UK DB Endgame Paper Apr 24 final3.pdf
Kempen ' UK DB Endgame Paper Apr 24 final3.pdfHenry Tapper
 
House of Commons ; CDC schemes overview document
House of Commons ; CDC schemes overview documentHouse of Commons ; CDC schemes overview document
House of Commons ; CDC schemes overview documentHenry Tapper
 
NO1 Certified kala jadu karne wale ka contact number kala jadu karne wale bab...
NO1 Certified kala jadu karne wale ka contact number kala jadu karne wale bab...NO1 Certified kala jadu karne wale ka contact number kala jadu karne wale bab...
NO1 Certified kala jadu karne wale ka contact number kala jadu karne wale bab...Amil baba
 
2024 Q1 Crypto Industry Report | CoinGecko
2024 Q1 Crypto Industry Report | CoinGecko2024 Q1 Crypto Industry Report | CoinGecko
2024 Q1 Crypto Industry Report | CoinGeckoCoinGecko
 
Role of Information and technology in banking and finance .pptx
Role of Information and technology in banking and finance .pptxRole of Information and technology in banking and finance .pptx
Role of Information and technology in banking and finance .pptxNarayaniTripathi2
 
fca-bsps-decision-letter-redacted (1).pdf
fca-bsps-decision-letter-redacted (1).pdffca-bsps-decision-letter-redacted (1).pdf
fca-bsps-decision-letter-redacted (1).pdfHenry Tapper
 
Economics, Commerce and Trade Management: An International Journal (ECTIJ)
Economics, Commerce and Trade Management: An International Journal (ECTIJ)Economics, Commerce and Trade Management: An International Journal (ECTIJ)
Economics, Commerce and Trade Management: An International Journal (ECTIJ)ECTIJ
 
Amil Baba In Pakistan amil baba in Lahore amil baba in Islamabad amil baba in...
Amil Baba In Pakistan amil baba in Lahore amil baba in Islamabad amil baba in...Amil Baba In Pakistan amil baba in Lahore amil baba in Islamabad amil baba in...
Amil Baba In Pakistan amil baba in Lahore amil baba in Islamabad amil baba in...amilabibi1
 
《加拿大本地办假证-寻找办理Dalhousie毕业证和达尔豪斯大学毕业证书的中介代理》
《加拿大本地办假证-寻找办理Dalhousie毕业证和达尔豪斯大学毕业证书的中介代理》《加拿大本地办假证-寻找办理Dalhousie毕业证和达尔豪斯大学毕业证书的中介代理》
《加拿大本地办假证-寻找办理Dalhousie毕业证和达尔豪斯大学毕业证书的中介代理》rnrncn29
 
Stock Market Brief Deck for "this does not happen often".pdf
Stock Market Brief Deck for "this does not happen often".pdfStock Market Brief Deck for "this does not happen often".pdf
Stock Market Brief Deck for "this does not happen often".pdfMichael Silva
 
NO1 WorldWide Love marriage specialist baba ji Amil Baba Kala ilam powerful v...
NO1 WorldWide Love marriage specialist baba ji Amil Baba Kala ilam powerful v...NO1 WorldWide Love marriage specialist baba ji Amil Baba Kala ilam powerful v...
NO1 WorldWide Love marriage specialist baba ji Amil Baba Kala ilam powerful v...Amil baba
 
PMFBY , Pradhan Mantri Fasal bima yojna
PMFBY , Pradhan Mantri  Fasal bima yojnaPMFBY , Pradhan Mantri  Fasal bima yojna
PMFBY , Pradhan Mantri Fasal bima yojnaDharmendra Kumar
 
Tenets of Physiocracy History of Economic
Tenets of Physiocracy History of EconomicTenets of Physiocracy History of Economic
Tenets of Physiocracy History of Economiccinemoviesu
 

Recently uploaded (20)

government_intervention_in_business_ownership[1].pdf
government_intervention_in_business_ownership[1].pdfgovernment_intervention_in_business_ownership[1].pdf
government_intervention_in_business_ownership[1].pdf
 
(办理原版一样)QUT毕业证昆士兰科技大学毕业证学位证留信学历认证成绩单补办
(办理原版一样)QUT毕业证昆士兰科技大学毕业证学位证留信学历认证成绩单补办(办理原版一样)QUT毕业证昆士兰科技大学毕业证学位证留信学历认证成绩单补办
(办理原版一样)QUT毕业证昆士兰科技大学毕业证学位证留信学历认证成绩单补办
 
letter-from-the-chair-to-the-fca-relating-to-british-steel-pensions-scheme-15...
letter-from-the-chair-to-the-fca-relating-to-british-steel-pensions-scheme-15...letter-from-the-chair-to-the-fca-relating-to-british-steel-pensions-scheme-15...
letter-from-the-chair-to-the-fca-relating-to-british-steel-pensions-scheme-15...
 
Call Girls Near Delhi Pride Hotel, New Delhi|9873777170
Call Girls Near Delhi Pride Hotel, New Delhi|9873777170Call Girls Near Delhi Pride Hotel, New Delhi|9873777170
Call Girls Near Delhi Pride Hotel, New Delhi|9873777170
 
Overview of Inkel Unlisted Shares Price.
Overview of Inkel Unlisted Shares Price.Overview of Inkel Unlisted Shares Price.
Overview of Inkel Unlisted Shares Price.
 
Kempen ' UK DB Endgame Paper Apr 24 final3.pdf
Kempen ' UK DB Endgame Paper Apr 24 final3.pdfKempen ' UK DB Endgame Paper Apr 24 final3.pdf
Kempen ' UK DB Endgame Paper Apr 24 final3.pdf
 
House of Commons ; CDC schemes overview document
House of Commons ; CDC schemes overview documentHouse of Commons ; CDC schemes overview document
House of Commons ; CDC schemes overview document
 
NO1 Certified kala jadu karne wale ka contact number kala jadu karne wale bab...
NO1 Certified kala jadu karne wale ka contact number kala jadu karne wale bab...NO1 Certified kala jadu karne wale ka contact number kala jadu karne wale bab...
NO1 Certified kala jadu karne wale ka contact number kala jadu karne wale bab...
 
Monthly Economic Monitoring of Ukraine No 231, April 2024
Monthly Economic Monitoring of Ukraine No 231, April 2024Monthly Economic Monitoring of Ukraine No 231, April 2024
Monthly Economic Monitoring of Ukraine No 231, April 2024
 
2024 Q1 Crypto Industry Report | CoinGecko
2024 Q1 Crypto Industry Report | CoinGecko2024 Q1 Crypto Industry Report | CoinGecko
2024 Q1 Crypto Industry Report | CoinGecko
 
Role of Information and technology in banking and finance .pptx
Role of Information and technology in banking and finance .pptxRole of Information and technology in banking and finance .pptx
Role of Information and technology in banking and finance .pptx
 
fca-bsps-decision-letter-redacted (1).pdf
fca-bsps-decision-letter-redacted (1).pdffca-bsps-decision-letter-redacted (1).pdf
fca-bsps-decision-letter-redacted (1).pdf
 
Economics, Commerce and Trade Management: An International Journal (ECTIJ)
Economics, Commerce and Trade Management: An International Journal (ECTIJ)Economics, Commerce and Trade Management: An International Journal (ECTIJ)
Economics, Commerce and Trade Management: An International Journal (ECTIJ)
 
🔝+919953056974 🔝young Delhi Escort service Pusa Road
🔝+919953056974 🔝young Delhi Escort service Pusa Road🔝+919953056974 🔝young Delhi Escort service Pusa Road
🔝+919953056974 🔝young Delhi Escort service Pusa Road
 
Amil Baba In Pakistan amil baba in Lahore amil baba in Islamabad amil baba in...
Amil Baba In Pakistan amil baba in Lahore amil baba in Islamabad amil baba in...Amil Baba In Pakistan amil baba in Lahore amil baba in Islamabad amil baba in...
Amil Baba In Pakistan amil baba in Lahore amil baba in Islamabad amil baba in...
 
《加拿大本地办假证-寻找办理Dalhousie毕业证和达尔豪斯大学毕业证书的中介代理》
《加拿大本地办假证-寻找办理Dalhousie毕业证和达尔豪斯大学毕业证书的中介代理》《加拿大本地办假证-寻找办理Dalhousie毕业证和达尔豪斯大学毕业证书的中介代理》
《加拿大本地办假证-寻找办理Dalhousie毕业证和达尔豪斯大学毕业证书的中介代理》
 
Stock Market Brief Deck for "this does not happen often".pdf
Stock Market Brief Deck for "this does not happen often".pdfStock Market Brief Deck for "this does not happen often".pdf
Stock Market Brief Deck for "this does not happen often".pdf
 
NO1 WorldWide Love marriage specialist baba ji Amil Baba Kala ilam powerful v...
NO1 WorldWide Love marriage specialist baba ji Amil Baba Kala ilam powerful v...NO1 WorldWide Love marriage specialist baba ji Amil Baba Kala ilam powerful v...
NO1 WorldWide Love marriage specialist baba ji Amil Baba Kala ilam powerful v...
 
PMFBY , Pradhan Mantri Fasal bima yojna
PMFBY , Pradhan Mantri  Fasal bima yojnaPMFBY , Pradhan Mantri  Fasal bima yojna
PMFBY , Pradhan Mantri Fasal bima yojna
 
Tenets of Physiocracy History of Economic
Tenets of Physiocracy History of EconomicTenets of Physiocracy History of Economic
Tenets of Physiocracy History of Economic
 

KBank Econ update jan 2012

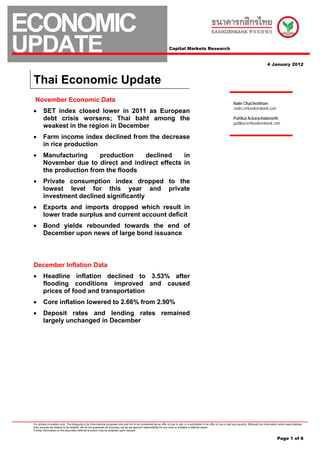
  • 1. ECONOMIC UPDATE Capital Markets Research 4 January 2012 Thai Economic Update November Economic Data Nalin Chutchotitham nalin.c@kasikornbank.com • SET index closed lower in 2011 as European debt crisis worsens; Thai baht among the Puttikul Ackarachalanonth puttikul.a@kasikornbank.com weakest in the region in December • Farm income index declined from the decrease in rice production • Manufacturing production declined in November due to direct and indirect effects in the production from the floods • Private consumption index dropped to the lowest level for this year and private investment declined significantly • Exports and imports dropped which result in lower trade surplus and current account deficit • Bond yields rebounded towards the end of December upon news of large bond issuance December Inflation Data • Headline inflation declined to 3.53% after flooding conditions improved and caused prices of food and transportation • Core inflation lowered to 2.66% from 2.90% • Deposit rates and lending rates remained largely unchanged in December For private circulation only. The foregoing is for informational purposes only and not to be considered as an offer to buy or sell, or a solicitation of an offer to buy or sell any security. Although the information herein was obtained from sources we believe to be reliable, we do not guarantee its accuracy nor do we assume responsibility for any error or mistake contained herein. Further information on the securities referred to herein may be obtained upon request. Page 1 of 6
  • 2. Economic Update Monthly Economic Data SET index closed lower in 2011 as European of expectation that China would continue its stronger- debt crisis worsens; Thai baht among the yuan policy to boost domestic demand and yuan’s flexibility and usage in the financial markets. At the same weakest in the region in December time, Thai baht was deemed less attractive due to the floods (affecting foreign investments and exports growth) 1200 as well as the decline in policy rate. Meanwhile, imports 1107.36 1144.14 1100 of gold (after gold price hit several months’ low in 1025.32 December) by local investors also played a part in driving 1000 the Thai baht weaker. 900 855.45 800 2000 72 737.28 73 700 1900 74 600 1800 75 Jan-10 May-10 Sep-10 Jan-11 May-11 Sep-11 76 1700 77 SET Index 78 1600 79 SET index saw much volatility in the year 2011 compared 80 1500 to the year 2012, mainly due to uncertainties in the global 81 financial markets and doubts about the continuity of 1400 82 Jun-11 Aug-11 Oct-11 Dec-11 global economic growth. The index closed at 1032.76 in the year 2010 and 1025.32 in the year 2011. A major Gold ($/ounce, LHS) Dollar Index (RHS, inverted) slump was observed in September-October period when the risk of the euro-zone breaking up was escalating and Farm income index declined from the European leaders lacked a credible plan to ameliorate decrease in rice production the situation. In any case, SET index found support from local investors from the tax-saving LTF and RMF Agricultural production decreased by 7.2% YoY due to purchases towards year-end. decrease in rice production that was damaged by the $ mn Foreign net buy in SET (year-to-date, $ mn) flooding. Meanwhile, rubber and oil palm production 2000 continued to increase from the expansion of the planting 1500 areas. In November, farm income dropped by 8.6% YoY 1000 with 1.5% decline in agricultural price. Agricultural price 500 mainly declined as rubber price decline from the concern in global economy slowdown, production of several 0 automobile manufacturers’ disruption from the floods and -500 increase in global supply. -1000 -1500 Jan-11 Mar-11 May-11 Jul-11 Sep-11 Nov-11 Manufacturing production declined in November due to direct and indirect effects in The degree of volatility in the SET index can be observed the production from the floods from the foreign net-buying value as well. Throughout the % yoy % year, year-to-date net-buying value had swung from a 40 70 low of – USD1,229mn to a high of USD 1,082mn. At 30 20 65 year-end, foreign investors had sold USD167mn of local 10 60 stocks, compared to the net-buy position of USD2,687mn 0 as of end-2010. -10 55 -20 -30 50 -40 45 JPY 1.5% Change against USD, 1 month, -50 CNY 1.1% -60 40 as of end 4th Jan 2012 MYR -0.1% Jan-07 Jul-07 Jan-08 Jul-08 Jan-09 Jul-09 Jan-10 Jul-10 Jan-11 Jul-11 TWD -0.4% Manufacturing production index ISIC (%yoy, left) Capacity Utilization (%, right) SGD -0.6% IDR -1.2% PHP -1.3% Production continued to drop in most of the sectors as KRW -1.6% the manufacturing plants temporarily shutdown due to THB -2.4% direct and indirect effects (supply chain disruotpion) from INR -2.9% the flooding situation. Manufacturing Production Index -4.0% -3.0% -2.0% -1.0% 0.0% 1.0% 2.0% (MPI) dropped by 48.6% YoY. The most affected industries were vehicles (-84% YoY), hard disk drive (- 81.6% YoY) and integrated circuit (-75.5% YoY). The performance of Thai baht was one of the weakest in Following the declining MPI, capacity utilization in the region for the month of December. Notably, Asian November declined from October to 40.1. currencies were mostly weakening against the U.S. dollar as investors sought refuge in the traditional safe haven assets, including the dollar and the yen. Only the Chinese yuan managed to continue gaining on the back For private circulation only. The foregoing is for informational purposes only and not to be considered as an offer to buy or sell, or a solicitation of an offer to buy or sell any security. Although the information herein was obtained from sources we believe to be reliable, we do not guarantee its accuracy nor do we assume responsibility for any error or mistake contained herein. Further information on the securities referred to herein may be obtained upon request. Page 2 of 6
  • 3. Economic Update Private consumption index dropped to the Exports and imports dropped, resulting in a lowest level for this year and private lower trade surplus and a current account investment declined significantly deficit % YoY Index % yoy 10 150 80 8 145 60 6 140 135 40 4 130 20 2 125 0 0 120 -2 115 -20 -4 110 -40 -6 105 -8 100 -60 Jan-07 Jan-08 Jan-09 Jan-10 Jan-11 Jan-08 Jul-08 Jan-09 Jul-09 Jan-10 Jul-10 Jan-11 Jul-11 PCI Growth (left axis) Private Consumtption Index (sa, right axis) Exports Imports Private Consumption Index (PCI) decreased from 135.8 Export value dropped by 13.1% YoY in November, in October to 135.1 in November, especially from the amounting to USD15.3bn. This was the lowest export contraction in the indicator for domestic automobile sales value since July 2010 due to manufacturing production and VAT. A decline in domestic automobile sales was contraction. Moreover, exports of computer and due to the shortage of the supplies in the car production integrated circuit dropped on the back of the slowdown in while VAT declined from the reduced consumption in global economy, especially in the U.S. and the euro area. products and services. Compared to the same period last year, PCI decreased 1.6% and decreased 0.5% from the Import value dropped by 1.9% YoY in November, previous month. amounting to USD15bn. This resulted from the decline in the electronic component, raw material used in the PII PCI chemical and plastic industries as well as the decrease in 180 150 electrical machinery imports due to the shrinkage in the 170 145 production sector. 160 150 140 US$, mn 140 135 6000 130 130 5000 120 4000 110 125 3000 100 120 2000 Jan-07 Jan-08 Jan-09 Jan-10 Jan-11 1000 0 Private Investment Index (sa, left axis) Private Consumtption Index (sa, right axis) -1000 -2000 -3000 The investment side showed the same picture. Private Sep-10 Dec-10 Mar-11 Jun-11 Sep-11 Investment Index (PII) decreased from 198.9 in October to 186.4 in November from the shrinkage in the Trade balance Services and transfers Balance of Payments production sector. Imports of capital goods declined in almost all product categories and commercial car sales This resulted in the reduction in the trade balance. Trade dropped from temporary shutdown of the automobile balance in November was only USD218m, compared to industry. the trade surplus of USD1.01bn in October. Income and service account registered a deficit at USD355m even 50 = neutral Thai Business Sentiment Indices though there was an increase in the transfer receipt from 60 foreign insurance companies to the local insurers 55 regarding to the flood damage. This, together with the 50 lower trade surplus, resulted in the current account deficit of USD136m. Capital and financial account in November 45 reported a deficit of USD1.38bn, mainly from the 40 repayment of short-term loan of the commercial banks. 35 Balance of Payment in November registered a deficit of 30 USD1.5 resulting in the forth month of the deficit Jul-07 Jul-08 Jul-09 Jul-10 Jul-11 continually. BSI BSI 3m forward expectations Foreign tourist arrival was 1.2 million people, decreased by 17.5% yoy This was due to the decline of foreign Business Sentiment Index (BSI) in November increased tourist arrival in almost all of the countries – especially from 36.7 in October (the lowest level since early 2009) from ASEAN, China, India and Japan. The seasonally- to 39.0 in November. However, BSI in November was still adjusted foreign tourist arrival in November dropped lower than September’s level of 48.5. The indicator for 21.3% from October’s level due to the trip cancellations next 3 months’ outlook surveyed in November was 54.4, when many parts of Bangkok were flooded. However, higher than 42.9 in October survey. hotel occupancy rate did not shrink, mainly because of temporary residential evacuation from flooded areas which offset the reduction in hotel occupancy from the decline in foreign tourist arrival. For private circulation only. The foregoing is for informational purposes only and not to be considered as an offer to buy or sell, or a solicitation of an offer to buy or sell any security. Although the information herein was obtained from sources we believe to be reliable, we do not guarantee its accuracy nor do we assume responsibility for any error or mistake contained herein. Further information on the securities referred to herein may be obtained upon request. Page 3 of 6
  • 4. Economic Update % Government bond yield curve 2,000 75 3.50 70 1,800 3.40 65 1,600 60 3.30 55 3.20 1,400 50 3.10 1,200 45 3.00 40 1,000 2.90 35 800 30 2.80 Jan-08 Jul-08 Jan-09 Jul-09 Jan-10 Jul-10 Jan-11 Jul-11 6m 1y 2y 3y 4y 5y 6y 7y 8y 9y 10y Tourist arrival ('000 left axis) Hotel occupany rate (right axis) 30-Dec-11 20-Dec-11 30-Nov-11 TTM The market has priced in a larger bond supply in Q1 – THB108bn is announced during the last week of the year Inflation rate declined significantly in while the Finance Ministry also said that another December after flooding conditions improved THB53.5bn of supply would likely be added once the Headline consumer price index (CPI) declined by 0.48% FY2012 budget bill becomes law in February. This is mom in December, indicating that price pressure has much larger than issuance during the past few quarters, eased more than expected and the headline inflation rate even if we skip the Oct-Dec 2011 period where issuance is down to 3.53% from 4.19% in November. For the year was merely THB32bn. At the same time, investors are 2011, inflation rate averaged at 3.81%, in line with the also aware that issuance during the second half of fiscal forecast of the Ministry of Commerce. year is not any less. Taking into consideration the planned issuance of THB540bn of government bonds % Headline CPI mom Headline CPI yoy 5.0 (LBs and FRBs only, not including saving bonds) in total 4.5 for the year, we are likely to be left with THB320bn of 4.0 issuance in Q3 and Q4. Despite the high level of liquidity, 3.5 3.0 it is likely that the yield curve would continue to steepen 2.5 going forward. The issuance of LB540bn of government 2.0 1.4 1.5 bonds do take into consideration THB400bn of planned 1.0 0.5 0.4 0.5 0.3 0.1 0.2 0.4 budget deficit and about THB340bn of debt restructuring, 0.5 0.2 0.2 0.0 0.2 0.2 0.2 0.2 0.0 but had not taken into consideration the cabinet’s plan to -0.5 -0.1 borrow an additional THB200bn via an emergency -0.3 -0.5 -1.0 decree (not finalized so far). In any case, government Jul-10 Oct-10 Jan-11 Apr-11 Jul-11 Oct-11 funding needs is likely to be hefty for the year and the market may not like it much although the room for There were several conditions at play in December. First government’s borrowing over the long-run remains of the all, retail oil prices had declined in line with the fall substantial, with the public debt to GDP ratio standing at of world crude oil prices. Meanwhile, flooding conditions 41.03 as of end October. in Thailand had ameliorated and supply of necessary goods and food began to return to normal. Transportation Deposit and lending rates stayed unchanged costs had also reduced due to the above reasons. while growth of loans and deposits slowed Notably, the CPI for raw food and energy items declined down by 1.94% mom in December while the CPI for food and beverages fell by 1.20%. % 4.5 Meanwhile, the core inflation rate (excluding raw food 4.0 and energy items) was at 2.66% in December, a 3.5 deceleration from November’s level at 2.90%. For the whole year, core inflation rate averaged at 2.36%. 3.0 2.5 Bond yields rebounded towards the end of 2.0 1.5 December upon news of large bond issuance 1.0 Jan-11 Mar-11 May-11 Jul-11 Sep-11 Nov-11 In December, bond yields declined by 5-13bp across the Repo rate 12m deposit rate MLR - 4% curve when compared to their levels as of end- November. The fall in 4-year yield was as much as 31bp The 4 large banks’ average 1-year time deposit rate and during mid-month as global markets turned to safer minimum lending rate (MLR) remained unchanged in assets such as bonds and the local market was December at 2.74% and 7.25%, respectively. This was expecting low levels of bond issuance in the coming despite of the 25bp rate cut by the BoT on November quarter due to the delay in the FY2012 budget bill. Yet, th 30 . towards the end of the month, yields rebounded and the yield curve steepened somewhat, driving the 2-10 spread Commercial banks had to keep their deposit rates to 24bp from 21bp as of end-November. competitive with the state-own banks. Due to the upcoming government’s projects and increased financing needs for reconstruction efforts, state-own banks had been offering attractive returns for depositors in order to amass sufficient funds. As for lending rates, they had to For private circulation only. The foregoing is for informational purposes only and not to be considered as an offer to buy or sell, or a solicitation of an offer to buy or sell any security. Although the information herein was obtained from sources we believe to be reliable, we do not guarantee its accuracy nor do we assume responsibility for any error or mistake contained herein. Further information on the securities referred to herein may be obtained upon request. Page 4 of 6
  • 5. Economic Update be kept high on increased credit risks (due to poorer economic outlook) and the unchanged deposit rates as well. In any case, there is a high chance that both deposit and lending rates would fall should the policy rate be reduced to 3.00% (according to our forecast) as of end- January. % yoy 14 12 10 8 6 4 2 0 -2 Jan-07 Jul-07 Jan-08 Jul-08 Jan-09 Jul-09 Jan-10 Jul-10 Private credit Private deposits M2 Private credit growth moderated to 16.0%yoy in November from 17%yoy in the previous month. Meanwhile, deposit growth remained strong but slowed down to 10.3% yoy from 11.3%. For private circulation only. The foregoing is for informational purposes only and not to be considered as an offer to buy or sell, or a solicitation of an offer to buy or sell any security. Although the information herein was obtained from sources we believe to be reliable, we do not guarantee its accuracy nor do we assume responsibility for any error or mistake contained herein. Further information on the securities referred to herein may be obtained upon request. Page 5 of 6
  • 6. Economic Update Bank of Thailand Data Table 2011 May-11 Jun-11 Jul-11 Aug-11 Sep-11 Oct-11 Nov-11 The Real Sector (%yoy , unless specified otherwise) Manufacturing Production Index, seasonally adjusted (level) 182.9 193.9 185.7 196.1 188.2 132.8 99.2 Manufacturing Production Index, without seasonal adjustment (level) 178.1 201.6 188.9 196.1 200.8 133.7 97.9 Manufacturing Production Index, without seasonal adjustment -3.7 3.8 -0.7 6.8 -0.3 -30.1 -48.6 Industrial Capacity Utilization (%) 58.8 64.1 63.1 65.0 65.5 46.4 40.1 Private Consumption Indicators (%yoy) Retail Sales (at 2002 prices) 6.1 6.1 6.1 13.5 11.3 -3.0 n.a. Passenger Car Sales (units) -15.2 -0.5 12.2 26.4 29.4 -38.8 -62.1 Motorcycle Sales (units) 14.7 22.9 0.4 26.1 16.4 -14.1 -22.4 Imports of Consumer Goods (at 2000 prices) 14.4 4.2 9.5 17.1 15.7 2.7 0.2 Private Investment Indicators Commercial Car Sales (units) -6.2 -0.3 10.1 15.7 25.7 -41.8 -71.5 Imports of Capital Goods (at 2000 prices) 9.2 8.9 10.4 17.0 5.5 1.3 -5.2 Cement Sales (tons) -3.2 3.7 6.6 11.8 11.4 10.2 -2.2 Government Cash Balance (billions of baht) 13.9 178.7 -38.6 -9.8 95.6 -64.9 -28.6 Consumer Price Index 4.19 4.06 4.08 4.29 4.03 4.19 4.19 Food 8.38 7.76 7.17 8.43 8.84 9.86 10.21 Non-Food 1.69 1.81 2.21 1.77 1.07 0.75 0.54 Core Inflation (excluding raw food and energy) 2.48 2.55 2.59 2.85 2.92 2.89 2.90 External Accounts (Millions of US$, unless specified otherwise) Exports 19,284 20,384 21,098 20,940 21,259 17,019 15,287 ( % yoy) 17.3 14.0 36.4 28.4 18.4 -0.1 -13.1 Imports 17,098 17,017 16,546 20,235 18,840 16,006 15,068 ( % yoy) 34.5 23.6 13.2 45.9 42.6 20.6 -1.9 Trade Balance 2,186 3,366 4,552 705 2,419 1,013 218 Current Account Balance -656 1,969 3,438 -697 404 39 -136 Capital Account -65 0 0 -40 34 0 0 Financial Account -294 -2,304 -2,496 161 317 -1,459 -1,381 - Monetary authority (central bank) -2,048 -448 2,316 -1,451 -755 -307 -392 - Government 236 23 873 922 6 67 165 - Other depository corporations (banks) 1,534 -178 -5,708 883 3,866 -4,103 -3,653 - Others -16 -1,700 23 -193 -2,800 2,884 2,498 Balance of Payments -2,600 -972 541 -556 -1,674 -1,886 -1,506 Official Reserves (billions of US$) 185.5 184.9 187.6 188.3 180.1 182.0 178.3 Monetary Statistics (End of period) (Billions of baht) Monetary Base 1,193.5 1,223.4 1,206.8 1,219.2 1,229.5 1,311.0 1,259.8 ( % yoy) 9.6 14.1 13.1 16.6 10.0 22.3 13.5 Narrow Money (M1) 1,395.8 1,336.6 1,336.3 1,345.1 1,328.0 1,362.7 1,363.5 ( % yoy) 10.6 13.3 13.9 13.9 13.0 13.3 10.4 Broad Money (M2) 12,577.2 12,614.4 12,799.4 12,875.3 12,913.9 13,152.9 13,325.0 ( % yoy) 14.3 16.3 17.6 17.4 16.2 16.2 15.9 Other Depository Corporations Deposits 11,092.8 10,993.2 11,077.8 11,153.5 11,082.1 11,364.3 11,455.0 ( % yoy) 8.4 10.1 11.1 11.4 9.8 11.3 10.3 Other Depository Corporations Private Credits 10,517.7 10,679.1 10,718.9 10,899.7 11,079.9 11,209.6 11,308.7 ( % yoy) 15.6 16.1 16.3 17.2 17.5 17.0 16.0 Interest Rates (% p.a.) Repurchase Rate, 1 day (closing rate daily average) 2.75 3.00 3.16 3.32 3.50 3.50 3.49 Overnight Interbank Rate (mode daily average) 2.62 2.90 3.06 3.22 3.40 3.41 3.39 Fixed Deposit Rate (1 year) 2.00-2.30 2.20-2.50 2.45-2.75 2.45-3.00 2.70-3.00 2.70-3.00 2.70-3.00 Prime Rate (MLR) 6.75-7.13 6.87-7.25 7.12-7.50 7.12-7.50 7.25-7.625 7.25-7.625 7.25-7.625 Exchange Rate (Baht : US$) 30.25 30.52 30.07 29.87 30.42 30.86 30.95 Source: Bank of Thailand For private circulation only. The foregoing is for informational purposes only and not to be considered as an offer to buy or sell, or a solicitation of an offer to buy or sell any security. Although the information herein was obtained from sources we believe to be reliable, we do not guarantee its accuracy nor do we assume responsibility for any error or mistake contained herein. Further information on the securities referred to herein may be obtained upon request. Page 6 of 6