Keynote technicals commodity intraday levels for 220213
•
0 recomendaciones•570 vistas

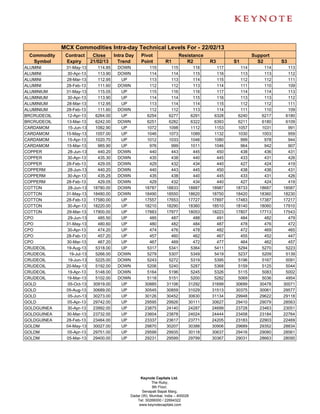
This document provides the intra-day technical levels for various commodities trading on the MCX commodity exchange in India on February 22, 2013. It lists the commodity, contract expiry date, previous day's close, intra-day trend, pivot point, and resistance and support levels for each commodity. The commodities include metals like aluminum, copper and gold as well as agricultural commodities like cardamom, cotton and potatoes.

Recomendados
Recomendados
Más contenido relacionado
La actualidad más candente
La actualidad más candente (20)
Destacado
Destacado (17)
Similar a Keynote technicals commodity intraday levels for 220213
Similar a Keynote technicals commodity intraday levels for 220213 (10)
Más de Keynote Capitals Ltd.
Más de Keynote Capitals Ltd. (20)
Keynote technicals commodity intraday levels for 220213
- 1. MCX Commodities Intra-day Technical Levels For - 22/02/13 Commodity Contract Close Intra Day Pivot Resistance Support Symbol Expiry 21/02/13 Trend Point R1 R2 R3 S1 S2 S3 ALUMINI 31-May-13 114.85 DOWN 115 115 116 117 114 114 113 ALUMINI 30-Apr-13 113.90 DOWN 114 114 115 116 113 113 112 ALUMINI 28-Mar-13 112.95 UP 113 113 114 115 112 112 111 ALUMINI 28-Feb-13 111.60 DOWN 112 112 113 114 111 110 109 ALUMINIUM 31-May-13 115.05 UP 115 116 116 117 114 114 113 ALUMINIUM 30-Apr-13 113.90 UP 114 114 115 116 113 113 112 ALUMINIUM 28-Mar-13 112.95 UP 113 114 114 115 112 112 111 ALUMINIUM 28-Feb-13 111.60 DOWN 112 112 113 114 111 110 109 BRCRUDEOIL 12-Apr-13 6264.00 UP 6254 6277 6291 6328 6240 6217 6180 BRCRUDEOIL 13-Mar-13 6242.00 DOWN 6251 6282 6322 6393 6211 6180 6109 CARDAMOM 15-Jun-13 1082.90 UP 1072 1098 1112 1153 1057 1031 991 CARDAMOM 15-May-13 1057.00 UP 1046 1073 1089 1132 1030 1003 959 CARDAMOM 15-Apr-13 1020.70 UP 1012 1033 1046 1080 999 978 944 CARDAMOM 15-Mar-13 985.90 UP 976 999 1011 1046 964 942 907 COPPER 28-Jun-13 440.20 DOWN 440 443 445 450 438 436 431 COPPER 30-Apr-13 435.30 DOWN 435 438 440 445 433 431 426 COPPER 28-Feb-13 429.05 DOWN 429 432 434 440 427 424 419 COPPERM 28-Jun-13 440.20 DOWN 440 443 445 450 438 436 431 COPPERM 30-Apr-13 435.25 DOWN 435 438 440 445 433 431 426 COPPERM 28-Feb-13 429.05 DOWN 429 432 434 440 427 424 419 COTTON 28-Jun-13 18780.00 DOWN 18787 18833 18887 18987 18733 18687 18587 COTTON 31-May-13 18480.00 DOWN 18490 18550 18620 18750 18420 18360 18230 COTTON 28-Feb-13 17580.00 UP 17557 17653 17727 17897 17483 17387 17217 COTTON 30-Apr-13 18220.00 UP 18210 18290 18360 18510 18140 18060 17910 COTTON 29-Mar-13 17900.00 UP 17883 17977 18053 18223 17807 17713 17543 CPO 29-Jun-13 485.50 UP 485 487 488 491 484 482 479 CPO 31-May-13 480.60 UP 480 482 484 487 478 476 472 CPO 30-Apr-13 474.20 UP 474 476 478 482 472 469 465 CPO 28-Feb-13 457.20 UP 457 460 462 467 455 452 447 CPO 30-Mar-13 467.20 UP 467 469 472 477 464 462 457 CRUDEOIL 19-Aug-13 5318.00 UP 5317 5341 5364 5411 5294 5270 5223 CRUDEOIL 19-Jul-13 5266.00 DOWN 5279 5307 5349 5419 5237 5209 5139 CRUDEOIL 19-Jun-13 5225.00 DOWN 5243 5272 5319 5395 5196 5167 5091 CRUDEOIL 20-May-13 5192.00 DOWN 5206 5240 5287 5368 5159 5125 5044 CRUDEOIL 19-Apr-13 5148.00 DOWN 5164 5196 5245 5326 5115 5083 5002 CRUDEOIL 19-Mar-13 5102.00 DOWN 5118 5151 5200 5282 5069 5036 4954 GOLD 05-Oct-13 30919.00 UP 30885 31106 31292 31699 30699 30478 30071 GOLD 05-Aug-13 30689.00 UP 30545 30859 31029 31513 30375 30061 29577 GOLD 05-Jun-13 30273.00 UP 30126 30452 30630 31134 29948 29622 29118 GOLD 05-Apr-13 29742.00 UP 29595 29926 30111 30627 29410 29079 28563 GOLDGUINEA 30-Apr-13 23992.00 UP 23875 24140 24287 24699 23728 23463 23051 GOLDGUINEA 30-Mar-13 23732.00 UP 23604 23878 24024 24444 23458 23184 22764 GOLDGUINEA 28-Feb-13 23464.00 UP 23337 23617 23771 24205 23183 22903 22469 GOLDM 04-May-13 30027.00 UP 29870 30207 30388 30906 29689 29352 28834 GOLDM 05-Apr-13 29751.00 UP 29599 29935 30118 30637 29416 29080 28561 GOLDM 05-Mar-13 29400.00 UP 29231 29599 29799 30367 29031 28663 28095 Keynote Capitals Ltd. The Ruby, 9th Floor, Senapati Bapat Marg, Dadar (W), Mumbai, India – 400028 Tel: 30266000 / 22694322 www.keynotecapitals.com
- 2. MCX Commodities Intra-day Technical Levels For - 22/02/13 Commodity Contract Close Intra Day Pivot Resistance Support Symbol Expiry 21/02/13 Trend Point R1 R2 R3 S1 S2 S3 GOLDPETAL 30-Apr-13 2996.00 UP 2980 3016 3035 3090 2961 2925 2870 GOLDPETAL 28-Feb-13 2936.00 UP 2920 2956 2975 3030 2901 2865 2810 GOLDPETAL 30-Mar-13 2966.00 UP 2951 2984 3002 3053 2933 2900 2849 GOLDPTLDEL 30-Apr-13 2994.00 DOWN 3008 3029 3063 3118 2974 2953 2898 GOLDPTLDEL 28-Feb-13 2943.00 UP 2939 2974 3006 3073 2907 2872 2805 GOLDPTLDEL 30-Mar-13 2967.00 UP 2957 3014 3060 3163 2911 2854 2751 KAPAS 30-Mar-13 911.70 UP 907 923 934 960 896 880 853 KAPAS 30-Apr-13 952.30 DOWN 954 960 967 981 946 940 927 KAPASKHALI 29-Jun-13 1452.00 UP 1452 1457 1462 1473 1447 1441 1431 KAPASKHALI 30-Apr-13 1381.50 DOWN 1386 1392 1403 1420 1375 1369 1352 KAPASKHALI 31-May-13 1413.00 DOWN 1415 1419 1425 1436 1409 1404 1394 KAPASKHALI 28-Feb-13 1322.00 DOWN 1326 1332 1342 1358 1316 1310 1294 KAPASKHALI 30-Mar-13 1351.00 DOWN 1355 1361 1371 1387 1345 1339 1323 LEAD 31-May-13 127.60 UP 127 128 129 131 127 126 124 LEAD 30-Apr-13 127.50 UP 127 128 129 131 126 125 123 LEAD 28-Mar-13 127.10 UP 127 128 129 131 126 125 123 LEAD 28-Feb-13 126.40 UP 126 127 128 130 125 124 122 LEADMINI 31-May-13 127.50 UP 127 128 129 131 127 126 124 LEADMINI 30-Apr-13 127.45 UP 127 128 129 131 126 125 123 LEADMINI 28-Mar-13 127.05 UP 127 128 129 131 126 125 123 LEADMINI 28-Feb-13 126.40 UP 126 127 128 131 125 124 122 MENTHAOIL 30-Apr-13 1236.70 UP 1234 1242 1248 1262 1228 1220 1206 MENTHAOIL 31-May-13 1148.20 UP 1145 1153 1159 1173 1139 1131 1117 MENTHAOIL 30-Mar-13 1285.80 DOWN 1289 1302 1318 1347 1273 1260 1231 MENTHAOIL 28-Feb-13 1431.50 UP 1430 1443 1455 1479 1419 1406 1381 NATURALGAS 25-Apr-13 186.60 DOWN 187 189 192 197 184 182 176 NATURALGAS 25-Mar-13 182.10 DOWN 182 186 189 195 179 176 169 NATURALGAS 25-Feb-13 178.50 DOWN 179 182 186 193 175 172 164 NICKEL 31-May-13 932.60 DOWN 933 941 950 967 925 916 900 NICKEL 30-Apr-13 927.40 UP 927 936 944 962 918 909 891 NICKEL 28-Mar-13 920.30 DOWN 920 930 940 960 910 901 881 NICKEL 28-Feb-13 912.90 UP 913 922 932 951 903 893 874 NICKELM 31-May-13 937.40 UP 936 945 952 969 928 919 902 NICKELM 30-Apr-13 926.80 UP 927 936 944 962 918 909 891 NICKELM 28-Mar-13 920.50 UP 920 929 938 956 911 902 884 NICKELM 28-Feb-13 913.00 DOWN 913 923 932 951 904 894 875 POTATO 15-Apr-13 820.50 DOWN 821 824 827 833 818 816 810 POTATO 15-Mar-13 840.70 DOWN 842 844 848 853 838 836 830 POTATO 15-May-13 820.30 DOWN 822 824 828 835 818 815 809 SILVER 05-Jul-13 56747.00 UP 56526 57221 57696 58866 56051 55356 54186 SILVER 04-May-13 55492.00 UP 55244 55948 56404 57564 54788 54084 52924 SILVER 05-Mar-13 54112.00 UP 53824 54572 55031 56238 53365 52617 51410 SILVER1000 30-Mar-13 53501.00 DOWN 53501 53501 53501 53501 53501 53501 53501 SILVER1000 30-Apr-13 54436.00 UP 54213 54924 55413 56613 53724 53013 51813 SILVER1000 28-Feb-13 53498.00 UP 53283 53865 54233 55183 52915 52333 51383 SILVERM 29-Jun-13 56787.00 UP 56531 57256 57726 58921 56061 55336 54141 SILVERM 30-Apr-13 55517.00 UP 55270 55977 56437 57604 54810 54103 52936 SILVERM 28-Feb-13 54127.00 UP 53835 54591 55054 56273 53372 52616 51397 SILVERMIC 29-Jun-13 56785.00 UP 56492 57283 57782 59072 55993 55202 53912 SILVERMIC 30-Apr-13 55527.00 UP 55287 56030 56532 57777 54785 54042 52797 Keynote Capitals Ltd. The Ruby, 9th Floor, Senapati Bapat Marg, Dadar (W), Mumbai, India – 400028 Tel: 30266000 / 22694322 www.keynotecapitals.com
- 3. MCX Commodities Intra-day Technical Levels For - 22/02/13 Commodity Contract Close Intra Day Pivot Resistance Support Symbol Expiry 21/02/13 Trend Point R1 R2 R3 S1 S2 S3 SILVERMIC 28-Feb-13 54128.00 UP 53831 54596 55063 56295 53364 52599 51367 STEELRPR 20-May-13 31950.00 DOWN 31953 32047 32143 32333 31857 31763 31573 STEELRPR 18-Apr-13 31340.00 DOWN 31373 31467 31593 31813 31247 31153 30933 STEELRPR 20-Mar-13 30900.00 DOWN 30920 30990 31080 31240 30830 30760 30600 ZINC 31-May-13 116.40 UP 116 117 118 119 116 115 114 ZINC 30-Apr-13 116.20 UP 116 117 117 119 115 114 113 ZINC 28-Mar-13 115.50 UP 115 116 117 118 115 114 112 ZINC 28-Feb-13 114.70 UP 114 115 116 117 114 113 111 ZINCMINI 31-May-13 116.45 UP 116 117 117 118 116 115 114 ZINCMINI 30-Apr-13 116.10 UP 116 117 117 118 115 115 113 ZINCMINI 28-Mar-13 115.50 UP 115 116 117 118 115 114 112 ZINCMINI 28-Feb-13 114.70 UP 114 115 116 117 114 113 111 Sanjay Bhatia (AVP – Technical Research), Email Id sanjay@keynotecapitals.net Pivot Point: Intra- Day Trading Tool. - The key to the use of this tool is the use of Stop Loss Intra Day Trend: It is valid only till the point where Price trades above Pivot Point. For Eg. “UP” would be valid till Price remains above Pivot Point. It would become “DOWN” in event Price trades below Pivot Point. Pivot Point (PP): This is a trigger point for Intra Day Buy / Sell based on the price range of the previous day. R1: Resistance 1: 1st Resistance level over Pivot Point, R2: Resistance 2: Next Resistance level after R1. R3: Resistance 3: Next Resistance level after R2. S1: Support 1: 1st Support level after Pivot Point, S2: Support 2: Next Support level after S1. S3: Support 3: Next Support level after S2. Note: As per this tool, the trader should take BUY position just above the Pivot Point and keep the Pivot Point level as stop loss and the first target would be R1 level (Resistance 1). If R1 is crossed then R2 (Resistance 2) becomes the next target with the stop loss placed at R1 level. If R2 is crossed then R3 (Resistance 3) becomes the next target with the stop loss placed at R2 level. Similarly if price goes below the Pivot Point the trader should take a SELL position and keep the Pivot Point level as the stop loss and the first target would be S1 level (Support 1). If S1 level is breached then S2 level (Support 2) becomes the next target with the stop loss placed at S1 level. If S2 level is breached then S3 level (Support 3) becomes the next target with the stop loss placed at S2 level. Disclaimer: This document is not for public distribution and has been furnished to you solely for your information and must not be reproduced or redistributed to any other person. Persons into whose possession this document may come are required to observe these restrictions. This material is for the personal information of the authorized recipient, and we are not soliciting any action based upon it. This report is not to be construed as an offer to sell or the solicitation of an offer to buy any security in any jurisdiction where such an offer or solicitation would be illegal. It is for the general information of clients of Keynote Capitals Ltd. It does not constitute a personal recommendation or take into account the particular investment objectives, financial situations, or needs of individual clients. We have reviewed the report, and in so far as it includes current or historical information, it is believed to be reliable though its accuracy or completeness cannot be guaranteed. Neither Keynote Capitals Ltd., nor any person connected with it, accepts any liability arising from the use of this document. The recipients of this material should rely on their own investigations and take their own professional advice. Price and value of the investments referred to in this material may go up or down. Past performance is not a guide for future performance. Certain transactions - including those involving futures, options and other derivatives as well as non-investment grade securities - involve substantial risk and are not suitable for all investors. Reports based on technical analysis centers on studying charts of a stock’s price movement and trading volume, as opposed to focusing on a company’s fundamentals and as such, may not match with a report on a company’s fundamentals. Opinions expressed are our current opinions as of the date appearing on this material only. While we endeavor to update on a reasonable basis the information discussed in this material, there may be regulatory, compliance, or other reasons that prevent us from doing so. Prospective investors and others are cautioned that any forward-looking statements are not predictions and may be subject to change without notice. Our proprietary trading and investment businesses may make investment decisions that are inconsistent with the recommendations expressed herein. We and our affiliates, officers, directors, and employees world wide may: (a) from time to time, have long or short positions in, and buy or sell the securities thereof, of company (ies) mentioned herein or (b) be engaged in any other transaction involving such securities and earn brokerage or other compensation or act as a market maker in the financial instruments of the company (ies) discussed herein or act as advisor or lender / borrower to such company (ies) or have other potential conflict of interest with respect to any recommendation and related information and opinions. The analyst for this report certifies that all of the views expressed in this report accurately reflect his or her personal views about the subject company or companies and its or their securities, and no part of his or her compensation was, is or will be, directly or indirectly related to specific recommendations or views expressed in this report. No part of this material may be duplicated in any form and/or redistributed without Keynote Capitals Ltd’s., prior written consent. Keynote Capitals Ltd. The Ruby, 9th Floor, Senapati Bapat Marg, Dadar (W), Mumbai, India – 400028 Tel: 30266000 / 22694322 www.keynotecapitals.com