

Recomendados
Más contenido relacionado
La actualidad más candente
La actualidad más candente (20)
Similar a Mcx ipo note (keynote capitals)
Similar a Mcx ipo note (keynote capitals) (20)
Más de Keynote Capitals Ltd.
Más de Keynote Capitals Ltd. (20)
Último
Último (20)
Mcx ipo note (keynote capitals)
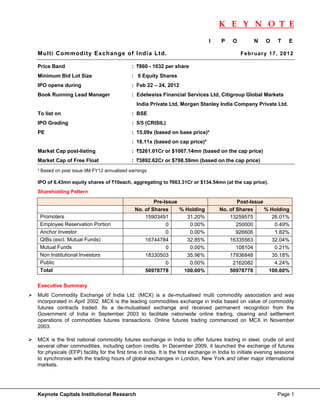
- 1. K E Y N O T E I P O N O T E Multi Commodity Exchange of India Ltd. F e b r ua r y 1 7 , 20 12 Price Band : `860 - 1032 per share Minimum Bid Lot Size : 6 Equity Shares IPO opens during : Feb 22 – 24, 2012 Book Running Lead Manager : Edelweiss Financial Services Ltd, Citigroup Global Markets India Private Ltd, Morgan Stanley India Company Private Ltd. To list on : BSE IPO Grading : 5/5 (CRISIL) PE : 15.09x (based on base price)* : 18.11x (based on cap price)* Market Cap post-listing : `5261.01Cr or $1067.14mn (based on the cap price) Market Cap of Free Float : `3892.62Cr or $798.59mn (based on the cap price) * Based on post issue 9M FY12 annualised earnings IPO of 6.43mn equity shares of `10each, aggregating to `663.31Cr or $134.54mn (at the cap price). Shareholding Pattern Pre-Issue Post-Issue No. of Shares % Holding No. of Shares % Holding Promoters 15903491 31.20% 13259575 26.01% Employee Reservation Portion 0 0.00% 250000 0.49% Anchor Investor 0 0.00% 926606 1.82% QIBs (excl. Mutual Funds) 16744784 32.85% 16335563 32.04% Mutual Funds 0 0.00% 108104 0.21% Non Institutional Investors 18330503 35.96% 17936848 35.18% Public 0 0.00% 2162082 4.24% Total 50978778 100.00% 50978778 100.00% Executive Summary Multi Commodity Exchange of India Ltd. (MCX) is a de-mutualised multi commodity association and was incorporated in April 2002. MCX is the leading commodities exchange in India based on value of commodity futures contracts traded. Its a de-mutualised exchange and received permanent recognition from the Government of India in September 2003 to facilitate nationwide online trading, clearing and settlement operations of commodities futures transactions. Online futures trading commenced on MCX in November 2003. MCX is the first national commodity futures exchange in India to offer futures trading in steel, crude oil and several other commodities, including carbon credits. In December 2009, it launched the exchange of futures for physicals (EFP) facility for the first time in India. It is the first exchange in India to initiate evening sessions to synchronise with the trading hours of global exchanges in London, New York and other major international markets. Keynote Capitals Institutional Research Page 1
- 2. K E Y N O T E The majority of the commodities MCX offer are significant in the Indian and global context and are also traded on international exchanges. As of December 31, 2011, it has offered trading in 49 commodity futures based on contract specifications, from a diverse range of classes including bullion, ferrous and non-ferrous metals, energy and agriculture. MCX was the largest silver exchange, the second largest gold, copper and natural gas exchange and the third largest crude oil exchange, in terms of the number of commodity futures contracts traded for each of these commodities for the calendar year 2010 and the six months ended June 30, 2011 based on the comparison of the trading volumes of MCX with those of the leading global commodity futures exchanges in the world. The total value of commodity futures contracts traded on MCX in the nine months ended December 31, 2011 and the fiscals 2011, 2010 and 2009 was `119,806.89 bn, `98,415.03 bn, `63,933.03 bn and `45,880.95 bn, respectively. On September 23, 2011, MCX recorded the highest daily turnover on the Exchange since its inception, which was `1,116.66 bn. Our View There is no domestic listed peer of MCX but there are international peers. The international peers in the developed market are trading at the PE 17-18x multiple and the EBIDTA margins are in the range of 65-70% whereas the peers in the developing markets are trading at the PE 24-25x multiple and the EBIDTA margins are in the range of 60-65%. Considering the international peers and MCX’s 9MFY12 annualised earnings, the IPO is priced only 18.11x at the capped price of `1032. The company’s 3 year CAGR is more than 30%, however, the future growth may not be at the same pace. We think that the IPO of MCX Ltd. is reasonably price and advise the investor to “Subscribe” for it considering MCX’s fundamental and the potential growth. Company Background Multi Commodity Exchange of India Ltd. (MCX) was incorporated in April 2002 with the name Multi Commodity Exchange of India Private Ltd. MCX is a de-mutualised multi commodity association. The subscribers to the MoA were V. Hariharan and Rinsy Ansalam. Further allotments were made to La-Fin Financial Services Private Ltd., Sajit Dayanandan, Dewang Neralla, Ajay Narsimhan and Manjay Shah in April 2002. Subsequently, in May 2002, the company was converted into a public company and consequently the name was changed to “Multi Commodity Exchange of India Limited”. MCX received permanent recognition from the GoI for facilitating online trading, clearing and settlement operations for commodity futures markets across the country in September 2003. Online futures trading commenced on MCX in November 2003. The company received non-promoter equity participation for the first time in the year 2004 when Bank of India, Union Bank and Corporation Bank invested in the equity shares of MCX. Since then, the company has received equity participation from various banks and financial institutions, including State Bank of India in July 2004, HDFC Bank Ltd. In March 2005, the NSE in May 2005 and NABARD in June 2005. MCX has two subsidiaries namely MCXCCL and SME. Multi Commodity Exchange Clearing Corporation Ltd. (MCXCCL) was incorporated in August 2008 and SME Exchange of India Ltd. (SME) was incorporated in September 2010. MCXCCL is a wholly owned subsidiary of MCX while in SME the company (alongwith its nominees) has subscribed to 51,000 equity shares of SME constituting 51% of its equity share capital. None of the subsidiaries hold any equity shares in MCX neither do they contribute to more than 5% of revenue/profits/assets of the company on a consolidated basis for the fiscal 2011 and nine months period ended December 31, 2011. Keynote Capitals Institutional Research Page 2
- 3. K E Y N O T E Promoter and Manag rs gement Mr.Lambe ertus Rutten is the Mana n aging Director and CEO o MCX. He h been a D of has Director of the company e since Jun 2006. He has more tha 20 years o experience in commod risk mana ne an of e dity agement and structured finance as well as on commodity pri risk mana s c ice agement. Mr.Venka Chary is th Chairman and Non-Exe at he endent Direct of MCX an has been associated ecutive Indepe tor nd company sinc its inceptio in September 2003. He has varied experience a practices law at the with the c ce on e and Bombay H High Court. Mr.Jignes P. Shah is the Vice Chairman and N sh s Non-Executive Non-Indepe e endent Directo of the company since or May 2003 He is also a first-genera 3. ation entrepreeneur and the founder/pro e omoter of the Financial Technologies group (FT of compa TIL) anies. He is c currently the C Chairman and Managing D d Director of FT Prior to e TIL. establishing FTIL, he w with the BSE, where h was respo was he onsible for des signing and im mplementing the technolog platform gy change. He has over 20 years of experience in creating and operating tech of the exc h hnology-centr financial ric exchange for, inter ali stocks, commodities, cu es ia, urrencies and bonds. d Industry Overview Futures c contracts are derivative p e products that provide me t eans for heddging and as sset allocation and are prevalent in nearly all sectors of the global ec conomy. The asset unde e erlying futures contracts c s could be a physical aasset (such as an agricultural comm modity) or a financial ass (such as interest rate foreign set es, exchange products and stock indice A commo e d es). odity (as trade on an exch ed hange) is an undifferentiat product ted whose ma arket value arises from the owner‘s rig to sell the product rath than the r ght her right to use th product. he Examples of commodities currently traded globa on excha s y ally anges include crude oil, go copper a various e old, and agricultura products su as wheat corn and so al uch t, oybeans. Like other futures con ntracts, commmodity futures contracts ar traded in standardized units in a tr s re ransparent, competitiv continuou open floor ve, us r-based trading or electroonic matching process. In this way, c n commodity futures ar able to attr re participation a facilitate price discove An effective and efficient market ract diverse p and ery. for trading in commodit futures requires the follo g ty owing: 1 • Volatility in the price of the unde es erlying commodities. • Large numbers of b n buyers and se ellers with dive erse profiles ( (like hedgers and 2 specula ators) 3 • Fungib bility of the underlying phys sical commod dities. 4 • Efficien and liquid e nt exchange platform. • Robust risk manage ement and surveillance sys stem. 5 The Glob Commodi Futures M bal ity Market There are over 30 com e mmodity futur and options exchanges worldwide t res that trade commmodities ranging from energy, m tock in many countries inc metals, agriculture to livest nited States, China, Japan Malaysia cluding the Un n, and the U United Kingdom. The com mmodity exch hanges trade in physical commodity p e products, as well as in financial instruments. Trading is mo T ostly done in f futures and o options contra ding calls for immediate acts. Spot trad delivery o a specified commodity a is often u of and used to obtain the goods n n necessary to fulfill a seller delivery r‘s obligations under futures contracts According to the FIA R s. Report, strong levels of gr g rowth were s seen in the Keynote Capitals Inst titutional Res search Page 3
- 4. K E Y N O T E trading volume of commodity futures and options, especially those relating to non-precious metals, agricultural, energy and precious metals commodities. The trading volume of futures and options contracts of non-precious metals decreased by 37.7% to 190.37mn for the six months ended June 30, 2011 as compared to the six months ended June 30, 2010, while the trading volume of futures and options contracts of agricultural commodities decreased by 9.1 % to 529.59mn contracts during the same period. The trading volume of futures and options contracts of precious metals rose by 49.8% to 127.49mn contracts between the same period and that of futures and options contracts of energy products rose by 16.0% to 416.24mn contracts for the same period. Industry Growth In 1984, total trading volume for futures and options contracts traded globally was 188.00mn contracts. In 2010, total contract volume had grown to 22,295.20mn, representing an average compounded annual growth rate of 20.2% for the past 26 years. For the six months ended June 30, 2011, total contract volume traded was 12,402.54mn. (Source: FIA, FIA Report). The following table indicates the volume of futures and options contracts in terms of number of contracts traded globally for the periods indicated: Global Futures and Options Volume Contracts Mn Jan- June (2010) Jan- June (2011) % Change Futures 5,699.35 6,098.78 7.0% Options 5,554.28 6,303.76 13.5% Total Volumes 11,253.63 12,402.54 10.2% The following table sets out comparative data for the global futures and options volume traded, by category and region, respectively: Global Futures and Options Volume by Category Computed % Computed % 2011 to 2010 Category (in Mn Jan -June Jan -June Breakup (Jan- Breakup (Jan- (Jan -Jun) % Contracts) 2010 2011 June 2010) June 2011) Change Equity Index 3,652.40 32.50% 4,165.60 33.60% 14.00% Individual Equity 3,321.70 29.50% 3,525.40 28.40% 6.10% Interest Rates 1,659.80 14.70% 1,853.10 14.90% 11.60% Currency 1,239.80 11.00% 1,513.10 12.20% 22.00% Commodities* 1,379.90 12.30% 1,345.40 10.80% -2.50% Total 11,253.60 100.00% 12,402.50 100.00% 10.20% The Indian Commodities Market Commodities play an important role in India‘s economy. India has over 7,000 regulated agricultural markets, or mandis, and the majority of the nation‘s agricultural production is consumed domestically, according to the Agricultural Marketing Information Network (Source: Agricultural Marketing Information Network official website). India is the world‘s leading producer of several agricultural commodities. The agriculture sector accounted for approximately 14.2 % of India‘s gross domestic product (GDP) at a constant price (2004-05) for the fiscal 2011. India‘s GDP at current market prices for the fiscal 2011 was estimated to be `78,779.47bn. There are currently 21 commodity exchanges recognized by FMC in India offering trading in over 60 commodity futures with the approval of FMC. In the fiscals 2009, 2010 and 2011, the total value of commodities traded on commodity futures exchanges in India was `52,489.57bn, `77,647.54bn and Keynote Capitals Institutional Research Page 4
- 5. K E Y N O T E `119,489.42bn, respectively. The total value of commodities traded on commodity futures exchanges in India for the first nine months ended December 31, 2011 was `137,228.55bn. Industry Growth in India Commodity futures trading in India has grown since the Government of India issued a notification on April 1, 2003 permitting futures trading in commodities. The total value of commodities futures traded in India in the fiscal 2011 was `119,489.42bn, representing growth of approximately 90-fold from the value of commodity futures contracts traded in the fiscal 2004, which was `1,293.67bn. Commodity futures trading volumes have risen at a compound annual growth rate of 90.9% between fiscal 2004 and fiscal 2011. There are currently over 60 commodities futures that have been approved by the FMC for trading during the calendar year 2011 with gold, silver, crude oil, copper, zinc, nickel and natural gas comprising the majority of the trading turnover for the fiscal 2011 and the nine months ended December 31, 2011, as depicted in the graph below: Major Commodities Turnover (Fiscal 2011) 1% 1% 2% 2% Others 3% 10% Gold 4% Silver 4% Crude oil Copper 10% 23% Zinc Nickel Natural Gas Guarseed 17% R. Soy Oil Mustard Seed 23% Soybean (Source: Market share data maintained by FMC and MCX.) Business Operations MCX is the leading commodities exchange in India based on value of commodity futures contracts traded. Its a de-mutualised exchange and received permanent recognition from the Government of India in September 2003 to facilitate nationwide online trading, clearing and settlement operations of commodities futures transactions. A majority of the commodities the company offer are significant in the Indian and global context and are also traded on international exchanges. As of December 31, 2011, it has offered trading in 49 commodity futures based on contract specifications, from a diverse range of classes including bullion, ferrous and non-ferrous metals, energy and agriculture. The same underlying physical asset traded under different contract specifications is regarded as a separate commodity future. For example, Gold, Gold Mini and Gold Guinea, all of which are gold futures contracts, are treated as three different commodities in deriving the total number of commodity futures traded on MCX. As of December 31, 2011, it had 2,153 members on its Exchange’s platform, with over 296,000 terminals including CTCL spread over 1,572 cities and towns across India. MCX is the first national commodity futures exchange in India to offer futures trading in steel, crude oil and several other commodities, including carbon credits. In December 2009, it launched the exchange of futures Keynote Capitals Institutional Research Page 5
- 6. K E Y N O T E for physicals (EFP) facility for the first time in India. In May 2010 and June 2010, it launched its Zinc Mini futures and Lead Mini futures contracts, which offer trading in these metals in smaller lot sizes. In January 2011, it also launched Iron Ore future contracts. Additionally, MCX launched Silver Micro and Aluminium Mini contracts in February 2011, Gold Petal contracts in April 2011, Gold Petal New Delhi contracts in November 2011, and Copper Mini and Nickel Mini contracts in December 2011, all of which offer trading in these metals in smaller lot sizes. In October 2011, it also launched Cotton (29mm) futures contracts. MCX is the first exchange in India to initiate evening sessions to synchronise with the trading hours of global exchanges in London, New York and other major international markets. MCX’s operations are sustained by the exchange related support infrastructure and software that it has or sourced from its Promoter, FTIL. The technology infrastructure includes central matching engines, high end Intel servers, channel based storage area network and networking equipment for providing secured connectivity through very small aperture terminals (VSATs), virtual private networks (VPN), leased lines and the internet. MCX is certified under ISO 9001:2008 for quality management standards and ISO 14001:2004 for environmental management systems with respect to developing and providing services for online trading, clearing and settlement facilities, and risk monitoring of commercial derivatives market. It has also achieved the ISO/IEC 27001:2005 certification, which is the global benchmark for information security management systems. The total value of commodity futures contracts traded on MCX in the nine months ended December 31, 2011 and the fiscals 2011, 2010 and 2009 was `119,806.89 bn, `98,415.03 bn, `63,933.03 bn and `45,880.95 bn, respectively. According to data maintained by the FMC, these amounts represented 87.3%, 82.4%, 82.3% and 87.4% of the Indian commodity futures industry in terms of the value of commodity futures contracts traded during the same periods. For the nine months ended December 31, 2011, the total number of futures contracts in silver, gold, crude oil and copper, which were the top four commodities traded on MCX, was 101.80 mn, 72.80 mn, 42.66 mn and 26.87 mn, respectively. During the fiscal 2011, the total number of futures contracts in silver, gold, crude oil and copper, were 46.0 mn, 30.5 mn, 46.3 mn and 31.0 mn, respectively. On September 23, 2011, MCX recorded the highest daily turnover on the Exchange since its inception, which was `1,116.66 bn. Based on the comparison of the trading volumes of MCX with those of the leading global commodity futures exchanges in the world, for the calendar year 2010 and the six months ended June 30, 2011, the company was the largest silver exchange, the second largest gold, copper and natural gas exchange and the third largest crude oil exchange, in terms of the number of commodity futures contracts traded for each of these commodities for this period. MCX is also the fifth largest commodity futures exchange globally, among all the commodity exchanges considered in the Futures Industry Association (FIA) survey, in terms of the number of contracts traded for the six months ended June 30, 2011. MCX has also made strategic investments in several related businesses which it believes are potential revenue growth drivers. The following chart shows its strategic investments: MCX MCX CCL MCX-SX CCL DGCX 5% MCX-SX 5% SME 51% 100% 26% Keynote Capitals Institutional Research Page 6
- 7. K E Y N O T E Strengths • Leadership Position in the Commodity Futures Industry: The Company is the leading commodity futures exchange in India in terms of value of commodity futures contracts traded in metals, energy and certain agricultural commodities. According to data maintained by FMC, the total value of commodity futures contracts traded on Exchange for the nine months ended December 31, 2011, the fiscals 2011 and 2010 constituted 87.3%, 82.4% and 82.3%, respectively, of the Indian commodity futures industry during those periods. Among the national commodities exchanges in India, company’s market share based on the total value of commodities traded in futures markets for the nine months ended December 31, 2011 for gold, crude oil, silver, copper and natural gas futures contracts was approximately 97.1%, 94.8%, 98.5%, 94.9% and 99.9%, respectively. MCX was the fifth largest commodity futures exchange globally, among all the commodity exchanges considered in the FIA survey, in terms of the number of contracts traded and were among the leading commodity exchanges in the world in terms of trading volumes of certain commodities. • Product and Service Innovation: MCX has introduced new and innovative products, i.e. commodity futures contracts, and services on Exchange. It was the first exchange in India to offer futures trading in steel, crude oil, and almond. In June 2005, It has launched MCXCOMDEX, India‘s first real time composite commodity futures index, which provides valuable information regarding market movements in the key commodities, as determined by physical market size in India, which are actively traded on Exchange. It has introduced several other indices, including MCXAgri (agricultural commodities index), MCXEnergy (energy commodities index) and MCXMetal (metal commodities index). It has three rain indices, namely RAINDEXMUM (Mumbai), RAINDEXIDR (Indore), and RAINDEXJAI (Jaipur) which track the progress of monsoon rains in their respective geographic locations. • Technology Infrastructure: Technology infrastructure is the foundation of company’s business and a key factor in development. Online trading platform is accessible to the members through trader workstation or computer-to-computer link (CTCL using multiple media of connectivity including VSATs, VPN, leased lines, and the internet. Electronic platform is supported by the infrastructure and advanced technology, allowing faster trade execution, anonymity, price transparency, prompt and reliable order routing, trade reporting, market data dissemination and market surveillance. • Expand Market Presence and Increase Participants: As of December 31, 2011, The Company had 2,153 members nationwide with more than 296,000 terminals including CTCL spread over 1,572 cities and towns in India. The company will continue to increase the number of participants by introducing new products on Exchange, by expanding to more geographical areas Objects of the Issue The objects of the issue are: • The objects of the Offer is to achieve the benefits of listing on the BSE. • To sale of 6,427,378 Equity Shares by the Selling Shareholders. Keynote Capitals Institutional Research Page 7
- 8. K E Y N O T E Utilization of net proceeds As a percentage of As a percentage Particulars Amounts* Offer Expenses* of Offer Size* Lead merchant bankers fees [●] [●] [●] Underwriting and Selling Commission (including [●] [●] [●] commission to SCSBs for ASBA applications) Processing fee to the SCSBs for processing Bid cum Application Forms procured by members of the Syndicate [●] [●] [●] and submitted to SCSBs under the Syndicate ASBA process# Registrars to the Offer fees [●] [●] [●] Bankers to the Offer fees [●] [●] [●] Others: -Printing and stationery expenses [●] [●] [●] -Listing fees [●] [●] [●] -Advertising and marketing expenses [●] [●] [●] -IPO grading fees [●] [●] [●] -Others [●] [●] [●] Total estimated Offer expenses [●] [●] [●] Investment Risks (Please refer to the RHP for a complete listing of risk factors) • The offer is pure offer for sale and the company would not receive any proceeds from the offer. • The promoters will divest their stake to 26% from current 31.2% in order to maintain minimum stake as mandate by SEBI that shows the kind of promoters confidence in the company. • The company’s business is significantly dependent on the technology used. The company has made agreement with the promoter and licensed to use the technology provided by promoter. The premature termination of such agreements or the loss of the ability to use such technology due to any reason would have an adverse impact the business operations. • There are fixed cost and semi fixed cost, which are not dependent directly on the trading volume on the exchange. If the revenues of the company decline and it are unable to reduce cost, profitability will be adversely affected Keynote Capitals Institutional Research Page 8
- 9. K E Y N O T E Restated Profit & Loss Statements (`Cr) PARTICULARS FY09 FY10 FY11 9M FY12 INCOME FORM OPERATIONS 212.45 287.38 368.89 402.33 OTHER INCOME 153.40 206.32 78.67 72.17 TOTAL INCOME 365.85 493.70 447.56 474.50 STAFF COST 25.43 21.75 26.43 20.13 ADMINISTRATION AND OTHER EXPENSES 110.61 124.08 150.70 121.68 DEPRECIATION 19.96 24.74 24.66 20.44 INTEREST 0.18 0.04 0.02 0.00 TOTAL EXPENDITURE 156.18 170.61 201.81 162.25 NET PROFIT BEFORE TAX 209.67 323.09 245.75 312.25 CURRENT TAX 45.27 100.43 70.35 91.43 PRIOR PERIOD TAX 0.00 0.00 0.20 -2.72 DEFERRED TAX 6.31 1.91 2.08 2.98 WEALTH TAX 0.03 0.03 0.02 0.02 FRINGE BENEFIT TAX 0.64 0.00 0.00 0.00 PROFIT AFTER TAX 157.42 220.72 173.10 220.54 SHARE OF PROFIT OF ASSOCIATE 0.04 0.30 0.26 0.14 NET PROFIT AFTER TAX 157.46 221.02 173.36 220.68 PRIOR PERIOD EXPENSE 1.38 -0.21 2.92 -2.72 NET PROFIT, AS RESTATED 158.84 220.81 176.28 217.96 No of Shares 4.08 4.08 5.10 5.10 EPS Annualised 38.93 54.12 34.57 56.99 Restated Balance Sheets (` Cr) PARTICULARS FY09 FY10 FY11 9M FY12 GROSS BLOCK 259.48 267.88 291.65 309.54 LESS: ACCUMULATED DEPRECIATION 50.89 75.36 96.36 116.54 NET BLOCK (A) 208.59 192.52 195.29 193.00 Capital WIP 0.28 0.26 0.05 0.04 TOTAL FIXED ASSETS 208.87 192.78 195.34 193.04 INVESTMENTS (B) 469.82 617.01 823.74 1095.81 SUNDRY DEBTORS 26.89 30.38 48.87 49.40 CASH & BANK BALANCES 405.85 270.05 331.17 228.57 LOAN AND ADVANCES 45.24 110.79 89.66 96.09 OTHER CURRENT ASSETS 9.17 7.84 11.32 9.68 TOTAL CURRENT ASSETS (C) 487.15 419.06 481.02 383.74 TOTAL ASSETS (A+B+C) (D) 1165.84 1228.85 1500.10 1672.59 CURRENT LIABILITIES & PROVISIONS 663.47 521.42 638.55 582.98 DEFERRED TAX LIABILITY 8.72 10.62 12.70 15.68 TOTAL NETWORTH 493.65 696.81 848.85 1073.93 EQUITY SHARE CAPITAL 40.80 40.80 51.00 51.00 STOCK OPTION 0.02 0.00 0.00 0.00 RESERVES & SURPLUS 452.83 656.01 797.85 1022.93 NET WORTH 493.65 696.81 848.85 1073.93 Keynote Capitals Institutional Research Page 9
- 10. K E Y N O T E Keynote Capitals Ltd. Member Stock Exchange, Mumbai (INB 230930539) National Stock Exchange of India Ltd. (INB 010930556) Over the Counter Exchange of India Ltd. (INB 200930535) Central Depository Services Ltd. (IN-DP-CDSL-152-2001) Registered Office 4th Floor, Balmer Lawrie Building, 5, J. N. Heredia Marg, Ballard Estate, Mumbai 400 001. Tel Nos. 022-2269 4322 / 24 / 25 Disclaimer This report by Keynote Capitals Ltd. is purely for information purpose and is based on the Red Herring Prospectus for the public issue of the company under coverage, published financial statements, public information and the recent analyst meeting of the company. Neither the information nor any opinion expressed in this report constitutes an offer, or an invitation to make an offer, to buy or sell the securities mentioned herein. Directors, officers, clients or employees of Keynote Capitals or its affiliates may have positions in securities covered in this report or in related investments. Keynote Capitals Ltd may also have proprietary trading positions in securities covered in this report or in related investments. Opinions and estimates mentioned herein, if any, are based on workings of Keynote Capitals only. Investors in the issue are advised to read the RHP carefully before subscribing to the issue. Keynote Capitals Ltd. or any of its directors, officers or employees shall not in any way be responsible for any loss arising from the use of this report. Investors are advised to apply their own judgment before acting on the contents of this report. Keynote Capitals Institutional Research Page 10