Nepse technical analysis dec 21 dec 24, 2014 (eng & nep)
•
0 recomendaciones•254 vistas

Technical analysis of Nepal Stock Exchange (Nepse) index for the week from Dec 21, 2014 to Dec 24, 2014. The technical analysis includes summary, RSI, MACD and Bollinger band analysis. The analysis is done by Kriti Capital & Investments Ltd.

Recomendados
Recomendados
Más contenido relacionado
Destacado
Destacado (8)
Más de Kriti Capital & Investments Ltd.
Más de Kriti Capital & Investments Ltd. (20)
Último
Último (20)
Nepse technical analysis dec 21 dec 24, 2014 (eng & nep)
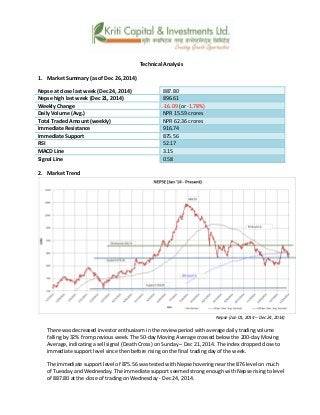
- 1. Technical Analysis 1. Market Summary (as of Dec 26, 2014) Nepse at close last week (Dec 24, 2014) 887.80 Nepse high last week (Dec 21, 2014) 896.61 Weekly Change -16.09 (or -1.78%) Daily Volume (Avg.) NPR 15.59 crores Total Traded Amount (weekly) NPR 62.36 crores Immediate Resistance 916.74 Immediate Support 875.56 RSI 52.17 MACD Line 3.15 Signal Line 0.58 2. Market Trend Nepse (Jan 01, 2014 – Dec 24, 2014) There was decreased investor enthusiasm in the review period with average daily trading volume falling by 32% from previous week. The 50-day Moving Average crossed below the 200-day Moving Average, indicating a sell signal (Death Cross) on Sunday – Dec 21, 2014. The index dropped close to immediate support level since then before rising on the final trading day of the week. The immediate support level of 875.56 was tested with Nepse hovering near the 876 level on much of Tuesday and Wednesday. The immediate support seemed strong enough with Nepse rising to level of 887.80 at the close of trading on Wednesday - Dec 24, 2014.
- 2. After breaching the immediate resistance level of 875.56 the week before, Nepse witnessed more of sideways movement in the past week. 3. RSI RSI is a form of leading indicator that is believed to be most effective during periods of sideways movement. Such indicators may create numerous buy and sell signals that are useful when the market is not clearly trending upwards or downwards. RSI fell from close to overbought region to neutral region in the past week. RSI ended the week at 52.17 level. RSI (Jan 01, 2014 –Dec 24, 2014) 4. MACD The MACD is a momentum oscillator formed by using two different types of moving averages, which provides specific buying or selling signals. When a MACD line crosses above the signal line, it is considered to be a positive sign and indicates a time to buy, and vice-versa. In the review period, the Signal line rose rapidly to close its gap on MACD line. Meanwhile, the MACD line decreased slightly. If the trend continues and the MACD line crosses below the Signal line in the coming days, this would indicate a sell signal. MACD (Jan 01, 2014 – Dec 24, 2014) 5. Bollinger Bands The Bollinger Band is a technical indicator that consists of a moving average (21-day) along with two trading bands above (upper band) and below it (lower band). The bands are an indication of volatility, which are represented by calculating standard deviation. The Bollinger bands diverged further in the review period, indicating increase in volatility in the market. Nepse fell from close to the upper band to end near the mid band in the review period. This indicates that the current price is neither too high nor too low, i.e. the market is neither overbought nor oversold at the moment. Like the RSI, Bollinger bands too indicate that the Nepse is displaying neutrality at the moment.
- 3. Bollinger Bands (Jan 01, 2014 – Dec 24, 2014) Overview: Nepse tested the immediate support level of 875.56 in the past week. As the support seemed strong enough, there was short-term trend reversal with index increasing from the lows of 876 to end at 896.61. The Bollinger bands and RSI indicators suggest that the index is in the neutral region. This means there is no strong buy or sell signal through these indicators. But, as the Bollinger bands have indicated high volatility, we may see more of sideways movement in Nepse with the support and resistance level tested in the coming days.
- 4. k|fljlws ljZn]if0f ahf/ ;f/f+z -k'; )^ b]vL k'if )( ;Ddsf]_ aGb cªs -k'if )(_ M **&=*) pRr cªs -k'if )^_ M *(^=^! ;fKtflxs kl/jt{g M –!^=)( cªs -–!=&* k|ltzt_ b}lgs cf};t Jofkf/ M ¿= !%=%( s/f]8 s'n ;fKtflxs Jofkf/ M ¿= ^@=#^ s/f]8 tTsflng 6]jf M (!^=&$ tTsflng k|lt/f]w M *&%=%^ cf/P;cfO{ M %@=!& PdP;L8L M #=!% l;Ugn nfO{g M )=%* %) tyf @)) lbg] d'leª Pe/]h o; ;ftf cf}ift b}lgs Jofkf/ -ef]No"d_ cl3Nnf] xKtfsf] t'ngfdf #@ k|ltztn] 36]sf] 5 h;n] o; cjlwdf nufgLstf{x?sf] ahf/ k|ltsf] pT;fx 36]sf] ;+s]t u/]sf] 5 . cfO{taf/ -l8;]Da/ @!, @)!$_, %)–lbg] d'leË Pe/]hn] @))–lbg] d'leË Pe/]hnfO{ dflyaf6 sf6]sf] 5 h;n] z]o/ lals| -8]y s|;_sf] ;+s]t u/]sf] 5 . g]K;] kl/;"rs tTsflng 6]jf cªs glhs k'u]sf] lyof] h'g clGtd sf/f]af/ lbg k]m/L a9]sf] lyof] . g]K;] d+unaf/ / a'waf/ *&^ cªs glhs sfod /x]sf] lyof] / o;n] *&%=%^ cªssf] tTsfnLg 6]jf cªs kl/If0f ul//x]sf] lyof] . of] tTsflng 6]jf cªs alnof] b]lvof] / g]K;] clGtd sf/f]af/ lbg a9]/ **&=*) cªsdf aGb ePsf] lyof] . cl3NNff] xKtf *&%=%^ cªssf] k|lt/f]w cªs kf/ u/] kl5 g]K;] o; ;ftf e/ t];f]{ g} /x]sf] 5 . Nepse (Jan 01, 2014 – December 24, 2014)
- 5. l/n]l6j :6«]Gy OG8]S; -cf/P;cfO{_ cf/P;cfO{ k|fljlws ljZn]if0fsf] o:tf] cf}hf/ xf], h;nfO{ Pstlkm{ ?kdf rln/x]sf] ahf/df Jofkf/ /0fgLlt agfpg a9L pkof]uL dflgG5 . To;}u/L, o;n] ahf/df vl/b / ljlqmsf] :ki6 ;+s]t b]vfpg] u5{ . o; ;ftf cf/P;cfO{ cf]e/a6 If]qaf6 t6:y If]q tk{m ws]lnPsf] 5 . ;ftfsf] cGTodf cf/P;cfO{ %@=!& cªs k'u]sf] 5 . RSI (Jan 01, 2013 – December24, 2014) d'leª Pe/]h sGeh]{G; 8fOeh]{G; -PdP;L8L_ PdP;L8Ldf b'O{ cf]6f /]vf x'G5g, h;df Pp6fn] ahf/sf] lbzf kl/jt{gsf] ;+s]t u5{ eg] csf]{n] ahf/sf] k|j[lQ -6«]08_ b]vfpg] u5{ . olb PdP;L8L /]vfn] l;Ung /]vfnfO{ tnaf6 dfly sf6]df o;nfO{ ;sf/fTds ;+s]tsf ?kdf lnO{G5 / o;n] z]o/x? lsGg] ;+s]t ub{5 . o; ;ftf, l;Ugn /]vf ltj| ultdf a9]sfn] PdP;L8L /]vf glhs k'u]sf] 5 . o;} lar PdP;L8L /]vf eg] yf]/} 36]sf] 5 . olb olx k|j[lt hf/L /xof] / PdP;L8L /]vfn] cfpFbf lbgdf ;+s]t /]vf kf/ u¥of] eg], o;n] z]o/ a]Rg] ;+s]t ug]{5 . MACD (Jan 01, 2013 – December 24, 2014) af]lnªu/ Aof08 af]lnªu/ Aof08 Ps k|fljlws ljZn]if0f ;"rs xf] h;df @!–lbg] d'leË Pe/]hsf ;fy b'O{ Aof08 -Pp6f dfly_ / Pp6f tn_ x'G5g . lo Aof08x?n] cl:y/tfsf] ;+s]t ub{5g, h'g :6fG88{ 8]leP;g u0fgf u/]/ kQf nufO{G5 . ;ftfsf] klxnf] sf/f]af/ lbg, g]K;] dWo Aof08af6 dflyNnf] Aof08 tk{m a9]sf] 5 . o; ;ftf Aof08x? lar b'/L k]m/L a9]sf] 5 h;n] ahf/df cl:y/tf /x]sf] ;+s]t u/]sf] 5 . g]K;] dflyNnf] Aof08 glhsaf6 dWo Aof08 tk{m 36]sf] 5 . o;n] ahf/sf] xfnsf] d'No g pRr g sd, cyf{t ahf/ g cf]e/ g cf]e/;f]N8 cj:yfdf /x]sf] ;+s]t u/]sf] 5 . cf/P;cfO{ h:t}, af]lnË/ Aof08 Aof08n] klg g]K;] t6:y /x]sf] ;+s]t u/]sf] 5 .
- 6. Bollinger Bands (Jan 01, 2013 – December 24, 2014) ;du{dfM o; ;ftf g]K;]n] *&%=%^ cªssf] tTsfnLg 6]jf cªs k]m/L klg kl/If0f u/]sf] 5 . 6]jf cªs alnof] ;flat ePsf] 5 / *&^ ;Dd em/]/ *(#=^! cªs ;Dd a9]sf] g]K;]df ;fgf] cNksfnLg k|j[lt kl/jt{g b]lvPsf] 5 . af]lnªu/ Aof08 / cf/P;cfO{ ;"rsn] g]K;] kl/;"rs t6:y If]qdf /x]sf] 5 . o;n] ahf/df alnof] vl/b jf lals| bafa gePsf] ;+s]t u/]sf] 5 . t/, af]lnªu/ Aof08n] ahf/df pRr cl:y/tf /x]sf sf/0f, lgs6 eljiodf ahf/ t];f]{ g} /xg ;Sg] 5 .