Nepse technical analysis nov 09 nov 13, 2014 (eng & nep)
•
0 recomendaciones•198 vistas

Technical analysis of Nepal Stock Exchange (Nepse) index for the week from Nov 09, 2014 to Nov 13, 2014. The technical analysis includes summary, RSI, MACD and Bollinger band analysis. The analysis is done by Kriti Capital & Investments Ltd.

Recomendados
Recomendados
Más contenido relacionado
Más de Kriti Capital & Investments Ltd.
Más de Kriti Capital & Investments Ltd. (20)
Último
Último (20)
Nepse technical analysis nov 09 nov 13, 2014 (eng & nep)
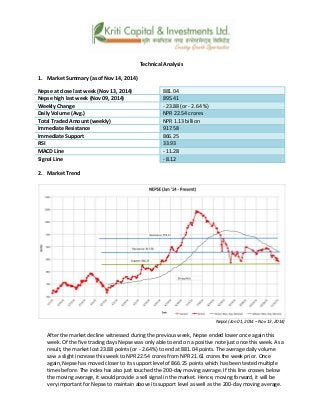
- 1. Technical Analysis 1. Market Summary (as of Nov 14, 2014) Nepse at close last week (Nov 13, 2014) 881.04 Nepse high last week (Nov 09, 2014) 895.41 Weekly Change - 23.88 (or - 2.64 %) Daily Volume (Avg.) NPR 22.54 crores Total Traded Amount (weekly) NPR 1.13 billion Immediate Resistance 917.58 Immediate Support 866.25 RSI 33.93 MACD Line - 11.28 Signal Line - 8.12 2. Market Trend Nepse (Jan 01, 2014 – Nov 13, 2014) After the market decline witnessed during the previous week, Nepse ended lower once again this week. Of the five trading days Nepse was only able to end on a positive note just once this week. As a result, the market lost 23.88 points (or - 2.64%) to end at 881.04 points. The average daily volume saw a slight increase this week to NPR 22.54 crores from NPR 21.61 crores the week prior. Once again, Nepse has moved closer to its support level of 866.25 points which has been tested multiple times before. The index has also just touched the 200-day moving average. If this line crosses below the moving average, it would provide a sell signal in the market. Hence, moving forward, it will be very important for Nepse to maintain above its support level as well as the 200-day moving average.
- 2. 3. RSI RSI is a form of leading indicator that is believed to be most effective during periods of sideways movement. Such indicators may create numerous buy and sell signals that are useful when the market is not clearly trending upwards or downwards. With the recent downtrend in Nepse, the RSI has reached 33.93 and is inching closer to the oversold zone. This indicates a higher selling pressure in the markets in recent weeks. RSI (Dec 01, 2013 – Nov 13, 2014) 4. MACD The MACD is a momentum oscillator formed by using two different types of moving averages, which provides specific buying or selling signals. When a MACD line crosses above the signal line, it is considered to be a positive sign and indicates a time to buy, and vice-versa. The MACD indicator followed a downward trend since the MACD line crossed below the Signal line the week before. As a result, the MACD and Signal lines closed at - 11.28 and - 8.12 points respectively. MACD (Dec 01, 2013 – Nov 13, 2014) 5. Bollinger Bands The Bollinger Band is a technical indicator that consists of a moving average (21-day) along with two trading bands above (upper band) and below it (lower band). The bands are an indication of volatility, which are represented by calculating standard deviation. With the overall downward trend, the Nepse line has followed the lower band in the downward direction. This has caused the upper and lower bands to deviate away from the mid-band indicating higher volatility in the market.
- 3. Bollinger Bands (Dec 01, 2013 – Nov 13, 2014) Overview: Continuing with the trend from the previous week, Nepse once again followed a downward trend. There has been a lack of enthusiasm among investors as the political process appears to be stalled in recent times. As a result, the stock market closed down 23.88 points (or - 2.64%) to end at 881.04 points. The average daily volume saw a slight increase this week to NPR 22.54 crores. Nepse is inching closer to its support level of 866.25 points as well as the 200-day moving average, a drop below which would indicate a sell signal. The RSI stands at 33.93 levels suggesting Nepse is moving towards the oversold zone while the MACD indicator shows an overall downward momentum. The Bollinger Bands suggest rising volatility in the market. Overall, there has been higher selling pressure in the market and it may slide further if it crosses below the 200-day moving average.
- 4. k|fljlws ljZn]if0f ahf/ ;f/f+z -sflt{s @# b]vL sflt{s @& ;Ddsf]_ aGb cªs -sflt{s @&_ M **!=)% pRr cªs -sflt{s @#_ M *(%=$! ;fKtflxs kl/jt{g M –@#=** cªs -–@=^$ k|ltzt_ b}lgs cf};t Jofkf/ M ¿= @@=%$ s/f]8 s'n ;fKtflxs Jofkf/ M ¿= !=!# ca{ tTsflng 6]jf M (!&=%* tTsflng k|lt/f]w M *^^=@% cf/P;cfO{ M ##=(# PdP;L8L M –!!=@* l;Ugn nfO{g M –*=!@ %) tyf @)) lbg] d'leª Pe/]h cl3Nnf] xKtf ahf/df lu/fj6 b]lvP kl5, o; ;ftf g]K;]df k]ml/ klg lu/fj6 b]lvPsf] 5 . kfFr sf/f]af/ lbgx?df o; ;ftf g]K;] Ps k6s dfq ;sf/fTds /x]sf] lyof] . kmn:j?k, ahf/n] @#=** cªs -jf @=^$ k|ltzt_ u'dfP/ **!=)$ cªsdf ;dfKt ePsf] 5 . o; ;ftf b}lgs cf}ift Jofkf/ -ef]No"d_ df eg] ;fgf] j[l4 b]lvPsf] 5 / of] @!=^! s/f]8 ?k}Fof af6 a9]/ @@=%$ s/f]8 ?k}Fof k'u]sf] 5 . g]K;] k]ml/ klg *^^=@% cªssf] 6]jf cªs glhs k'u]sf] 5 . g]K;] kl/;"rsn] @))–lbg] d'leË Pe/]hnfO{ 5f]Psf] 5 . olb g]K;]n] o; d'leË Pe/]hnfO{ dflyaf6 kf/ u/]df o;n] ahf/df z]o/ a]Rg] ;+s]t ug]{5 . t;y{, cfufdL lbgx?df, g]K;] cfˆgf] 6]jf cªs / @))–lbg] d'leË Pe/]h eGbf dfly /xg Psbd dxTjk"0f{ /x]sf] 5 . Nepse (Jan 01, 2014 – November 14, 2014)
- 5. l/n]l6j :6«]Gy OG8]S; -cf/P;cfO{_ cf/P;cfO{ k|fljlws ljZn]if0fsf] o:tf] cf}hf/ xf], h;nfO{ Pstlkm{ ?kdf rln/x]sf] ahf/df Jofkf/ /0fgLlt agfpg a9L pkof]uL dflgG5 . To;}u/L, o;n] ahf/df vl/b / ljlqmsf] :ki6 ;+s]t b]vfpg] u5{ . g]K;]df xfn ljBdfg lu/fj6 k|j[lt ;+u} cf/P;cfO{ ##=(# cªs k'u]sf] 5 / of] cf]e/;f]N8 If]q tk{m al9/x]sf] 5 . o;n] xfnsf] ;ftfx?df ahf/df pRr las|L bafa /x]sf] klg ;+s]t u/]sf] 5 . RSI (Jan 01, 2013 – November 14, 2014) d'leª Pe/]h sGeh]{G; 8fOeh]{G; -PdP;L8L_ PdP;L8Ldf b'O{ cf]6f /]vf x'G5g, h;df Pp6fn] ahf/sf] lbzf kl/jt{gsf] ;+s]t u5{ eg] csf]{n] ahf/sf] k|j[lQ -6«]08_ b]vfpg] u5{ . olb PdP;L8L /]vfn] l;Ung /]vfnfO{ tnaf6 dfly sf6]df o;nfO{ ;sf/fTds ;+s]tsf ?kdf lnO{G5 / o;n] z]o/x? lsGg] ;+s]t ub{5 . cl3Nnf] xKtf, PdP;L8L /]vfn] l;Ugn /]vfnfO{ dflyaf6 kf/ u/] b]lv PdP;L8L /]vfdf lu/fj6 k|j[lt b]lvPsf] 5 . kmn:j?k, PdP;L8L / l;Ugn /]vf s|dzM –!!=@* / – *=!@ em/]sf] 5 . MACD (Jan 01, 2013 – November 14, 2014) af]lnªu/ Aof08 af]lnªu/ Aof08 Ps k|fljlws ljZn]if0f ;"rs xf] h;df @!–lbg] d'leË Pe/]hsf ;fy b'O{ Aof08 -Pp6f dfly_ / Pp6f tn_ x'G5g . lo Aof08x?n] cl:y/tfsf] ;+s]t ub{5g, h'g :6fG88{ 8]leP;g u0fgf u/]/ kQf nufO{G5 . ;du| lu/fj6sf] k|j[lt;+u}, g]K;] /]vfn] tNnf] Aof08sf] lbzf k5ofPsf] 5 . o;n] dflyNnf] / tNnf] Aof08 lar b'/L a9fPsf] 5 h;n] ahf/df pRr cl:y/tf /x]sf] ;+s]t u/]sf] 5 .
- 6. Bollinger Bands (Jan 01, 2013 – November 14, 2014) ;du{dfM cl3Nnf] xKtfsf] k|j[lt k5ofpFb}, g]K;]df k]ml/ klg lu/fj6 k|j[lt b]lvPsf] 5 . /fhlglts k|ls|of / ;'wf/ 7Kk /x]sfn] nufgLstf{x? aLr pT;fxdf sld b]Vg ;lsG5 . kmn:j?k, g]K;] @#=** cªs -jf @=^$ k|ltzt_ n] 36]/ **!=)$ cªsdf aGb ePsf] 5 . b}lgs cf}ift Jofkf/ -ef]No"d_ df yf]/} j[l4 b]lvPsf] 5 / of] @@=%$ s/f]8 ?k}Fof k'u]sf] 5 . g]K;] *^^=@% cªssf] 6]jf cªs / @)) lbg] d'leË Pe/]h glhs /x]sf] 5 / of] eGbf d'lg em/]df o;n] ahf/df z]o/ a]Rg] ;+s]t ug]{5 . cf/P;cfO{ ##=(# cªsdf /x]sf] 5 h;n] g]K;] cf]e/;f]N8 If]q glhs /x]sf] b]vfpF5 hals PdP;L8L ;"rsn] lu/fj6 k|j[ltsf] ;+s]t u/]sf] 5 . af]lnªu/ Aof08n] ahf/df cl:y/tf a9]sf] ;+s]t u/]sf] 5 . ;du|df, ahf/df pRr las|L bafa /x]sf] 5 / olb o;n] @))–lbg] d'leË Pe/]h kf/ u/] ahf/ cem tn emg{ ;Sg] ;Defjgf /x]sf] 5 .