Perceptual mapping of port of colombo
•Descargar como DOC, PDF•
0 recomendaciones•501 vistas

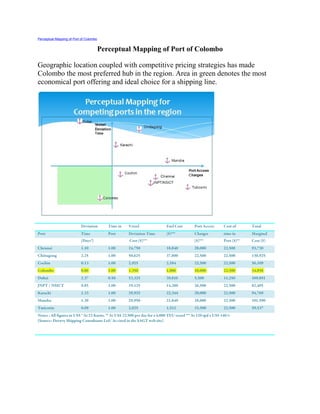
Geographic location coupled with competitive pricing strategies has made Colombo the most preferred hub in the region. Area in green denotes the most economical port offering and ideal choice for a shipping line.

Recomendados
Más contenido relacionado
La actualidad más candente
La actualidad más candente (14)
Destacado
Destacado (12)
Más de CINEC Campus
Más de CINEC Campus (20)
Último
Último (20)
Perceptual mapping of port of colombo
- 1. Perceptual Mapping of Port of Colombo Perceptual Mapping of Port of Colombo Geographic location coupled with competitive pricing strategies has made Colombo the most preferred hub in the region. Area in green denotes the most economical port offering and ideal choice for a shipping line. Deviation Time in Vessel Fuel Cost Port Access Cost of Total Port Time Port Deviation Time ($)*** Charges time in Marginal (Days*) Cost ($)*** ($)*** Port ($)** Cost ($) Chennai 1.10 1.00 24,750 18,840 28,000 22,500 93,730 Chiitagong 2.25 1.00 50,625 37,800 22,500 22,500 130,925 Cochin 0.13 1.00 2,925 2,184 22,500 22,500 56,109 Colombo 0.06 1.00 1,350 1,006 10,000 22,500 34,858 Dubai 2.37 0.50 53,325 39,816 5,500 11,250 109,891 JNPT / NSICT 0.85 1.00 19,125 14,280 26,500 22,500 82,405 Karachi 1.33 1.00 29,925 22,344 20,000 22,500 94,769 Mundra 1.30 1.00 29,950 21,840 28,000 22,500 101,590 Tuticorin 0.09 1.00 2,025 1,512 33,500 22,500 59,537 Notes : All figures in US$ * At 23 Knots, ** At US$ 22,500 per day for a 4,000 TEU vessel *** At 120 tpd x US$ 140/t {Source: Drewry Shipping Consultants Ltd/ As cited in the SAGT web site)