Neighborhood Market Report for Southwick, MA 01077
•
0 recomendaciones•1,483 vistas

This document provides a neighborhood report for Southwick, MA 01077 that includes statistics and charts related to housing, people, economics, quality of life, and more. It summarizes median home value as $244K with 0% change in the last 12 months. Unemployment is not provided for Southwick specifically but is listed as 8.5% for Hampden County and 6.6% for Massachusetts. Various charts show distributions of home values, ages, sizes and more for homes recently sold in the area.

Recomendados
Recomendados
Más contenido relacionado
La actualidad más candente
La actualidad más candente (14)
Similar a Neighborhood Market Report for Southwick, MA 01077
Similar a Neighborhood Market Report for Southwick, MA 01077 (20)
Más de Lesley Lambert
Más de Lesley Lambert (20)
Último
Último (20)
Neighborhood Market Report for Southwick, MA 01077
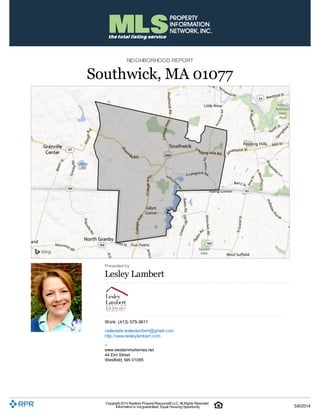
- 1. NEIGHBORHOOD REPORT Southwick, MA 01077 Presented by Lesley Lambert Work: (413) 575-3611 realestate.lesleylambert@gmail.com http://www.lesleylambert.com – www.westernmahomes.net 44 Elm Street Westfield, MA 01085 Copyright 2014 Realtors PropertyResource®LLC. All Rights Reserved. Information is not guaranteed. Equal Housing Opportunity. 5/6/2014
- 2. Median Sales Price vs. Sales Volume This chart compares the price trend and sales volume for homes in an area. Home prices typically follow sales volume, with a time lag, since sales activity is the driver behind price movements. Data Source: Public records data Update Frequency: Monthly Median Sales Price Sales Volume Neighborhood: Housing Stats and Charts 01077 Southwick Hampden County Massachusetts Median Estimated Home Value $244K $244K $175K $323K Estimated Home Value 12-Month Change 0% 0% 1.7% 5.8% Median List Price $250K $237K $170K $325K List Price 1-Month Change –4.7% –5.2% 4.1% 3.2% List Price 12-Month Change 20.4% 14.2% 4.3% 6.6% Median Home Age 43 43 61 61 Own 81% – 63% 64% Rent 19% – 37% 36% Vacancy 2.07% – 2.86% – $ Value of All Buildingsfor which PermitsWere Issued – – $58.7M $1.82B %Change in Permitsfor All Buildings – – –5% 15% %Change in $ Value for All Buildings – – –8% 17% Southwick, MA 01077 Copyright 2014 RealtorsProperty Resource®LLC. All RightsReserved. Information isnot guaranteed. Equal Housing Opportunity. 5/6/2014
- 3. Median Listing Price vs. Listing Volume This chart compares the listing price and listing volume for homes in an area. Listing prices often follow listing volume, with a time lag, because supply can drive price movements. Data Source: On- and off-market listings sources Update Frequency: Monthly Median List Price Listing Volume Price Range of Homes Sold This chart shows the distribution of homes reported sold in the past six months within different price ranges in the area of your search. The amount shown for the subject property is sold data where available, or the property's estimated value when sales data are unavailable (such as a non-disclosure state) or provided in range format. Data Source: Public records data Update Frequency: Monthly Sales Count ByPrice Range Price per Square Foot of Homes Sold This chart shows the distribution of homes reported sold in the past six months at different prices per square foot in the area of your search. Data Source: Public records data Update Frequency: Monthly Sales Count ByPrice Per Sq Ft Southwick, MA 01077 Copyright 2014 RealtorsProperty Resource®LLC. All RightsReserved. Information isnot guaranteed. Equal Housing Opportunity. 5/6/2014
- 4. Size of Homes Sold This chart shows the distribution of homes reported sold in the past six months of different sizes in the area of your search. Data Source: Public records data Update Frequency: Monthly Sales Count ByLiving Area Age Range of Homes Sold This chart shows the distribution of homes reported sold in the past six months of different age ranges in the area of your search. Data Source: Public records and MLS data where licensed Update Frequency: Monthly Sales Count byAge of House Number of Bedrooms in Homes Sold This chart shows the distribution of homes reported sold in the past six months, according to the number of bedrooms, in the area of your search. Data Source: Public records data Update Frequency: Monthly Sales Count byBedroom Southwick, MA 01077 Copyright 2014 RealtorsProperty Resource®LLC. All RightsReserved. Information isnot guaranteed. Equal Housing Opportunity. 5/6/2014
- 5. Population of Children by Age Group This chart shows the distribution of the population of children by age range — from birth to 17 — in the area of your search. Data Source: U.S. Census Update Frequency: Annually 01077 Population of Adults by Age Group This chart shows the distribution of the population of adults by age range — from 18 to 75-plus — in the area of your search. Data Source: U.S. Census Update Frequency: Annually 01077 Households With Children This chart shows the distribution of households with children, categorized by marital status, in the area of your search. Data Source: U.S. Census Update Frequency: Annually 01077 Neighborhood: People Stats and Charts 01077 Southwick Hampden County Massachusetts Population 9.43K – 463K 6.51M Population Density per Sq Mi 306 – 750 835 Population Change since 2000 6.6% – 1.4% 2.6% Median Age 41 – 39 39 Male / Female Ratio 49% – 48% 48% High School Graduate 36% – 32% 26% 2-Year Degree 29% – 27% 24% Bachelor Degree 18% – 15% 22% Post-graduate Degree 11% – 9% 17% Southwick, MA 01077 Copyright 2014 RealtorsProperty Resource®LLC. All RightsReserved. Information isnot guaranteed. Equal Housing Opportunity. 5/6/2014
- 6. Household Income Brackets This chart shows annual household income levels within an area. Data Source: U.S. Census Update Frequency: Annually 01077 Presidential Voting Pattern This chart shows how residents of a county voted in the 2012 presidential election. Data Source: USElectionAtlas.org Update Frequency: Annually Southwick, MA 01077 Copyright 2014 RealtorsProperty Resource®LLC. All RightsReserved. Information isnot guaranteed. Equal Housing Opportunity. 5/6/2014
- 7. Unemployment Rate This chart shows the unemployment trend in the area of your search. The unemployment rate is an important driver behind the housing market. Data Source: Bureau of Labor Statistics Update Frequency: Monthly Hampden County Massachusetts Neighborhood: Economic Stats and Charts 01077 Southwick Hampden County Massachusetts Income Per Capita $33,753 – $25,363 $35,051 Median Household Income $74,604 – $48,866 $65,981 Unemployment Rate – – 8.5% 6.6% Unemployment Number – – 18.9K 231K Employment Number – – 205K 3.27M Labor Force Number – – 224K 3.5M Southwick, MA 01077 Copyright 2014 RealtorsProperty Resource®LLC. All RightsReserved. Information isnot guaranteed. Equal Housing Opportunity. 5/6/2014
- 8. Occupational Categories This chart shows categories of employment within an area. Data Source: U.S. Census Update Frequency: Annually 01077 Southwick, MA 01077 Copyright 2014 RealtorsProperty Resource®LLC. All RightsReserved. Information isnot guaranteed. Equal Housing Opportunity. 5/6/2014
- 9. Average Commute Time This chart shows average commute times to work, in minutes, by percentage of an area's population. Data Source: U.S. Census Update Frequency: Annually 01077 How People Get to Work This chart shows the types of transportation that residents of the area you searched use for their commute. Data Source: U.S. Census Update Frequency: Annually Average Monthly Temperature This chart shows average temperatures in the area you searched. Data Source: NOAA Update Frequency: Annually Neighborhood: Quality of Life Stats and Charts Quality of Life in 01077 01077 Southwick Hampden County Massachusetts Elevation (in feet) 403 – 638 – Annual Rainfall (in inches) 45 – 47.58 45.8 Annual Snowfall (in inches) 47.74 – 55.02 53.14 Annual Sunny Days 83 – 83 83 Avg Travel Time to Work (in minutes) 30 – 22 28 Water Quality - Health Violations – – 0 – Water Quality - Monitoring and Report Violations – – 38 – Superfund Sites 0 – 1 36 Brownfield Sites No – Yes Yes Southwick, MA 01077 Copyright 2014 RealtorsProperty Resource®LLC. All RightsReserved. Information isnot guaranteed. Equal Housing Opportunity. 5/6/2014