Predictive power series
•
0 likes•376 views

Morningstar ratings do not reliably predict future fund performance. Funds with 5-star ratings from 2006 tended to underperform relative to lower-rated funds in subsequent years. Similarly, high Sharpe ratios from 2002-2006 did not correlate with strong performance in later periods. Past performance also generally failed to persist - top-performing funds from 1997-2006 often underperformed in 2007-2011 compared to benchmarks like the S&P 500 index. Across large and small value funds, most previous top performers went on to trail their respective Russell index in the following 5-10 years. Star ratings, risk-adjusted returns, and prior raw returns all showed little predictive power regarding future mutual fund success.

Recommended
Recommended
More Related Content
What's hot
What's hot (14)
Viewers also liked
More from Better Financial Education
More from Better Financial Education (20)
Recently uploaded
Recently uploaded (20)
Predictive power series
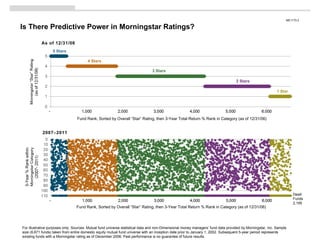
- 1. ME1170.2 Is There Predictive Power in Morningstar Ratings? As of 12/31/06 5 Stars Morningstar “Star” Rating 4 Stars (as of 12/31/06) 3 Stars 2 Stars 1 Star Fund Rank, Sorted by Overall “Star” Rating, then 3-Year Total Return % Rank in Category (as of 12/31/06) 2007–2011 Morningstar Category 5-Year % Rank within (2007- 2011) Dead Funds 2,195 Fund Rank, Sorted by Overall “Star” Rating, then 3-Year Total Return % Rank in Category (as of 12/31/06) For illustrative purposes only. Sources: Mutual fund universe statistical data and non-Dimensional money managers’ fund data provided by Morningstar, Inc. Sample size (6,671 funds) taken from entire domestic equity mutual fund universe with an inception date prior to January 1, 2002. Subsequent 5-year period represents existing funds with a Morningstar rating as of December 2006. Past performance is no guarantee of future results.
- 2. ME1170.2 Can Sharpe Ratios Predict Returns? 5-Year Sharpe Ratios (2002–2006) 5-Year Sharpe Ratios (2002–2006) Number of Funds = 5,849 Fund Rank, Sorted by 5-Year Sharpe Ratio (2002-2006) 5-Year Sharpe Ratios (2002–2006) vs. Subsequent Performance 20 5-Year Annualized Return % 10 0 2007- 2011 -10 -20 -30 Surviving Funds as of December 2011 (4,132 funds) -40 Funds with no data as of December 2011 (1,717 funds) -50 - 1,000 2,000 3,000 4,000 5,000 6,000 Fund Rank, sorted by Five-Year Sharpe Ratio, as of Dec 31, 2006 For illustrative purposes only. Eligible universe is all share classes of US Stock mutual funds with a five-year Sharpe ratio as of Dec 31, 2006, in Morningstar Direct 3.11. Sources: Mutual fund universe statistical data and non-Dimensional money managers’ fund data provided by Morningstar, Inc. Past performance is no guarantee of future results, and there is always the risk that an investor may lose money.
- 3. ME1170.2 Can Past Performance Predict Future Returns? US Equity Mutual Funds First Period: January 1997–December 2006 30% Funds that Outperformed S&P 500 Index (807) 10 Year Annualized Return Funds that Underperformed S&P 500 Index (1,587) 20% S&P 500 Index: 8.42% 1997–2006 10% 0% -10% -20% Number of Funds = 2,394 -30% 1 201 401 601 801 1001 1201 1401 1601 1801 2001 2201 Number of US Mutual Funds—placement in order of 10 Year Annualized Performance Subsequent Period: January 2007–December 2011 Surviving Funds as of December 2011 (1,784) 15% Funds with no data as December 2011 (610) 5 Year Annualized Return: S&P 500 Index 10% 5% 2007–2011 0% -5% -10% S&P 500 Index: -0.25% -15% -20% -25% Number of Surviving Funds = 1,784 1 201 401 601 801 1001 1201 1401 1601 1801 2001 2201 Subsequent 5 year performance of US Mutual Funds (same ordering as initial 10 year period) For illustrative purposes only. Most recent 5-year period was chosen; then the preceding 10-year period. Mutual funds were placed in descending order of 10-year annualized performance, and subsequent 5-year performance assumes the same ordering as the 10-year period. The number of funds for the subsequent 5-year period represent existing funds from the 10-year period. Eligible universe is all share classes of US Stock mutual funds in the US Large Value Morningstar category with a ten-year annualized return as of Dec 31, 2006, in Morningstar Direct 3.11. Sources: Mutual fund universe statistical data and non-Dimensional money managers’ fund data provided by Morningstar, Inc.; Russell data copyright © Russell Investment Group 1995–2012, all rights reserved. Indices are not available for direct investment; therefore, their performance does not reflect the expenses associated with the management of an actual portfolio. Past performance is no guarantee of future results, and there is always the risk that an investor may lose money.
- 4. ME1170.2 Persistence in Performance US Large Value Mutual Funds First Period: January 1997–December 2006 14% Russell 1000 Value Index: 11.00% Funds that Outperformed Russell 1000 Value Index (9) 10 Year Annualized Return 12% Funds that Underperformed Russell 1000 Value Index (343) 10% Number of Funds = 352 1997–2006 8% 6% 4% 2% 0% 1 28 55 82 109 136 163 190 217 244 271 298 325 352 Number of US Large Value Funds—placement in order of 10 Year Annualized Performance Subsequent Period: January 2007–December 2011 15% Surviving Funds as of December 2011 (261) Funds with no data as December 2011 (91) 5 Year Annualized Return Russell 1000 Value Index 10% Number of Surviving Funds = 261 2007-2011 5% 0% -5% Russell 1000 Value Index: -2.64% -10% 1 28 55 82 109 136 163 190 217 244 271 298 325 352 Subsequent 5 year performance of US Large Value Funds (same ordering as initial 10 year period) For illustrative purposes only. Most recent 5-year period was chosen; then the preceding 10-year period. Mutual funds were placed in descending order of 10-year annualized performance, and subsequent 5-year performance assumes the same ordering as the 10-year period. The number of funds for the subsequent 5-year period represent existing funds from the 10-year period. Eligible universe is all share classes of US Stock mutual funds in the US Large Value Morningstar category with a ten-year annualized return as of Dec 31, 2006, in Morningstar Direct 3.11. Sources: Mutual fund universe statistical data and non-Dimensional money managers’ fund data provided by Morningstar, Inc.; Russell data copyright © Russell Investment Group 1995–2012, all rights reserved. Indices are not available for direct investment; therefore, their performance does not reflect the expenses associated with the management of an actual portfolio. Past performance is no guarantee of future results, and there is always the risk that an investor may lose money.
- 5. ME1170.2 Persistence in Performance US Small Value Mutual Funds First Period: January 1997–December 2006 20% Funds that Outperformed Russell 2000 Value Index (5) Russell 2000 Value Index: 13.27% Funds that Underperformed Russell 2000 Value Index (74) 10 Year Annualized Return 16% Number of Funds = 79 1997–2006 12% 8% 4% 0% 1 6 11 16 21 26 31 36 41 46 51 56 61 66 71 76 Number of US Small Value Funds—placement in order of 10 Year Annualized Performance Subsequent Period: January 2007–December 2011 Surviving Funds as of December 2011 (68) Funds with no data as December 2011 (11) 8% 5 Year Annualized Return Russell 2000 Value Index 6% 2007–2011 4% 2% 0% -2% Russell 2000 Value Index: -1.87% Number of Surviving Funds = 68 -4% 1 6 11 16 21 26 31 36 41 46 51 56 61 66 71 76 Subsequent 5 year performance of US Small Value Funds (same ordering as initial 10 year period) For illustrative purposes only. Most recent 5-year period was chosen; then the preceding 10-year period. Mutual funds were placed in descending order of 10-year annualized performance, and subsequent 5-year performance assumes the same ordering as the 10-year period. The number of funds for the subsequent 5-year period represent existing funds from the 10-year period recognizable by ticker. Eligible universe is all share classes of US Stock mutual funds in the US Small Value Morningstar category with a ten-year annualized return as of Dec 31, 2006, in Morningstar Direct 3.11. Sources: Mutual fund universe statistical data and non-Dimensional money managers’ fund data provided by Morningstar, Inc.; Russell data copyright © Russell Investment Group 1995–2012, all rights reserved. Indices are not available for direct investment; therefore, their performance does not reflect the expenses associated with the management of an actual portfolio. Past performance is no guarantee of future results, and there is always the risk that an investor may lose money.