LSS'11: Charting Collections Of Connections In Social Media
•Download as PPTX, PDF•
1 like•811 views

Keynote Title: Charting Collections of Connections in Social Media: Creating Maps and Measures with NodeXL Abstract: Networks are a data structure common found across all social media services that allow populations to author collections of connections. The Social Media Research Foundation‘s NodeXL project makes analysis of social media networks accessible to most users of the Excel spreadsheet application. With NodeXL, Networks become as easy to create as pie charts. Applying the tool to a range of social media networks has already revealed the variations present in online social spaces. A review of the tool and images of Twitter, flickr, YouTube, and email networks will be presented.

Recommended
Recommended
More Related Content
What's hot
What's hot (20)
Viewers also liked
Similar to LSS'11: Charting Collections Of Connections In Social Media
Similar to LSS'11: Charting Collections Of Connections In Social Media (20)
More from Local Social Summit
More from Local Social Summit (20)
Recently uploaded
Recently uploaded (20)
LSS'11: Charting Collections Of Connections In Social Media
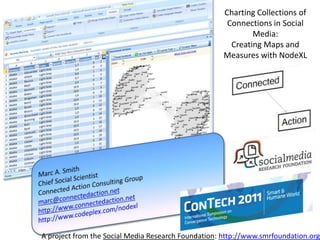
- 1. Charting Collections of Connections in Social Media: Creating Maps and Measures with NodeXL A project from the Social Media Research Foundation: http://www.smrfoundation.org
- 2. About Me Introductions Marc A. Smith Chief Social Scientist Connected Action Consulting Group Marc@connectedaction.net http://www.connectedaction.net http://www.codeplex.com/nodexl http://www.twitter.com/marc_smith http://delicious.com/marc_smith/Paper http://www.flickr.com/photos/marc_smith http://www.facebook.com/marc.smith.sociologist http://www.linkedin.com/in/marcasmith http://www.slideshare.net/Marc_A_Smith http://www.smrfoundation.org
- 3. Social Media (email, Facebook, Twitter, YouTube, and more) is all about connections from people to people. 3
- 4. Patterns are left behind 4
- 5. There are many kinds of ties…. Like, Link, Reply, Rate, Review, Favorite, Friend, Follow, Edit, Tag, Comment… http://www.flickr.com/photos/stevendepolo/3254238329
- 6. Each contains one or more social networks World Wide Web
- 7. Hubs
- 8. Bridges
- 13. Social Network Theory http://en.wikipedia.org/wiki/Social_network • Central tenet – Social structure emerges from – the aggregate of relationships (ties) – among members of a population • Phenomena of interest – Emergence of cliques and clusters – from patterns of relationships – Centrality (core), periphery (isolates), Source: Richards, W. – betweenness (1986). The NEGOPY • Methods network analysis program. Burnaby, BC: – Surveys, interviews, observations, Department of Communication, Simon log file analysis, computational Fraser University. pp.7- analysis of matrices 16 (Hampton &Wellman, 1999; Paolillo, 2001; Wellman, 2001)
- 14. SNA 101 • Node A – “actor” on which relationships act; 1-mode versus 2-mode networks • Edge B – Relationship connecting nodes; can be directional C • Cohesive Sub-Group – Well-connected group; clique; cluster A B D E • Key Metrics – Centrality (group or individual measure) D • Number of direct connections that individuals have with others in the group (usually look at incoming connections only) E • Measure at the individual node or group level – Cohesion (group measure) • Ease with which a network can connect • Aggregate measure of shortest path between each node pair at network level reflects average distance – Density (group measure) • Robustness of the network • Number of connections that exist in the group out of 100% possible – Betweenness (individual measure) F G • # shortest paths between each node pair that a node is on • Measure at the individual node level • Node roles – Peripheral – below average centrality C H – Central connector – above average centrality D I – Broker – above average betweenness E
- 17. Welser, Howard T., Eric Gleave, Danyel Fisher, and Marc Smith. 2007. Visualizing the Signatures of Social Roles in Online Discussion Groups. The Journal of Social Structure. 8(2). Experts and “Answer People” Discussion people, Topic setters Discussion starters, Topic setters
- 18. Now Available
- 19. Analogy: Clusters Are Occluded Hard to count nodes, clusters
- 20. Separate Clusters Are More Comprehensible
- 21. Twitter Network for “Microsoft Research” *BEFORE*
- 22. Twitter Network for “Microsoft Research” *AFTER*
- 23. Goal: Make SNA easier • Existing Social Network Tools are challenging for many novice users • Tools like Excel are widely used • Leveraging a spreadsheet as a host for SNA lowers barriers to network data analysis and display
- 24. Who we are People Disciplines Institutions University Computer Science University of Maryland Faculty Students HCI, CSCW Oxford Internet Institute Industry Machine Learning Stanford University Independent Information Visualization Microsoft Research Researchers UI/UX Illinois Institute of Technology Developers Social Science/Sociology Connected Action Network Analysis Cornell Collective Action Morningside Analytics
- 25. Social Media Research Foundation http://smrfoundation.org
- 26. What we are trying to do: Open Tools, Open Data, Open Scholarship • Build the “Firefox of GraphML” – open tools for collecting and visualizing social media data • Connect users to network analysis – make network charts as easy as making a pie chart • Connect researchers to social media data sources • Archive: Be the “Allen Very Large Telescope Array” for Social Media data – coordinate and aggregate the results of many user’s data collection and analysis • Create open access research papers & findings • Make “collections of connections” easy for users to manage
- 27. What we have done: Open Tools • NodeXL • Data providers (“spigots”) – ThreadMill Message Board – Exchange Enterprise Email – Voson Hyperlink – SharePoint – Facebook – Twitter – YouTube – Flickr
- 28. What we have done: Open Data • NodeXLGraphGallery.org – User generated collection of network graphs, datasets and annotations – Collective repository for the research community – Published collections of data from a range of social media data sources to help students and researchers connect with data of interest and relevance
- 29. What we have done: Open Scholarship
- 30. What we have done: Open Scholarship
- 32. Twitter Networks: connections among the people who tweeted the term “Kpop” on 24 October 2011
- 33. NodeXL data import sources
- 34. Example NodeXL data importer for Twitter
- 35. NodeXL imports “edges” from social media data sources
- 36. NodeXL Automation makes analysis simple and fast
- 38. NodeXL simplifies mapping data attributes to display attributes
- 39. NodeXL displays subgraph images along with network metadata
- 40. NodeXL enables filtering of networks
- 41. NodeXL Generates Overall Network Metrics
- 42. What we want to do: (Build the tools to) map the social web • Move NodeXL to the web: – Node for Google Doc Spreadsheets! – WebGL Canvas • Connect to more data sources of interest: – RDF, MediaWikis, Gmail, NYT, Citation Networks • Solve hard network manipulation UI problems: – Modal transform, Time series, Automated layouts • Grow and maintain archives of social media network data sets for research use. • Improve network science education: – Workshops on social media network analysis – Live lectures and presentations – Videos and training materials
- 43. Work Items Autofill Group Attribute Merge Edges by Attribute Modal Transform Merge Workbooks Automated Dynamic Filters: Time Series Analysis, contrast Captions and Legends Upload to Graph Gallery++: captions, workbook Graph Gallery++ User Accounts, Reporting, RSS Feeds, Network Visualization Web Canvas Import: RDF, Wiki, SharePoint, Keyword networks from text Metrics: Triad Census Layouts: Force Atlas 2, Lin Log, “Bakshy Plots”, Quality Measures Query-by-example search for network structures
- 44. How you can help • Sponsor a feature • Sponsor Webshop 2012 • Sponsor a student • Schedule training • Sponsor the foundation • Donate your money, code, computation, storage, bandwidth, d ata or employee’s time • Help promote the work of the Social Media Research Foundation
- 45. Contact: Marc A. Smith Chief Social Scientist Connected Action Consulting Group Marc@connectedaction.net http://www.connectedaction.net http://www.codeplex.com/nodexl http://www.twitter.com/marc_smith http://delicious.com/marc_smith/Paper http://www.flickr.com/photos/marc_smith http://www.facebook.com/marc.smith.sociologist http://www.linkedin.com/in/marcasmith http://www.slideshare.net/Marc_A_Smith http://www.smrfoundation.org
- 46. Charting Collections of Connections in Social Media: Creating Maps and Measures with NodeXL A project from the Social Media Research Foundation: http://www.smrfoundation.org
Editor's Notes
- http://www.flickr.com/photos/library_of_congress/3295494976/sizes/o/in/photostream/
- http://www.flickr.com/photos/amycgx/3119640267/