
Recomendados
Más contenido relacionado
La actualidad más candente
La actualidad más candente (16)
Destacado
Similar a Zeus Feb07est
Similar a Zeus Feb07est (20)
Más de Luis Nassif
Más de Luis Nassif (20)
Último
Último (20)
Zeus Feb07est
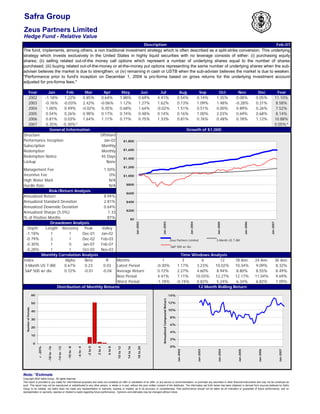
- 1. Safra Group Zeus Partners Limited Hedge Fund - Relative Value Description Feb-07 The fund, implements, among others, a non traditional investment strategy which is often described as a split-strike conversion. This underlying strategy which invests exclusively in the United States in highly liquid securities with no leverage consists of either: (i) purchasing equity shares; (ii) selling related out-of-the money call options which represent a number of underlying shares equal to the number of shares purchased; (iii) buying related out-of-the-money or at-the-money put options representing the same number of underlying shares when the sub- adviser believes the market is due to strengthen; or (iv) remaining in cash or USTB when the sub-adviser believes the market is due to weaken. *Performance prior to fund's inception on December 1, 2004 is pro-forma based on gross returns for the underlying investment account adjusted for pro-forma fees.* Year Jan Feb Mar Apr May Jun Jul Aug Sep Oct Nov Dec Year 2002 -1.18% 1.22% 0.85% 0.64% 1.88% 0.69% 4.41% 0.54% 0.14% 1.35% 0.08% 0.05% 11.10% 2003 -0.76% -0.03% 2.42% -0.06% 1.12% 1.27% 1.62% 0.13% 1.09% 1.48% -0.28% 0.31% 8.58% 2004 1.00% 0.49% -0.02% 0.35% 0.68% 1.64% -0.02% 1.51% 0.51% 0.00% 0.89% 0.26% 7.52% 2005 0.54% 0.26% 0.98% 0.17% 0.74% 0.48% 0.14% 0.16% 1.00% 2.03% 0.69% 0.68% 8.14% 2006 0.81% 0.03% 1.64% 1.11% 0.77% 0.75% 1.33% 0.81% 0.76% 0.48% 0.78% 1.12% 10.88% 2007 0.35% -0.30%* 0.05%* General Information Growth of $1,000 Structure Offshore Performance Inception Jan-02 $1,800 Subscription Monthly $1,600 Redemption Monthly Redemption Notice 45 Days $1,400 Lockup None $1,200 Management Fee 1.50% Incentive Fee 0% $1,000 High Water Mark N/A $800 Hurdle Rate N/A Risk/Return Analysis $600 Annualized Return 8.94% Annualized Standard Deviation 2.81% $400 Annualized Downside Deviation 0.64% $200 Annualized Sharpe (5.0%) 1.33 % of Positive Months 87% $0 Drawdown Analysis Jan-2002 Jan-2003 Jan-2004 Jan-2005 Jan-2006 Jan-2007 Depth Length Recovery Peak Valley -1.18% 1 1 Dec-01 Jan-02 -0.79% 2 1 Dec-02 Feb-03 Zeus Partners Limited .3-Month US T-Bill -0.30% 1 0 Jan-07 Feb-07 .S&P 500 w/ div. -0.28% 1 1 Oct-03 Nov-03 Monthly Correlation Analysis Time Windows Analysis Index Alpha Beta R Months 1 3 6 12 18 Ann. 24 Ann. 36 Ann. .3-Month US T-Bill 0.67% 0.23 0.03 Latest Period -0.30% 1.17% 3.23% 10.02% 10.34% 9.09% 8.32% .S&P 500 w/ div. 0.72% -0.01 -0.04 Average Return 0.72% 2.27% 4.60% 8.94% 8.80% 8.55% 8.49% Best Period 4.41% 7.11% 10.03% 12.27% 12.17% 11.04% 9.69% Worst Period -1.18% -0.74% 0.82% 5.24% 6.34% 6.82% 7.09% Distribution of Monthly Returns 12 Month Rolling Return 60 14% Annualized Compound Return 12% 50 Number of Periods 10% 40 8% 30 6% 20 4% 10 2% 0 0% < -20% -18 to -16 -14 to -12 -10 to -8 -6 to -4 -2 to 0 2 to 4 6 to 8 10 to 12 14 to 16 18 to 20 Jan-2002 Jan-2003 Jan-2004 Jan-2005 Jan-2006 Jan-2007 Note: *Estimate Copyright 2005 Safra Group. All rights reserved This report is provided to you solely for informational purposes and does not constitute an offer or solicitation of an offer, or any advice or recommendation, to purchase any securities or other financial instruments and may not be construed as such. This report may not be reproduced or redistributed to any other person, in whole or in part, without the prior written consent of the distributor. The information set forth herein has been obtained or derived from sources believed by Safra Group to be reliable, but Safra does not make any representation or warranty, express or implied, as to its accuracy or completeness. Past performance should not be taken as an indication or guarantee of future performance, and no representation or warranty, express or implied is made regarding future performance. Opinions and estimates may be changed without notice.