SlideShare una empresa de Scribd logo
1 de 18
Descargar para leer sin conexión
AEO2014 Early Release Overview
Executive summary
Projections in the Annual Energy Outlook 2014 (AEO2014) Reference case focus on the factors that shape U.S. energy markets
through 2040, under the assumption that current laws and regulations remain generally unchanged throughout the projection
period. The early release provides a basis for the examination and discussion of energy market trends and serves as a starting point
for analysis of potential changes in U.S. energy policies, rules, or regulations or possible technology breakthroughs. Readers are
encouraged to review the full range of cases that will be presented when the complete AEO2014 is released in 2014, exploring key
uncertainties in the Reference case.
Major highlights of the AEO2014 Reference case include:
Growing domestic production of natural gas and crude oil continues to reshape the U.S. energy economy, with crude oil
production approaching the historical high achieved in 1970 of 9.6 million barrels per day
Ongoing improvements in advanced technologies for crude oil and natural gas production continue to lift domestic supply and
reshape the U.S. energy economy. Domestic production of crude oil (including lease condensate) increases sharply in the AEO2014
Reference case, with annual growth averaging 0.8 million barrels per day (MMbbl/d) through 2016, when it totals 9.5 MMbbl/d
(Figure 1). While domestic crude oil production is expected to level off and then slowly decline after 2020 in the Reference case,
natural gas production grows steadily, with a 56% increase between 2012 and 2040, when production reaches 37.6 trillion cubic
feet (Tcf).The full AEO2014 will include cases that represent alternative oil and natural gas resource and technology assumptions.
Low natural gas prices boost natural gas-intensive industries
Industrial shipments grow at a 3.0% annual rate over the first 10 years of the projection and then slow to 1.6% annual growth for the
rest of the projection. Bulk chemicals and metals-based durables account for much of the increased growth in industrial shipments
in AEO2014. Industrial shipments of bulk chemicals, which benefit from an increased supply of natural gas liquids, grow by 3.4%
per year from 2012 to 2025 in AEO2014, as compared with 1.9% in the Annual Energy Outlook 2013 (AEO2013) Reference case. The
projection assumes growing competition from abroad that flattens output growth in energy-intensive industries after 2030.
The higher level of industrial shipments leads to more natural gas consumption (including lease and plant fuel) in the U.S. industrial
sector, increasing from 8.7 quadrillion British thermal units (Btu) in 2012 to 10.6 quadrillion Btu in 2025 in AEO2014, compared to
9.8 quadrillion Btu in 2025 in AEO2013.
Light-duty vehicle energy use declines sharply, reflecting slow growth in vehicle miles traveled and accelerated improvement in
vehicle efficiency
AEO2014 includes a new, detailed demographic profile of driving behavior by age and gender as well as new lower population
growth rates based on updated U.S. Census Bureau projections. As a result, annual increases in vehicle miles traveled (VMT)
for light-duty vehicles (LDVs) in the AEO2014 Reference case average 0.9% from 2012 to 2040, compared to 1.2% per year in
AEO2013 over the same period. The rising fuel economy of LDVs more than offsets the modest growth in VMT, and LDV energy
consumption declines in the AEO2014 Reference case from 16.0 quadrillion Btu in 2012 to 12.1 quadrillion Btu in 2040, as compared
with the AEO2013 total of 13.0 quadrillion Btu in 2040 (Figure 2). The full AEO2014 will include an Issues in Focus discussion of
VMT projections that addresses the implications of alternative VMT scenarios.

Figure 1. U.S. petroleum and other liquid fuels supply
by source, 1970-2040 (million barrels per day)
2012

History

25

Projections

20

20

15

40%

Net petroleum and
biofuel imports 32%
Other

10

12%
13%
12%

5

0
1970

12%

1990

2000

2010

History

2012

Projections

15

AEO2013
AEO2014

10

Natural gas plant
liquids 16%
Tight oil production 17%

23% Crude oil production 23%
(excluding tight oil
1980

Figure 2. Energy consumption by light-duty vehicles
in the United States, AEO2013 and AEO2014,
1995-2040 (quadrillion Btu)

2020

2030

2040

5

0
1995 2000 2005 2010 2015 2020 2025 2030 2035 2040

U.S. Energy Information Administration | Annual Energy Outlook 2014 Early Release Overview

1
AEO2014 Early Release Overview
Natural gas overtakes coal to provide the largest share of U.S. electric power generation
Projected low prices for natural gas make it a very attractive fuel for new generating capacity. In some areas, natural gas-fired
generation replaces generation formerly supplied by coal and nuclear plants. In 2040, natural gas accounts for 35% of total
electricity generation, while coal accounts for 32% (Figure 3). Generation from renewable fuels, unlike coal and nuclear power,
is higher in the AEO2014 Reference case than in AEO2013. Electric power generation with renewables is bolstered by legislation
enacted at the beginning of 2013 extending tax credits for various renewable technologies; which was passed after the AEO2013
Reference case had been completed, but was considered in an alternative case in AEO2013. The full AEO2014 will include a variety
of cases addressing the implications of alternative market conditions and policies for the electricity generation mix.
Higher natural gas production also supports increases in exports of both pipeline and liquefied natural gas
In addition to increases in domestic consumption in the industrial and electric power sectors, U.S. exports of natural gas also
increase in the AEO2014 Reference case (Figure 4). U.S. exports of liquefied natural gas (LNG) increase to 3.5 Tcf in 2029 and
remain at that level through 2040. Pipeline exports of U.S. natural gas to Mexico grow by 6% per year, from 0.6 Tcf in 2012 to 3.1
Tcf in 2040, and pipeline exports to Canada grow by 1.2% per year, from 1.0 Tcf in 2012 to 1.4 Tcf in 2040. Over the same period,
U.S. pipeline imports from Canada fall by 30%, from 3.0 Tcf in 2012 to 2.1 Tcf in 2040, as more U.S. demand is met by domestic
production. Projected exports are sensitive to assumptions regarding conditions in U.S. and global natural gas markets. The full
AEO2014 will include cases that illustrate the sensitivity of projected natural gas exports to alternative resource, economic, and
price scenarios.
With strong growth in domestic crude oil and natural gas production, U.S. use of imported fuels falls sharply
In the AEO2014 Reference case, U.S. domestic energy production increases from 79.1 quadrillion Btu in 2012 to 102.1 quadrillion
Btu in 2040, and net use of imported energy sources, which was 30% in 2005, falls from 16% of total consumption in 2012 to
4% in 2040. In the AEO2013 Reference case, domestic energy production reached a total of 98.5 quadrillion Btu, and energy
imports is projected to decline as a percentage of consumption to 9% in 2040. The larger increase in domestic energy production
in AEO2014 is primarily a result of higher projections of production of natural gas and biomass/other renewables. Crude oil
production (including lease condensate) increases from 13.9 quadrillion Btu in 2012 to a peak of 20.5 quadrillion Btu in 2019
before dropping to 16.0 quadrillion Btu in 2040.
With domestic crude oil production rising to 9.5 MMbbl/d in 2016, the import share of U.S. petroleum and other liquids supply
falls to about 25%. Domestic production begins to decline after 2019, and the import share of total petroleum and other liquids
supply grows to 32% in 2040, still lower than the 2040 level of 37% in the AEO2013 Reference case. The alternative cases in the
full AEO2014 will illustrate how different assumptions about resources, markets, and policies can dramatically impact projections
of import dependence.
Improved efficiency of energy use in the residential and transportation sectors and a shift away from carbon-intensive fuels for
electricity generation keep U.S. energy-related carbon dioxide emissions below their 2005 level through 2040
In the AEO2014 Reference case, total U.S. energy-related emissions of carbon dioxide (CO2) remain below the 2005 level in
every year through 2040. Projected emissions in 2020 and 2040 are, respectively, about 9% and 7% below the 2005 level.
In AEO2014, CO2 emissions associated with U.S. industrial activity (including CO2 emissions associated with the generation
of electricity used in the industrial sector) begin to surpass emissions from the transportation sector in the middle of the next

Figure 3. Electricity generation from natural gas and
coal, 2005-40 (trillion kilowatthours)
2,500

History 2012

Projections

Figure 4. U.S. natural gas imports and exports,
2000-40 (trillion cubic feet)
8

History 2012

6

Natural gas
1,000

LNG exports
from lower 48 States

0

1,500

Exports to Canada

2

Coal

Exports to Mexico

4

2,000

Alaska LNG exports
Imports from Canada

-2
500

0
2005

2

Projections

LNG imports

-4

2010

2015

2020

2025

2030

2035

2040

-6
2000

2005

2010

2015

2020

2025

2030

U.S. Energy Information Administration | Annual Energy Outlook 2014 Early Release Overview

2035

2040
AEO2014 Early Release Overview
decade for the first time since the late 1990s. In the transportation sector, as a result of new fuel economy standards, biofuel
mandates, and shifts in consumer behavior, emissions from transportation sector use of petroleum and other liquids generally
decline or remain stable from 2012 through 2040. Emissions from energy use in the commercial sector increase more rapidly
than in the residential sector, and in 2040 emissions from these two sectors are about equal. In the electric power sector, CO2
emissions from coal combustion decline after 2029 as more power plants are fueled by lower-carbon fuels, including natural gas
and renewables. However, the lower level of CO2 emissions in the electric power sector because of the reduced role for coal is
partially offset by less projected generation from nuclear power. Generation from nuclear power in AEO2014 is 10% below levels in
AEO2013 in 2040 as a result of increased nuclear plant retirements.
Projected growth in real gross domestic product is slightly slower than in AEO2013, but projected per capita GDP and disposable
income are higher than in AEO2013 because of a reduced projection for U.S. population growth
Annual growth of real gross domestic product (GDP) from 2012 to 2040 averages 2.4% in the AEO2014 Reference case, slightly
below the AEO2013 Reference case growth rate over the same period. However, industrial output growth is higher in AEO2014,
averaging 2.1% per year from 2012 to 2040. Industries that supply equipment for increased natural gas production, as well as
industries benefitting from lower natural gas prices, account for much of the higher growth in manufacturing. On a per capita
basis, projected annual growth rates for real GDP and disposable income in AEO2014, both averaging 1.7% per year, are above the
comparable rates in AEO2013, reflecting lower projected population growth rate estimates (0.7% in AEO2014 compared to 0.9%
in AEO2013) for the 2012-40 period provided by the U.S. Census Bureau.

Introduction
In preparing the AEO2014 Reference case, the U.S. Energy Information Administration (EIA) evaluated a wide range of trends
and issues that could have major implications for U.S. energy markets. This overview presents the AEO2014 Reference case and
compares it with the AEO2013 Reference case released in April 2013 (see Table 1 on pages 17-18). Because of the uncertainties
inherent in any energy market projection, the Reference case results should not be viewed in isolation. Readers are encouraged
to review the alternative cases when the complete AEO2014 publication is released, to gain perspective on how variations in key
assumptions can lead to different outlooks for energy markets.
To provide a basis against which alternative cases and policies can be compared, the AEO2014 Reference case generally assumes
that current laws and regulations affecting the energy sector remain unchanged throughout the projection (including the
implication that laws that include sunset dates do, in fact, expire at the time of those sunset dates). This assumption clarifies the
relationship of the Reference case to other AEO2014 cases and enables policy analysis with less uncertainty regarding unstated
legal or regulatory assumptions.
As in past editions, the complete AEO2014 will include additional cases, many of which reflect the effects of extending a variety
of current energy programs beyond their current expiration dates and the permanent retention of a broad set of programs that
currently are subject to sunset provisions. In addition to the alternative cases prepared for AEO2014, EIA has examined proposed
policies at the request of Congress over the past few years. Reports describing the results of those analyses are available on
EIA’s website.1
Key updates made for the AEO2014 Reference case include the following:
Macroeconomic
•	 Revised U.S. Census Bureau population projections. 2 The population projection for 2040 in the AEO2014 Reference case is
almost 6% below the 2040 projection used for the AEO2013 Reference case. Most of the revision in overall population growth
results from a lower projection for net international migration, with younger age groups showing the largest differences
from the earlier projection. The slower rate of population growth leads to less labor force growth, which contributes to
slower GDP growth.
Residential, commercial, and industrial
•	 Revised base year residential equipment stocks and energy consumption for space heating, space cooling, and water heating,
based on data from EIA’s 2009 Residential Energy Consumption Survey (RECS), the most recent data available. 3 Estimates of
appliance stocks and energy consumption for several miscellaneous electric loads also were updated, based on a report by
Navigant Consulting Inc., to better reflect recent changes and trends in the residential sector.4
1

See “Congressional & Other Requests,” http://www.eia.gov/analysis/reports.cfm?t=138.
T
 he new population projections were released on December 12, 2012. See U.S. Department of Commerce, “U.S. Census Bureau Projections
Show a Slower Growing, Older, More Diverse Nation a Half Century from Now” (Washington, DC: December 12, 2012), http://www.census.gov/
newsroom/releases/archives/population/cb12-243.html.
3
U
 .S. Energy Information Administration, “Residential Energy Consumption Survey (RECS): 2009 RECS Survey Data, Public Use Microdata File
(Washington, DC: January 2013), http://www.eia.gov/consumption/residential/data/2009/index.cfm?view=microdata.
4
N
 avigant Consulting, Inc., Analysis and Representation of Miscellaneous Electric Loads in the National Energy Modeling System (NEMS) (Washington, DC:
May 2013), prepared for the U.S. Department of Energy, U.S. Energy Information Administration.
2

U.S. Energy Information Administration | Annual Energy Outlook 2014 Early Release Overview

3
AEO2014 Early Release Overview
•	 Updated and expanded representation of miscellaneous electric loads in the commercial sector, as well as personal computers
and data center servers, based on the Navigant report, reflecting recent and expected trends in electronics use.5
•	 Updated costs and improved representation of residential lighting applications, including wider representation of light emitting
diode (LED) lighting and outdoor lighting, based on the 2009 RECS and two U.S. Department of Energy (DOE) reports.6, 7
•	 Revised handling of the regional efficiency standard for residential furnaces, based on an ongoing legal appeal of the standard.
The regional standard scheduled to take effect in 2013 is not included in AEO2014 because of a court challenge and proposed
settlement that would vacate the standard in question and require DOE to develop new residential furnace standards.
•	 Revised commercial capacity factors governing annual usage of major end-use equipment, based on an EIA-contracted analysis.
•	 Updated manufacturing sector data to reflect the 2010 Manufacturing Energy Consumption Survey (MECS).8
•	 Revised outlook for industrial production to reflect the effects of increased shale gas production and lower natural gas prices,
resulting in faster growth for industrial production and energy consumption. The industries primarily affected include energyintensive bulk chemicals and primary metals, both of which provide products used by the mining and other downstream
industries such as fabricated metals and machinery. The bulk chemicals industry is also a major user of natural gas and,
increasingly, hydrocarbon gas liquid (HGL) feedstocks.9
•	 Expanded process flow models for the cement and lime industry and the aluminum industry, allowing technologies based on
energy efficiency to be incorporated, as well as enhancement of the cement model to include renewable fuels.
Transportation
•	 Implemented a new approach to VMT projections for LDVs, based on an analysis of VMT by age cohorts and the aging of the
driving population over the course of the projection, which resulted in a significantly lower level of VMT growth after 2018
compared with AEO2013. On balance, demographic trends (such as an aging population and decreasing rates of licensing and
travel among younger age groups) combine with employment and income factors to produce a 30% increase in VMT from
2012 to 2040 in AEO2014 compared with 41% growth in AEO2013.
•	 Added LNG as a potential fuel choice for freight rail locomotives and domestic marine vessels, resulting in significant penetration
of natural gas as a fuel for freight rail (35% of freight rail energy consumption in 2040) but relatively minor penetration in
domestic marine vessels (2% of domestic marine energy consumption in 2040).
•	 Adopted a new approach for estimating freight travel demand by region and commodity for heavy-duty vehicles (HDVs), rail,
and domestic marine vessels, as well as updated fuel efficiencies for freight rail and domestic marine vessels.
•	 Updated handling of flex-fuel vehicle (FFV) fuel shares to better reflect consumer preferences and industry response. FFVs are
necessary to meet the renewable fuels standard (RFS), but the phase-out of corporate average fuel economy (CAFE) credits
for their sale, as well as limited demand from consumers, reduces their market penetration.
•	 Revised attributes for battery electric vehicles—including (1) product availability, (2) electric drive fuel efficiency, and (3) nonbattery system costs by vehicle size class, battery size, and added battery cost per kilowatthour based on vehicle power-toenergy ratio for vehicle type—applied to hybrid electric, plug-in hybrid electric, and all-electric vehicles.
Oil and natural gas production and product markets
•	 Revised network pricing assumptions based on benchmarking of regional natural gas hub prices to historical spot natural gas
prices, basing flow decisions on spot prices, setting variable tariffs based on historical spot natural gas price differentials, and
estimating the price of natural gas to the electric power sector off a netback from the regional hub prices.10
 5

N
 avigant Consulting, Inc., Analysis and Representation of Miscellaneous Electric Loads in the National Energy Modeling System (NEMS) (Washington,
DC: May 2013), prepared for the U.S. Department of Energy, U.S. Energy Information Administration.
 6
U
 .S. Department of Energy, Office of Energy Efficiency and Renewable Energy, Residential Lighting End-Use Consumption Study: Estimation Framework
and Initial Estimates (Washington, DC: December 2012), http://apps1.eere.energy.gov/buildings/publications/pdfs/ssl/2012_residential-lightingstudy.pdf.
 7
U
 .S. Department of Energy, Office of Energy Efficiency and Renewable Energy, 2010 U.S. Lighting Market Characterization (Washington, DC: January
2012), http://apps1.eere.energy.gov/buildings/publications/pdfs/ssl/2010-lmc-final-jan-2012.pdf.
 8
U
 .S. Energy Information Administration, “Manufacturing Energy Consumption Survey (MECS): 2010 MECS Survey Data” (Washington, DC: March
19, 2013), http://www.eia.gov/consumption/manufacturing/data/2010/.
 9
G
 rowing production of wet natural gas and lighter crude oil has focused attention on natural gas liquids (NGL). EIA has developed and adopted
a neutral term—“hydrocarbon gas liquid” (HGL)—to equate the supply (natural gas plant liquids [NGPL] + liquefied refinery gases [LRG]) and
market (NGL + refinery olefins) terms. For example, liquefied petroleum gas (LPG) is currently defined by EIA as ethane, propane, normal butane,
and isobutane and their olefins (ethylene, propylene, butylene, and isobutylene). This definition is inconsistent with definitions used by other
federal agencies, international organizations, and trade groups, in that it implies that all the products are in a liquid state (ethane typically is not)
and are used in the same way (higher-value olefins are used differently). Part of the HGL implementation redefines LPG to include only propane,
butane, and isobutane and to exclude ethane and refinery olefins. The tables included in AEO2014 have been relabeled to conform to this newly
adopted definition.
10
E
 stimating natural gas prices to the electricity generation sector based on hub prices, rather than the citygate prices as was done in prior years, is a
better reflection of current market conditions, in which many large natural gas consumers are outside the citygate.

4

U.S. Energy Information Administration | Annual Energy Outlook 2014 Early Release Overview
AEO2014 Early Release Overview
•	 Allowed secondary flows of natural gas out of the Middle Atlantic region to change dynamically in the model based on relative
prices, which enables a larger volume of natural gas from the Middle Atlantic’s Marcellus formation to supply neighboring regions.
•	 Developed the estimated ultimate recovery of tight oil and shale gas on the basis of county-level data.11
•	 Updated oil and gas supply module that explicitly reports technically recoverable resources of liquids in natural gas, enabling
estimation of dry and wet natural gas.
•	 Improved representation of the dynamics of U.S. gasoline and diesel exports versus U.S. demand, through adoption of
endogenous modeling.12
•	 Added representation of the U.S. crude oil distribution system (pipelines, marine, and rail), to allow crude oil imports to go
to logical import regions for transport to refineries, which enables crude imports and domestic production to move among
refining regions and keeps imports of Canadian crude oil from flowing directly to U.S. Gulf refiners.13
•	 Revised production outlook for nonpetroleum other liquids—gas-to-liquids, coal-to-liquids (CTL), biomass-to-liquids, and
pyrolysis14—with lower production levels than in AEO2013, as more recent experience with these emerging technologies
indicates higher costs than previously assumed.15
•	 Revised representation of CO2-enhanced oil recovery (EOR) that better integrates the electricity, oil and gas supply, and
refining modules.16
Electric power sector
•	 Revised approach to reserve margins, which are set by region on the basis of North American Electric Reliability Corporation/
Independent System Operator requirements,17 and capacity payments, which are calculated as a combination of levelized
costs for combustion turbines and the marginal value of capacity in the electricity model.
•	 Revised handling of spinning reserves, with the required levels set explicitly depending on the mix of generating technologies
used to meet peak demand by region, to allow better representation of capacity requirements and costs in regions or cases
with high penetration of intermittent loads.
•	 Revised assumptions concerning the potential for unannounced retirement of nuclear capacity in several regions to better reflect
the impact of rising operating costs and low electricity prices. Announced nuclear retirements are already incorporated as planned.
•	 Updated handling of Mercury and Air Toxics Standards (MATS)18 covering the electric power sector to reflect potential
upgrades of electrostatic precipitators, requirements for plants with dry scrubbers to employ fabric filters, and revised costs
for retrofits of dry sorbent injection and fabric filters.
•	 Updated treatment of the production tax credit (PTC) for eligible renewable electricity generation technologies—consistent
with the American Taxpayer Relief Act of 2012 (ATRA) passed in January 201319—including revision of PTC expiration dates
for each PTC-eligible technology to reflect the concept of projects being declared “under construction” as opposed to being
placed “in service” and extension of the expiration date of the PTC for wind generation projects by one year.

Economic growth
Macroeconomic projections in the Annual Energy Outlook (AEO) are trend projections, with no major shocks assumed and with
potential growth determined by the economy’s supply capability. Growth in aggregate supply depends on increases in the labor
force, growth of capital stocks, and improvements in productivity. Long-term demand growth depends on labor force growth,
11

A
 fter accounting for infrastructure constraints and general development patterns, oil and natural gas resources in “sweet spots” are developed
earlier than lower quality resources, based on net present value.
12
H
 igh U.S. crude oil production and low fuel costs have given U.S. refiners a competitive advantage over foreign refiners, as evidenced by high U.S.
refinery utilization and increasing U.S. exports of gasoline and diesel fuel.
13
O
 il imports from Canada now are required to go to Petroleum Administration for Defense District (PADD) 2 (Midwest: North Dakota, South
Dakota, Nebraska, Kansas, Oklahoma, Minnesota, Iowa, Missouri, Wisconsin, Illinois, Michigan, Indiana, Ohio, Kentucky, and Tennessee); PADD 4
(Rocky Mountain: Montana, Idaho, Wyoming, Utah, and Colorado); and PADD 5 (West Coast: Washington, Oregon, Nevada, California, Arizona,
Alaska, and Hawaii) for redistribution through the crude oil distribution infrastructure.
14
P
 yrolysis is defined as the thermal decomposition of biomass at high temperatures (greater than 400°F, or 200°C) in the absence of air.
15
E
 IA undertook detailed assessments of these technologies in order to characterize key parameters considered in the model, such as capital cost,
contingency factors, construction time, first year of operation, plant life, plant production capacity, efficiency, and feedstock and other operating costs.
16
W
 hen considering CO2 EOR, the oil and gas supply module assesses a location and the availability and price of CO2 from power plants and CTL
facilities. The electric power plants now consider the market size and prices for CO2 captured. The refining module assesses a location and the
availability and price of CO2 from CTL facilities. The power sector now assesses opportunities for plants equipped with carbon capture and storage,
as the CO2 produced at these facilities can be used for EOR operations. This enables the model to solve dynamically for the capture of CO2 and the
production of oil from anthropogenic CO2 EOR.
17
N
 orth American Electric Reliability Corporation, 2013 Summer Reliability Assessment (Atlanta, GA: May 2013), http://www.nerc.com/pa/RAPA/ra/
Reliability%20Assessments%20DL/2013SRA_Final.pdf.
18
U
 .S. Environmental Protection Agency, “Mercury and Air Toxics Standards (MATS),” http://www.epa.gov/mats.
19
U
 .S. House of Representatives, 112th Congress, Public Law 112-240, “American Taxpayer Relief Act of 2012,” Sections 401-412 (Washington, DC:
January 2, 2013), http://www.gpo.gov/fdsys/pkg/PLAW-112publ240/pdf/PLAW-112publ240.pdf.

U.S. Energy Information Administration | Annual Energy Outlook 2014 Early Release Overview

5
AEO2014 Early Release Overview
income growth, and population growth. AEO2014 uses the U.S. Census Bureau’s December 2012 middle population projection. The
U.S. Census Bureau revised its population projections primarily to reflect lower assumptions regarding international net migration.
In AEO2014, U.S. population is expected to grow at an annual rate of 0.7% from 2012 to 2040, or 0.2 percentage points lower than
the 0.9% average annual population growth rate in AEO2013. As shown in Figure 5, most of the change from AEO2013 to AEO2014
is in the younger age cohorts. Real GDP, labor force, and productivity in AEO2014 grow by average annual rates of 2.4%, 0.6%, and
1.8%, respectively, from 2012 to 2040.
Total industrial production growth (which includes manufacturing, construction, agriculture, and mining) in AEO2014 is higher than
projected in AEO2013, primarily as a result of more rapid growth in manufacturing output, with most of the difference accounted
for by machinery, transportation equipment, fabricated metals, and bulk chemicals. Those industries, in addition to being tradesensitive, supply equipment or raw materials used in oil and gas production or otherwise benefit from lower natural gas prices. In
2040, the manufacturing share of total gross output is 18% in AEO2014, compared with 16% in AEO2013.

Energy prices
Crude oil
Oil prices are influenced by several factors, including some that have mainly short-term impacts. Other factors, such as
expectations about future world demand for petroleum and other liquids and production decisions by the Organization of the
Petroleum Exporting Countries (OPEC), can affect prices over the longer term. Supply and demand in the world oil market are
balanced through responses to price movements, with considerable complexity in the evolution of underlying supply and demand
expectations. For petroleum and other liquids, the key determinants of long-term supply and prices can be summarized in four
broad categories: the economics of non-OPEC supply; OPEC investment and production decisions; the economics of other liquids
supply; and world demand for petroleum and other liquids.
Key assumptions driving global crude oil markets in the AEO2014 Reference case over the projection period include: average
economic growth of 1.9% per year for major U.S. trading partners20 and average economic growth of 4.0% per year for other
U.S. trading partners. Growth in petroleum and other liquids use occurs almost exclusively outside the Organization for
Economic Cooperation and Development (OECD) member countries, with 1.8% average annual growth in petroleum and other
liquids consumption by non-OECD countries, including significantly higher average annual consumption growth in both China
and India.
Petroleum and other liquids production in AEO2014 from non-OPEC countries, particularly the United States, increases to
levels above those in AEO2013. As a result, the OPEC market share declines to less than 40% in the near term before starting
to rise again after 2016. The Brent crude oil spot price decreases from $112 per barrel (bbl) in 2012 to $92/bbl in 2017 in
the Reference case (in 2012 dollars), then increases to $141/bbl in 2040 (or about $235/bbl in nominal dollars) as growing
demand leads to the development of more costly resources (Figure 6). However, those resources are not as costly to develop
as projected in AEO2013.

Figure 5. Comparisons of population growth by
projection period and age cohort in the AEO2014 and
AEO2013 Reference cases (AEO2014 growth minus
AEO2013 growth)
0.1
0.0

Total

Ages
0-4

Ages
5-21

Ages 16
and over

Ages
55-64

250

-0.2

-0.4
-0.5
-0.6
-0.7
20

History

2012

Projections

200

-0.1

-0.3

Figure 6. Average annual Brent spot crude oil prices
in three cases, 1987-2040 (2012 dollars per barrel)

150
Ages 65
and over
2035 to 2040
2030 to 2035
2025 to 2030
2020 to 2025
2015 to 2020
2012 to 2040

High Oil Price

100

Reference
Low Oil Price

50

0
1987

2000

2010

2020

Major trading partners include Australia, Canada, Switzerland, United Kingdom, Japan, Sweden, and the Eurozone.

6

U.S. Energy Information Administration | Annual Energy Outlook 2014 Early Release Overview

2030

2040
AEO2014 Early Release Overview
Petroleum and other liquids products
With lower crude oil prices and lower gasoline demand projected in the AEO2014 Reference case, the real end-use price of motor
gasoline in the United States declines to $3.03 per gallon (2012 dollars) in 2017, then rises to $3.90 per gallon in 2040 (compared
to $4.40 per gallon in 2040 in AEO2013). The end-use price of diesel fuel in the transportation sector follows a similar pattern,
dropping to $3.50 per gallon in 2017 and then rising to $4.73 per gallon in 2040 (compared to $5.03 per gallon in AEO2013).
Although both gasoline and diesel prices dip modestly in the early years of the projection period, they increase steadily thereafter.
The diesel share of total domestic petroleum and other liquids production rises, and the gasoline share falls, mostly as a result of
the greenhouse gas (GHG) and CAFE standards for LDVs beginning in model year 2017. Increasing demand for diesel puts pressure
on refiners to increase diesel yields and results in a rising difference between diesel prices and gasoline prices from 2017 to 2025.
Legislated targets for cellulosic fuels use mandated by the Energy Independence and Security Act of 2007 (EISA2007) are not
attained, as the U.S. Environmental Protection Agency (EPA)21 continues to make use of the flexibility provided in the statute to
adjust those requirements.
Natural gas
The Henry Hub spot price for natural gas in the AEO2014 Reference case is higher than projected in AEO2013 through 2037, with
price increases in the near term driven by faster growth of consumption in the industrial and electric power sectors and, later,
growing demand for export at LNG facilities. A sustained increase in production follows, leading to slower price growth over the
rest of the projection period.
The Henry Hub spot natural gas price in AEO2014 reaches $4.80 per million Btu (MMBtu) (2012 dollars) in 2018, which is 77 cents/
MMBtu higher than in AEO2013. The stronger near-term price growth is followed by a lagged increase in supply from producers,
eventually causing prices to settle at $4.38/MMBtu in 2020, which is still notably higher than in AEO2013.
After 2020, increases in natural gas spot prices are driven by continued but slower growth in U.S. demand and net exports. The
Henry Hub spot natural gas price rises to $7.65/MMBtu in 2040, an increase of $3.28 from 2020 but 4% below the 2040 price
projection in AEO2013. In AEO2014, production grows to 37.5 Tcf in 2040, compared with 33.1 Tcf in AEO2013. A price increase
starting in 2033 is far less pronounced than was projected in AEO2013, in part because the growth in net exports from the United
States slows significantly.
Regional spot price projections throughout the United States follow the same general pattern as the Henry Hub spot price.
However, the average Lower 48 spot price generally increases at a slightly slower rate than the Henry Hub spot price, because
regional production growth outside those areas that serve the Henry Hub is projected to be somewhat faster than the growth in
production that serves the Henry Hub.
Coal
The average minemouth price of coal increases by 1.4% per year in the AEO2014 Reference case, from $1.98/MMBtu in 2012 to
$2.96/MMBtu in 2040 (2012 dollars). The upward trend of coal prices primarily reflects an expectation that cost savings from
technological improvements in coal mining will be outweighed by increases in production costs associated with moving into
reserves that are more costly to mine. The upward trend in the minemouth price of coal in the AEO2014 Reference case is similar
to the trend in the AEO2013 Reference case, but the average price through the projection period in AEO2014 is generally lower,
primarily reflecting a lower price outlook for coking coal.
Relative to minemouth prices, the average delivered price of coal to all sectors (excluding exports) increases at a slightly slower
pace of 1.0% per year, from $2.60/MMBtu in 2012 to $3.43/MMBtu in 2040. The slower growth rate primarily reflects modest
growth in average coal transportation rates, which increase by 0.2% per year in AEO2014—from $0.83/MMBtu in 2012 to $0.89/
MMBtu in 2040—as a result of gradually increasing fuel costs and changes over time in the pattern of coal distribution.
U.S. coal exports, which have surged in recent years from 50 million short tons in 2005 to a record 126 million short tons (MMst)
in 2012, have become an increasingly important source of revenue for both U.S. coal producers and coal transportation companies
(primarily railroads and barge companies). In 2012, coal export revenues totaled about $15 billion, representing about 25% of all
U.S. coal revenues, despite the fact that coal exports in 2012 represented only 12% of total U.S. production (short tons). In the
AEO2014 Reference case, U.S. coal export prices increase by 1.2% per year, to $6.40/MMBtu in 2040.
Electricity
Following the decline of natural gas prices since 2008, real average delivered prices for electricity have dropped consistently
(although more gradually) since 2009, to 9.8 cents per kilowatthour (kWh) in 2012. Retail electricity prices are influenced by fuel
prices, and particularly by natural gas prices. However, the relationship between retail electricity prices and natural gas prices is
complex, and many factors influence the degree to which, and the timeframe over which, they are linked. Those factors include the
share of natural gas generation in a region, the level of costs associated with the electricity transmission and distribution systems,
21

U
 .S. Environmental Protection Agency, “2014 Standards for the Renewable Fuel Standard Program: Proposed Rule,” 40 CFR Part 80 [EPA-HQOAR-2013-0479; FRL-9900-90-OAR], RIN 2060-AR76, Federal Register, Vol. 78, No. 230 (Washington, DC: November 29, 2013), pp. 7173271784, http://www.gpo.gov/fdsys/pkg/FR-2013-11-29/pdf/2013-28155.pdf.

U.S. Energy Information Administration | Annual Energy Outlook 2014 Early Release Overview

7
AEO2014 Early Release Overview
the mix of competitive versus cost-of-service pricing, and the number of customers who purchase power directly from wholesale
power markets. As a result, it can take time for changes in fuel prices to affect electricity prices, and the impacts can vary from
region to region.
In the AEO2014 Reference case, electricity prices are higher throughout the projection than they were in the AEO2013 Reference
case. Natural gas prices for electricity generators are higher than those in AEO2013 in the first few years but fairly similar in the
long term. Reliance on natural gas-fired generation remains strong, as a result of additional near-term retirements of coal-fired
and nuclear capacity, and natural gas prices continue to influence electricity prices. In the long term, both natural gas prices
and electricity prices rise. Electricity prices, which in 2030 are 10.4 cents/kWh (2012 dollars) in the AEO2014 Reference case,
compared with 9.9 cents/kWh in the AEO2013 Reference case, continue rising to 11.1 cents/kWh in 2040 in AEO2014, compared
with 11.0 cents/kWh in the AEO2013 Reference case.
The AEO2014 Reference case includes an updated calculation of electricity prices in competitive regions that better represents
payments required to maintain reserve capacity, contributing to higher projected electricity prices relative to AEO2013. In addition,
the updated regional reserve margin requirements in AEO2014 generally are higher and thus more costly than those in AEO2013.

Delivered energy consumption by sector22
Transportation
Delivered energy consumption in the transportation sector declines from 26.7 quadrillion Btu in 2012 to 25.5 quadrillion Btu in
2040 in the AEO2014 Reference case (Figure 7) because of a significant decline in energy consumption by LDVs that more than
offsets growth in energy consumption for other modes. The decline in transportation sector delivered energy consumption is
markedly different from the historical trend of 1% average annual growth in transportation energy consumption from 1975 to
2012.23 Transportation energy consumption is considerably lower in AEO2014 than projected in the AEO2013 Reference case (27.1
quadrillion Btu in 2040) with energy consumption by nearly all transportation modes reduced in AEO2014 as a result of lower
macroeconomic indicators, higher energy efficiency, changing demographics, and a revised calculation of VMT.
LDV energy consumption declines in the AEO2014 Reference case from 16.0 quadrillion Btu in 2012 to 12.1 quadrillion Btu in
2040, compared with 13.0 quadrillion Btu in 2040 in the AEO2013 Reference case. GHG emission standards and CAFE standards
increase new LDV fuel economy through model year 2025 and beyond, with more fuel-efficient new vehicles gradually replacing
older vehicles on the road and raising the fuel efficiency of the LDV stock by an average of 2.0% per year, from 21.5 miles per gallon
(mpg) in 2012 to 37.2 mpg in 2040. The higher fuel economy of LDVs more than offsets increases in VMT that average 0.9% per
year from 2012 to 2040, a reduction from the AEO2013 projection that reflects changes in driving behavior related to changing
demographics. The average fuel economy of the vehicle stock is higher, and travel by LDVs is lower in AEO2014 than projected in
AEO2013. The large decline in LDV energy consumption in AEO2014 shrinks the LDV modal share of total transportation energy
consumption from 60% in 2012 to 47% in 2040.
LDVs powered by motor gasoline remain the dominant vehicle type in the AEO2014 Reference case, retaining a 78% share of
new LDV sales in 2040, down from their 82% share in 2012. The fuel economy of LDVs powered by motor gasoline continues
to increase, and advanced technology fuel efficiency
Figure 7. Delivered energy consumption by sector,
subsystems are added, such as micro hybridization, which
1980-2040 (quadrillion Btu)
is installed on 42% of new motor gasoline LDVs in 2040.
The numbers of LDVs powered by fuels other than gasoline,
History
2012
Projections
40
such as diesel, electricity, or E85, or equipped with hybrid
drive trains, such as plug-in hybrid or gasoline hybrid electric,
increase modestly from 18% of new sales in 2012 to 22% in
2040. Ethanol FFVs account for 11% of overall vehicle sales in
30
2040, followed by hybrid electric vehicles (excluding micro
Industrial
hybrids) at 5% of new sales in 2040, up from 3% in 2012,
diesel vehicles at 4% in 2040, up from 2% in 2012, and plugTransportation
20
in hybrid vehicles and electric vehicles at about 1% each, both
up from negligible shares in 2012. New vehicle sales shares
are generally similar in AEO2014 and AEO2013 but with
Residential
moderate variation. In AEO2013, the new vehicle sales share
10
of motor gasoline vehicles was 80% in 2040 (with 36% of
Commercial
those vehicles including micro hybridization), followed by 7%
for ethanol FFVs, 6% for hybrid electric, 3% for diesel, 2% for
0
plug-in hybrids, and 1% for electric vehicles. The differences
1980
1990
2000
2010
2020
2030
2040
from AEO2013 to AEO2014 result from different fuel prices,
22
23

The amount of energy delivered to the sector; no adjustment is made for the fuels consumed to produce electricity or district sources.
S
 .C. Davis, S.W. Diegel, and R.G. Boundy, Transportation Energy Data Book, ORNL-6989 (Edition 32 of ORNL-5198) (Oak Ridge, TN: July 2013),
Chapter 2, Table 2.1, “U.S. Consumption of Total Energy by End-Use Sector, 1973-2012.”

8

U.S. Energy Information Administration | Annual Energy Outlook 2014 Early Release Overview
AEO2014 Early Release Overview
updated manufacturer product offerings, changing technology attributes, and an updated view of consumer perceptions of
infrastructure availability for E85 vehicles.
Delivered energy demand for HDVs in AEO2014 increases from 5.3 quadrillion Btu in 2012 to 7.5 quadrillion Btu in 2040, similar
to the 2040 level of 7.6 quadrillion Btu in AEO2013, and represents the largest growth among all transportation modes. Growth in
industrial output in AEO2014 leads to solid growth in HDV VMT, averaging 1.9% per year from 2012 to 2040. HDV energy demand
is tempered somewhat by an average 0.5% annual increase in fuel economy from 2012 to 2040 as a result of GHG emission
and fuel efficiency standards for medium- and heavy-duty vehicles and engines. Competitive natural gas prices significantly
increase the demand for LNG and compressed natural gas in AEO2014, from an insignificant share in 2012 to 8% of HDV energy
consumption in 2040, which is less than the 13% share projected in AEO2013 because of the lower prices of competing fuels
in AEO2014. The rapid growth of energy consumption by HDVs in AEO2014 increases their modal share of total transportation
energy consumption from 20% in 2012 to 29% in 2040.
Energy demand for aircraft grows in the AEO2014 Reference case from 2.5 quadrillion Btu in 2012 to 2.7 quadrillion Btu in 2040,
which is less than the AEO2013 projection of 2.9 quadrillion Btu in 2040. Personal air travel (billion seat-miles) grows by an
average of 0.7% per year in AEO2014, but improved fuel efficiency (by an average of 0.5% per year) reduces the effect on energy
consumption. The difference between AEO2014 and AEO2013 stems from lower demand for personal air travel in AEO2014 as a
result of lower economic growth. The aircraft share of total transportation energy consumption in AEO2014 increases from 9%
in 2012 to 11% in 2040.
Energy consumption by marine vessels increases from 0.9 quadrillion Btu in 2012 to 1.0 quadrillion Btu in 2040 in AEO2014,
reflecting the impacts of increased foreign trade on international shipping and higher incomes on recreational boating. Pipeline
energy use rises modestly, from 0.7 quadrillion Btu in 2012 to 0.8 quadrillion Btu in 2040, as increasing volumes of natural gas are
produced but closer to end-use markets. Rail energy consumption remains nearly flat at 0.5 quadrillion Btu from 2012 to 2040 in
AEO2014, as a result of a plateau in coal shipments and increases in fuel efficiency, which offset growth in rail transportation of
other industrial commodities.
Other energy use in the transportation sector, which includes both lubricants and military energy use, increases from 0.8
quadrillion Btu in 2012 to 0.9 quadrillion Btu in 2040. Marine, pipeline, other transportation, and rail energy use all are relatively
minor pieces of the overall transportation energy consumption picture in AEO2014, each accounting for less energy demand than
in the AEO2013 projections, as a result of lower economic growth in the AEO2014 Reference case.
Industrial
Approximately one-third of total U.S. delivered energy in 2012, 23.6 quadrillion Btu, was consumed in the industrial sector, which
includes manufacturing, agriculture, construction, and mining. In the AEO2014 Reference case, total industrial delivered energy
consumption grows to 30.2 quadrillion Btu in 2040—1.5 quadrillion Btu, or 5%, higher than the AEO2013 Reference case projection.
The industrial sector becomes the largest energy consuming sector by 2018 and remains so for the rest of the projection period.
The growth rate for total industrial energy consumption in the AEO2014 Reference case is greater than in AEO2013 as a result of
lower natural gas prices, which boost industrial production, and greater availability of natural gas liquids (NGL).24 The industry
that consumes the most energy is bulk chemicals, where total energy consumption grows from 5.5 quadrillion Btu in 2012 to
7.0 quadrillion Btu in 2040. In the AEO2014 Reference case, energy consumption by the bulk chemicals industry in 2040 is 1.2
quadrillion Btu higher than projected in AEO2013.
Total manufacturing shipments in the AEO2014 Reference case also increase more rapidly than in the AEO2013 Reference case,
from $4.5 trillion in 2012 to $8.4 trillion in 2040, or 87%. The growth rate for shipments in energy-intensive manufacturing is onehalf the rate for non-energy-intensive manufacturing, reflecting the continuing shift toward less energy-intensive manufacturing,
such as transportation equipment, computers, and other durable metal goods. The rate of growth in all manufacturing industries
is higher from 2012 to 2025 than after 2025, as a result of increased international competition in the later years of the projection.
Shipments in the energy-intensive industries—refining, food, paper, bulk chemicals, glass, cement and lime, iron and steel, and
aluminum—grow from $1.6 trillion in 2012 to $2.3 trillion in 2040 in the AEO2014 Reference case, an annual rate of growth of
1.3%, compared to 1.0% in the AEO2013 Reference case. The rate of increase in AEO2014 is much faster from 2012 to 2025 (2.0%
per year) than from 2025 to 2040 (0.7% per year). Shipments of bulk chemicals, iron and steel, and aluminum peak in the late
2020s and decline thereafter, as export growth slows. Total energy consumption in the energy-intensive industries increases by
0.7% per year from 2012 to 2040, with almost all the growth occurring in the 2012-25 period.
Energy use for heat and power in the energy-intensive industries grows from 11.5 quadrillion Btu in 2012 to 13.1 quadrillion Btu in
2040, averaging 0.9% per year from 2012 to 2025 and 0.1% per year from 2025 to 2040. With energy intensity declining in the
energy-intensive industries, largely because of improvements in efficiency, the growth of energy use for heat and power is slower
than the growth of shipments. In the bulk chemicals and petroleum refining industries, demand for feedstocks—which include
HGL,25 petroleum (usually naphtha), and natural gas—grows by 1.3% per year on average, from 3.5 quadrillion Btu in 2012 to 5.0
24
25

Natural gas liquids include ethane, propane, normal butane, isobutane, and pentanes plus.
H
 GL includes NGL, ethane, propane, normal butane, isobutane, natural gasoline (pentanes plus), and olefins.

U.S. Energy Information Administration | Annual Energy Outlook 2014 Early Release Overview

9
AEO2014 Early Release Overview
quadrillion Btu in 2040, with average increases of 2.9% per year from 2012 to 2025 followed by a decline from 2025 to 2040
averaging 0.1% per year.
Only the bulk chemical industry uses liquid feedstocks (HGL and petrochemical feedstocks), which are used to produce organic
chemicals, inorganic chemicals, resins, synthetic rubber, and fibers. With demand for bulk chemicals higher in the AEO2014
Reference case than in AEO2013, consumption of liquid feedstocks also is higher in AEO2014. HGL feedstocks and petrochemical
feedstocks (naphtha and heavier inputs) often can be interchanged to some degree, depending on price and the product slate. In
the AEO2014 Reference case, HGL feedstock consumption totals 2.2 quadrillion Btu in 2012, 2.9 quadrillion Btu in 2025, and 2.7
quadrilion Btu in 2040; and petrochemical feedstock use totals 0.8 quadrillion Btu in 2012, 1.5 quadrillion Btu in 2025, and 1.6
quadrillion Btu in 2040.
Shipments from the nonenergy-intensive manufacturing sector increase by 2.7% per year from $2.9 trillion in 2012 to $6.1 trillion
in 2040 in the AEO2014 Reference case, with growth rates of 3.2% per year from 2012 to 2025 and 2.3% per year after 2025.
Energy consumption for nonenergy-intensive manufacturing grows from 3.6 quadrillion Btu in 2012 to 4.9 quadrillion Btu in 2040,
averaging 1.0% per year—the same rate as in the AEO2013 Reference case. In parallel with the growth of shipments, energy
consumption in the nonenergy-intensive manufacturing sector grows more rapidly from 2012 to 2025 (1.3% per year) than from
2025 to 2040 (0.8% per year).
In the nonmanufacturing industries—agriculture, construction, and mining—shipments grow by 1.6% per year from 2012 to 2040
in the AEO2014 Reference case, slightly less than the annual growth rate of 1.8% in the AEO2013 Reference case over the same
period. Growth in the AEO2014 Reference case averages 2.8% per year from 2012 to 2025 and slows to 0.7% per year after 2025.
Energy consumption by nonmanufacturing industries grows by 1.2% per year, from 4.8 quadrillion Btu in 2012 to 6.8 quadrillion
Btu in 2040. While energy intensity declines somewhat in the agriculture and construction industries, it increases in the mining
industry as exploration activities move over time to less desirable—and more energy-intensive—resources.
Residential
Residential delivered energy consumption remains roughly constant in the AEO2014 Reference case from 2012 to 2040. However,
consumption levels are lower than those in AEO2013 for most fuels. In addition to lower population growth projections, the lower
consumption levels in the AEO2014 Reference case are explained in part by incorporation of the 2009 RECS data, which include
characteristic information such as the mix of building types in each region of the country, equipment stocks, and appliance
saturation levels, as well as energy consumption estimates for three major end uses—space heating, space cooling, and water
heating. In addition, weather-related demand elasticities for heating and cooling also have been updated to better align AEO
projections with those in EIA’s Short-Term Energy Outlook.
The AEO2014 Reference case removes the 2013 federal efficiency standard for condensing gas furnaces, based on challenges to
the DOE rulemaking, first by an association of natural gas utilities and later by equipment distributors. Although natural gas use
tends to be lower when the standard is included, consumption in the AEO2014 Reference case (without the standard) is lower than
in AEO2013 (with the standard) through most of the projection period, largely because of changes in the end-use allocations from
the 2009 RECS.
An EIA-contracted report26 provides updated estimates of the installed stock and consumption of several miscellaneous electric
loads, including televisions, computers, and related equipment. This update generally resulted in lower electricity consumption for
these appliances than was projected in the AEO2013 Reference case.
For AEO2014, outdoor lighting was added to the residential model as a separate application. In addition, cost and performance
attributes for most residential lighting types were updated on the basis of EIA-contracted technology reports27 and market
studies from DOE. 28 Lower costs and wider availability of LEDs result in lower energy consumption after 2020 in AEO2014
relative to AEO2013.
Commercial
Commercial sector delivered energy consumption grows from 8.3 quadrillion Btu in 2012 to 10.2 quadrillion Btu in 2040 in the
AEO2014 Reference case, similar to the AEO2013 Reference case despite slower growth in the near term. Commercial electricity
consumption increases by 0.8% per year from 2012 to 2040 in AEO2014, lower than the 1.0% average annual growth in commercial
floorspace, in part because projected demand for cooling and lighting is lower than in AEO2013. Also, more rapid reductions in
energy use for personal computers than previously estimated, largely because of a shift to more efficient portable devices, result
in a projected 5.6% annual decline in electricity demand for commercial PC equipment in the AEO2014 Reference case. Following
26

N
 avigant Consulting, Inc., Analysis and Representation of Miscellaneous Electric Loads in NEMS (Washington, DC, May 2013), prepared for the U.S.
Department of Energy, U.S. Energy Information Administration.
27
U
 .S. Energy Information Administration, “Updated Buildings Sector Appliance and Equipment Costs and Efficiency” (Washington, DC: August 7,
2013), http://www.eia.gov/analysis/studies/buildings/equipcosts/.
28
U
 .S. Department of Energy, Energy Efficiency  Renewable Energy, Residential Lighting End-Use Consumption Study: Estimation Framework and Initial
Estimates (Washington, DC: December 2012), http://apps1.eere.energy.gov/buildings/publications/pdfs/ssl/2012_residential-lighting-study.
pdf, and 2010 U.S. Lighting Market Characterization (Washington, DC: January 2012), http://apps1.eere.energy.gov/buildings/publications/pdfs/
ssl/2010-lmc-final-jan-2012.pdf.

10

U.S. Energy Information Administration | Annual Energy Outlook 2014 Early Release Overview
AEO2014 Early Release Overview
slower-than-expected adoption of new data centers as a result of the recent recession, installations of new data center servers
increase more in AEO2014 than in AEO2013.
Growth of natural gas consumption in the commercial sector averages roughly 0.7% per year from 2012 to 2040, similar to the
AEO2013 Reference case.

Energy consumption by primary fuel
Total primary energy consumption grows by 12% in the AEO2014 Reference case, from 95 quadrillion Btu in 2012 to 106 quadrillion
Btu in 2040—1.3 quadrillion Btu less than in AEO2013 (Figure 8). The fossil fuel share of energy consumption falls from 82% in
2012 to 80% in 2040, as consumption of petroleum-based liquid fuels declines, largely as a result of slower growth in VMT and
increased vehicle efficiency.
Total U.S. consumption of petroleum and other liquids, which was 35.9 quadrillion Btu (18.5 MMbbl/d) in 2012, increases to 36.9
quadrillion Btu (19.5 MMbbl/d) in 2018, then declines to 35.4 quadrillion Btu (18.7 MMbbl/d) in 2034 and remains at that level
through 2040. Total consumption of domestically produced biofuels increases slightly through 2022 and then remains relatively
flat. Production of cellulosic biofuels is currently well under 1% of the EISA2007 targets.29 With the PTC for cellulosic biofuels
scheduled to expire at the end of 2013, production of cellulosic biofuels remains below the EISA2007 target through the projection
period. Within the transportation sector, which dominates demand for petroleum and other liquids, there is a shift from motor
gasoline (losing more than 10% of its share of total transportation petroleum and other liquids demand over the projection) to
distillate (gaining slightly less than 10% of the total). The increased use of compressed natural gas and LNG in vehicles also offsets
about 3% of petroleum and other liquids consumption in the transportation sector in 2040.
Domestic natural gas consumption in the AEO2014 Reference case rises from 25.6 Tcf in 2012 to 31.6 Tcf in 2040 (about 2.1 Tcf
higher than in the AEO2013 Reference case). The largest share of the growth is for electricity generation. Demand for natural gas in
the electric power sector increases from 9.3 Tcf in 2012 to 11.2 Tcf in 2040, with a portion of the growth attributable to the retirement
of 50 gigawatts of coal-fired capacity by 2021. Natural gas consumption in the industrial sector is also higher in AEO2014 than was
projected in AEO2013, as a result of the rejuvenation of the industrial sector as it benefits from surging shale gas production that is
accompanied by slower growth of natural gas prices. Industries such as bulk chemicals, which use natural gas as a feedstock, are
more strongly affected than others. In the residential sector, natural gas consumption declines throughout the projection.
Total coal consumption increases from 17.3 quadrillion Btu (891 MMst) in 2012 to 18.7 quadrillion Btu (979 MMst) in 2040 in the
AEO2014 Reference case. Coal consumption, mostly for electric power generation, falls off in 2016, the first year of the MATS.
After 2016, coal-fired electricity generation increases slowly over the next 10 years as the remaining coal-fired capacity is used
more intensively, but little capacity is added. Coal consumption in the electric power sector in 2040 is 17.3 quadrillion Btu (909
MMst) in the AEO2014 Reference case. This level is about 1.4 quadrillion Btu (75 MMst) lower than in the AEO2013 Reference
case. No coal is consumed for CTL technology in the AEO2014 Reference case.
With the implementation of the federal RFS for transportation fuels and state renewable portfolio standards for electricity
generation, consumption of marketed renewable fuels grows by 1.4% per year in the AEO2014 Reference case. Marketed renewable
energy includes wood, municipal waste, other biomass, and
Figure 8. U.S. primary energy consumption by fuel,
hydroelectricity in the end-use sectors; hydroelectricity,
geothermal, municipal solid waste, biomass, solar, and wind
1980-2040 (quadrillion Btu)
power in the electric power sector; and ethanol for gasoline
History
2012
Projections
120
blending and biomass-based diesel in the transportation
sector, of which 1.5 quadrillion Btu is included with petroleum
and other liquid fuels consumption in 2040. Excluding
100
hydroelectricity, renewable energy consumption in the
27%
Natural gas 30%
electric power sector grows from 1.9 quadrillion Btu in 2012
80
to 4.5 quadrillion Btu in 2040, with biomass accounting for
Renewables
8%
10%
27% of the growth and wind 39%. Generation of electricity
(excluding biofuels)
60
from solar photovoltaic energy shows the fastest growth,
18%
Coal 18%
starting from a small base and accounting for 7.5% of total
8%
Nuclear 8%
electricity generation from all nonhydropower renewable
40
1%
Liquid biofuels 2%
energy sources in 2040.
20
0
1980

Petroleum and
other liquids 32%

37%

1990

2000

2010

2020

2030

2040

Energy intensity
From 1992 to 2012, energy use per dollar of GDP declined on
average by 1.9% per year, in large part because of shifts within
the economy from manufactured goods to the service sectors,

29

B
 ased on 2010, 2011, 2012, and 2013 evaluations of the volumes of cellulosic biofuels available, EPA substantially reduced the cellulosic biofuels
obligation under the RFS for those years, with the 2013 obligation set at 6 million ethanol-equivalent gallons, less than 1% of the legislated target of
1 billion gallons.

U.S. Energy Information Administration | Annual Energy Outlook 2014 Early Release Overview

11
AEO2014 Early Release Overview
which use relatively less energy per dollar of GDP. The dollar-value increase in the service sectors (in constant dollar terms) was
almost 12 times the corresponding increase for the industrial sector over the same period. As a result, the share of total shipments
accounted for by the industrial sector fell from 30% in 1992 to 22% in 2012 (including a slight increase from 2009 to 2012). In
the AEO2014 Reference case, the industrial share of total shipments increases to 24% in 2016, after which it declines again, at a
very slow rate, to 23% in 2040. Energy use per 2005 dollar of GDP declines by 43% from 2012 to 2040 in AEO2014 as the result
of a continued shift from manufacturing to services (and, even within manufacturing, to less-energy-intensive manufacturing
industries), rising energy prices, and the adoption of policies that promote energy efficiency.
U.S. energy use per capita was fairly constant from 1990 to 2007 but began to fall after 2007. In the AEO2014 Reference case,
energy use per capita continues to decline as a result of improvements in energy efficiency (e.g., new appliance and CAFE
standards) and changes in the ways energy is used in the U.S. economy. Total U.S. population increases by 21% from 2012 to
2040, but energy use grows by only 12%, with energy use per capita declining by 8% from 2012 to 2040 (Figure 9).
CO2 emissions per 2005 dollar of GDP have historically tracked closely with energy use per dollar of GDP. In the AEO2014
Reference case, however, with lower-carbon fuels accounting for a growing share of total energy use, CO2 emissions per dollar of
GDP decline more rapidly than energy use per dollar of GDP, to 56% below their 2005 level in 2040 (or by 2.3% per year).

Energy production and imports
Net imports of energy decline both in absolute terms and as a share of total U.S. energy consumption in the AEO2014 Reference
case (Figure 10). The decline in energy imports reflects increased domestic production of petroleum and natural gas, along
with demand reductions resulting from rising energy prices
Figure 9. Energy use per capita, energy use per dollar
and gradual improvement in vehicle efficiency. At the same
of GDP, and emissions per dollar of GDP, 1980-2040
time, natural gas exports increase (as domestic supplies
(index, 2005=1)
increase and it becomes attractive to liquefy the natural gas
History 2005 2012
Projections
for export), along with exports of motor gasoline (as demand
2.0
declines and refiners are left with more than they can sell
domestically) and exports of crude oil (as lighter domestic
crude oil is swapped for the heavier crudes more commonly
1.5
run in modern refineries). The net import share of total U.S.
energy consumption is 4% in 2040, compared with 16% in
Energy use per 2005 dollar of GDP
2012 and about 30% in 2005.
1.0
Energy use per capita
0.5
CO2 emissions per 2005 dollar of GDP
0
1980

1990

2000

2010

2020

2030

2040

Figure 10. Total energy production and consumption,
1980-2040 (quadrillion Btu)
125

100

75

History

2012

Projections 2035
3% 4%

Consumption
Net imports

16%

120

History

2012

Projections

100
Natural gas
31%

60

38%

Renewables

12%

11%

50

40

1990

2000

2010

2020

2030

2040

Crude oil and
22% natural gas plant liquids 20%

20

25

12

Figure 11. U.S. energy production by fuel, 1980-2040
(quadrillion Btu)

80

Production

0
1980

Petroleum and other liquids
U.S. production of crude oil (including lease condensate) in
the AEO2014 Reference case increases from 6.5 MMbbl/d
in 2012 to 9.6 MMbbl/d in 2019, 22% higher than in
AEO2013 (Figure 11). Despite a decline after 2019, U.S. crude
oil production remains at or above about 7.5 MMbbl/d
through 2040. Higher production volumes result mainly
from increased onshore oil production, predominantly from
tight (very-low-permeability) formations. Offshore crude oil

26%

Coal

22%

10%

Nuclear

8%

0
1980

1990

2000

2010

2020

U.S. Energy Information Administration | Annual Energy Outlook 2014 Early Release Overview

2030

2040
AEO2014 Early Release Overview
provides a steady supply of domestic crude oil production, ranging between 1.6 and 2.0 MMbbl/d from 2015 through 2040,
as the pace of development activity quickens and new, large development projects, predominantly in the deepwater and ultradeepwater portions of the Gulf of Mexico, are brought into production.
The faster growth of tight oil production through 2020 in the AEO2014 Reference case results in higher domestic crude oil production
than in AEO2013 throughout the projection. The pace of oil-directed drilling in the near term is much stronger than in AEO2013, as
producers locate and target the sweet spots of plays currently under development and find additional tight formations that can be
developed with the latest technologies. In the AEO2014 Reference case, tight oil production increases from 2.3 MMbbl/d in 2012
(35% of total U.S. crude oil production) to 4.8 MMbbl/d in 2021 (51% of the total). As in AEO2013, tight oil production declines in
AEO2014 after 2021, as more development moves into less-productive areas.
U.S. use of imported petroleum and other liquid fuels continues to decline in AEO2014 mainly as a result of increased domestic oil
production. Imported petroleum and other liquid fuels as a share of total U.S. use reached 60% in 2005 before dipping below 50%
in 2010 and falling further to 40% in 2012. The import share continues to decline to 25% in 2016 and then rises to about 32% in
2040 in the AEO2014 reference case, as domestic production of tight oil begins to decline in 2022 (Figure 12).
Natural gas
Cumulative production of dry natural gas from 2012 to 2040 in the AEO2014 Reference case is about 11% higher than in AEO2013,
primarily reflecting continued growth in shale gas production resulting from the dual application of horizontal drilling and hydraulic
fracturing. Another contributing factor is ongoing drilling in shale and other plays with high concentrations of NGL and crude oil,
which in energy-equivalent terms have a higher value than dry natural gas. Cumulative production levels for tight gas and onshore
associated-dissolved gas from oil formations exceed those in AEO2013 through 2040 by 9% and 36%, respectively, making
material contributions to the overall increase in production. Natural gas prices above $6/MMBtu toward the end of the projection
period encourage drilling in less-productive but still-profitable areas in tight oil, shale oil, and natural gas formations. Lower 48
offshore natural gas production fluctuates between 1.7 Tcf and 2.9 Tcf per year, similar to the pattern in AEO2013. The multiyear
decline in offshore natural gas production was reversed in 2012, with 15 new deepwater projects coming on line during the year.
In the AEO2014 Reference case, the United States becomes a net exporter of LNG in 2016, and it becomes an overall net exporter
of natural gas in 2018, two years earlier than in AEO2013. U.S. exports of LNG from new liquefaction capacity are expected
to surpass 2 Tcf by 2020 and increase to 3.5 Tcf in 2029. Net pipeline imports from Canada fall steadily until 2033, and then
increase through 2040. Net pipeline exports to Mexico grow by more than 400% in the Reference case, with additional pipeline
infrastructure added to enable the Mexican market to receive more pipeline natural gas from the United States.
U.S. cumulative net LNG exports from 2012 to 2040 are up by 160% in AEO2014 compared with AEO2013, supported by
increased use of LNG in markets outside America, strong domestic production, and low U.S. natural gas prices relative to other
global markets.
Coal
Total U.S. coal production grows at an average rate of 0.3% per year in the AEO2014 Reference case, from 20.6 quadrillion Btu
(1,016 MMst) in 2012 to 22.6 quadrillion Btu (1,121 MMst) in 2040. U.S. electricity generation accounted for 91% of total U.S. coal
consumption (in Btu) in 2012. Coal production declined by more than 7% in 2012, from 1,096 MMst in 2011, mostly in response
to gas-on-coal competition. In the Reference case, production recovers to 1,062 MMst by 2015, in response to a rise in natural gas
prices along with a moderate increase in electricity demand. A
wave of coal-fired generating capacity retirements in response
Figure 12. U.S. petroleum and other liquid fuels
to MATS requirements coincides with a secondary drop in
supply, 1970-2040 (million barrels per day)
coal production to 1,022 MMst in 2016. Total production then
History
2005 2012
Projections
25
increases gradually to 1,127 MMst in 2030 before stabilizing as
a result of limits on achievable long-term capacity utilization
rates for available coal units compared to AEO2013.
20

15

10

Consumption

60%

Net imports

40%

32%

Domestic supply

5

0
1970

1980

1990

2000

2010

2020

2030

2040

Coal production from the Eastern Interior region in the
AEO2014 Reference case increases at a faster rate than
projected in AEO2013, because of an improved productivity
outlook, with 2020 production 27 MMst (18%) higher and
2040 production 58 MMst (34%) higher than projected
in AEO2013. Lower overall coal consumption and improved
competitiveness of coal produced in the Eastern Interior region
compared to AEO2013 lead to lower outlooks for Northern
Appalachian and Powder River Basin coal production, as well
as an accelerated decline in Central Appalachian production
in AEO2014. As a result of changes to CTL cost assumptions,
no CTL coal consumption or related production is projected in

U.S. Energy Information Administration | Annual Energy Outlook 2014 Early Release Overview

13
AEO2014 Early Release Overview
AEO2014, compared with 0.3 quadrillion Btu in 2040 in AEO2013. Expectations for total U.S. coal exports in AEO2014 are generally
similar to those in AEO2013, with an increase from 126 MMst in 2012 to 161 MMst by 2040.

Electricity generation
Total electricity consumption in the AEO2014 Reference case, including both purchases from electric power producers and on-site
generation, grows from 3,826 billion kWh in 2012 to 4,954 billion kWh in 2040, an average annual rate of 0.9% that is about the
same as in the AEO2013 Reference case. While growth in electricity consumption is similar overall, growth in the industrial sector
is much stronger than in AEO2013, while growth in the residential sector is weaker.
The combination of slow growth in electricity demand, competitively priced natural gas, programs encouraging renewable fuel
use, and the implementation of environmental rules dampens future coal use. The AEO2014 Reference case continues to assume
implementation of the Clean Air Interstate Rule (CAIR)30 as a result of an August 2012 federal court move to vacate the CrossState Air Pollution Rule. 31 In addition, AEO2014 continues to assume the implementation of MATS in 2016. Once MATS is in place,
sulfur dioxide levels are reduced to well below the levels required by CAIR, and mercury emissions drop to 6.1 tons in 2016 from
30.8 tons in 2011 when the rule was finalized.
Coal-fired power generation over the next few years is slightly higher in AEO2014 than in the AEO2013 Reference case because
of higher natural gas prices during that period, as well as pending nuclear retirements that necessitate additional baseload
generation. After 2020, generation from coal flattens out and remains lower than projected in AEO2013, because more coal-fired
capacity is retired and fewer new coal plants are built (Figure 13).
Coal-fired electricity generation has traditionally been the largest component of electricity generation, representing 37% of total
generation in 2012. By 2035, however, natural gas generation is projected to surpass coal generation. Coal and natural gas each
represent 34% of total generation in 2035, but by 2040 the coal share drops to 32%, and the natural gas share increases to 35%.
Market concerns about GHG emissions continue to dampen the expansion of coal-fired capacity in the AEO2014 Reference case,
even with the assumption of current laws and policies. Low fuel prices for new natural gas-fired plants also affect the relative
economics of coal-fired capacity, as does the continued rise in construction costs for new coal-fired power plants. As retirements
far outpace new additions, total coal-fired generating capacity falls from 310 gigawatts (GW) in 2012 to 262 GW in 2040 in the
AEO2014 Reference case. As with all projections, projected generation shares are highly sensitive to both fuel prices and changes
in policies and regulations. Alternative cases in the full AEO2014 will quantify these sensitivities.
In the first few years of the projection, electricity generation using natural gas is slightly lower in the AEO2014 Reference case than
in the AEO2013 Reference case because of higher natural gas prices in AEO2014. By 2017, however, natural gas-fired generation is
higher in AEO2014 than in the AEO2013 Reference case, and the difference continues to grow. Additional retirements of coal and
nuclear plants result in the need for new capacity, and new natural gas-fired plants are much cheaper to build than coal, nuclear,
or renewable plants. In 2020, natural gas-fired generation in AEO2014 is 7% higher than in AEO2013, and in 2040 it is 16% higher.
Electricity generation from nuclear power plants grows by 5% in the AEO2014 Reference case, from 769 billion kWh in 2012 to
811 billion kWh in 2040, accounting for about 16% of total generation in 2040 (compared with 19% in 2012). Nuclear generating
capacity decreases from 102 GW in 2012 to 98 GW in 2020
Figure 13. Electricity generation by fuel, 1990-2040
as new construction (5.5 GW) and uprates at existing plants
(0.7 GW) are more than offset by retirements in several
(trillion kilowatthours)
regions where existing nuclear units are facing challenging
History
2012
Projections
6
economic conditions. After 2025, a small amount of new
nuclear capacity comes on line as natural gas prices rise. In
2040, overall nuclear capacity is back up to 102 GW. AEO2014
5
incorporates updated information from EIA data collections
regarding planned nuclear plant construction and capacity
Natural gas 35%
4
uprates at existing units.
16%
9%

3

30%

Renewables 16%

12%

19%

1

19%

Nuclear 16%

52%

2

37%

Coal 32%

3%
0
1990

1%
2000

2010

Oil and other liquids
2020

2030

1%
2040

Increased generation with renewable energy, excluding
hydropower, accounts for 28% of the overall growth in
electricity generation from 2012 to 2040 in the AEO2014
Reference case. Generation from renewable resources grows in
response to federal tax credits, state-level policies, and federal
requirements to use more biomass-based transportation fuels,
some of which can produce electricity as a byproduct of their
production processes. In the final decade of the projection,
however, renewable generation growth is driven by increasing
cost competiveness with other nonrenewable technologies.

30

U
 .S. Environmental Protection Agency, “Clean Air Interstate Rule (CAIR)” (Washington, DC: December 19, 2012), http://www.epa.gov/cair/.
U
 .S. Environmental Protection Agency, “Fact Sheet: The Cross-State Air Pollution Rule: Reducing the Interstate Transport of Fine Particulate Matter
and Ozone” (Washington, DC: July 2011), http://www.epa.gov/airtransport/pdfs/CSAPRFactsheet.pdf.

31

14

U.S. Energy Information Administration | Annual Energy Outlook 2014 Early Release Overview
AEO2014 Early Release Overview
Compared to the AEO2013 Reference case, renewable generation is higher throughout most of the projection period, particularly
in the near term, because of the inclusion of the energy provisions of the ATRA. This law, among other things, extends several
tax credits for utility-scale renewables and redefines the qualification criteria, resulting in more construction of wind-powered
generating capacity in the near term.
Reported renewable capacity already under construction has increased in recent years and is represented in AEO2014. Growth in
renewable generation is supported by many state requirements, as well as regulations on CO2 emissions in California. The share
of U.S. electricity generation coming from renewable fuels (including conventional hydropower) grows from 12% in 2012 to 16%
in 2040 in the AEO2014 Reference case, even with federal subsidies for renewable generation assumed to expire as enacted.
Extensions of such subsidies could have a large impact on renewable generation. The long-run projections for renewable capacity
are also sensitive to natural gas prices and the relative costs of alternative generation sources.

Energy-related CO2 emissions

In the AEO2014 Reference case, total U.S. energy-related CO2 emissions in 2040 equal 5,599 million metric tons, 92 million
metric tons (1.6%) lower than in AEO2013. However, the carbon intensity of the economy in 2040 is slightly (0.6%) higher in
AEO2014 as compared with AEO2013. Projected energy-related CO2 emissions in 2020 and 2040 are, respectively, about 9% and
7% below the 2005 level, compared to 9% and 5% below the 2005 level in AEO2013.
The lower GDP projection in AEO2014 is partly the result of a lower population growth rate, and GDP per capita in 2040 is almost
4% higher in AEO2014 than in AEO2013. Energy use per capita and energy-related CO2 emissions per capita are higher in AEO2014
than in AEO2013 (about 5% in 2040). Also, higher levels of energy consumption and CO2 emissions per dollar of GDP in AEO2014
occur with a sectoral shift in the share of energy consumption from the residential, commercial, and transportation sectors
toward the industrial sector, which generally is more energy- and carbon-intensive than other sectors of the economy. Over the
projection period from 2012 to 2040, industrial emissions grow at an average annual rate of 0.6% in AEO2014, and industrial
energy-related CO2 emissions in 2040 are 133 million metric tons higher in AEO2014 than in AEO2013.
When examining the electric power sector, excluding combined heat and power, there are offsetting factors in comparing
AEO2014 and AEO2013. Coal use for generation is 7.9% lower in 2040 (141 billion kWh) in AEO2014 compared to AEO2013 as a
result of increased retirements of coal capacity and replacement with natural gas and renewables. However, nuclear generation,
which has no CO2 emissions, is also 10.1% (91 billion kWh) lower in 2040 in AEO2014 compared to AEO2013 because of more
nuclear retirements in AEO2014. This offsets the CO2 reduction achieved by switching from coal to natural gas and renewables.
In total, the carbon intensity of the electric power sector is lower in AEO2014 as generation declines by 0.2% (9 billion kWh), but
emissions are 1.9% lower in 2040.

U.S. Energy Information Administration | Annual Energy Outlook 2014 Early Release Overview

15
AEO2014 Early Release Overview

List of Acronyms
AEO

Annual Energy Outlook

LDV

Light-duty vehicle

AEO2013

Annual Energy Outlook 2013

LED

Light emitting diode

AEO2014

Annual Energy Outlook 2014

LNG

Liquefied natural gas

ATRA

American Taxpayer Relief Act of 2012

LPG

Liquefied petroleum gases

bbl

Barrels

LRG

Liquefied refinery gases

Btu

British thermal units

MATS

Mercury and Air Toxics Standards

CAFE

Corporate average fuel economy

MECS

Manufacturing Energy Consumption Survey

CAIR

Clean Air Interstate Rule

MMbbl/d Million barrels per day

CO2

Carbon dioxide

MMBtu

Million Btu

CTL

Coal-to-liquids

MMst

Million short tons

DOE

U.S. Department of Energy

NEMS

National Energy Modeling System

E85

Motor fuel containing up to 85% ethanol

NGL

Natural gas liquids

EIA

U.S. Energy Information Administration

NGPL

Natural gas plant liquids

EISA2007

Energy Independence and Security Act of 2007

OECD

EOR

Enhanced oil recovery

Organization for Economic Cooperation
and Development

EPA

U.S. Environmental Protection Agency

OPEC

FFV

Flexible fuel vehicle

Organization of the Petroleum Exporting
Countries

GDP

Gross domestic product

PADD

Petroleum Administration for Defense District

GHG

Greenhouse gas

PTC

Production tax credit

GW

Gigawatts

RECS

Residential Energy Consumption Survey

HDV

Heavy-duty vehicle

RFS

Renewable fuel standard

HGL

Hydrocarbon gas liquid

Tcf

Trillion cubic feet

kWh

Kilowatthour

VMT

Vehicle-miles traveled

16

U.S. Energy Information Administration | Annual Energy Outlook 2014 Early Release Overview
AEO2014 Early Release Overview

Table 1. Comparison of projections in the AEO2014 and AEO2013 Reference cases, 2011-2040
2025

Energy and economic factors

2040

2011

2012

AEO2014

AEO2013

AEO2014

AEO2013

Crude oil and natural gas plant liquids

15.31

17.08

23.03

18.70

19.99

17.01

Dry natural gas

23.04

24.59

32.57

29.22

38.37

33.87

Coal

22.22

20.60

22.36

22.54

22.61

23.54

Nuclear/Uranium

8.26

8.05

8.15

9.54

8.49

9.44

Hydropower

3.11

2.67

2.84

2.86

2.90

2.92

Biomass

3.90

3.78

5.08

5.27

5.61

6.96

Other renewable energy

1.70

1.97

3.09

2.32

3.89

3.84

Other

0.80

0.41

0.24

0.85

0.24

0.89

Total

78.35

79.15

97.36

91.29

102.09

98.46

Petroleum and other liquid fuelsa

18.78

16.55

11.41

15.89

13.65

15.99

Natural gas (- indicates exports)

2.03

1.58

-3.41

-1.56

-5.81

-3.55

Coal/other (- indicates exports)

-2.32

-2.86

-3.16

-3.02

-3.69

-2.95

Total

18.49

15.26

4.85

11.31

4.15

9.49

Petroleum and other liquid fuelsa

36.56

35.87

36.28

36.87

35.35

36.07

Natural gas

24.91

26.20

28.97

27.28

32.32

29.83

Coal

19.62

17.34

19.03

19.35

18.75

20.35

Nuclear/Uranium

8.26

8.05

8.15

9.54

8.49

9.44

Hydropower

3.11

2.67

2.84

2.86

2.90

2.92

Biomass

2.60

2.53

3.74

3.82

4.26

4.91

Other renewable energy

1.70

1.97

3.09

2.32

3.89

3.84

Other

0.35

0.39

0.35

0.30

0.35

0.29

Total

97.11

95.02

102.45

102.34

106.31

107.64

Residential

21.39

20.10

20.58

21.08

21.48

23.08

Commercial

18.05

17.61

18.77

19.04

20.88

21.13

Industrial

30.46

30.54

37.43

35.46

38.33

36.16

Transportation

27.21

26.77

25.67

26.75

25.62

27.27

Total

97.11

95.02

102.45

102.34

106.31

107.64

Domestic crude oil production

5.66

6.49

9.00

6.79

7.48

6.13

Other domestic production

4.71

4.60

5.14

5.63

5.22

5.83

Net imports

8.57

7.50

5.12

7.08

6.02

7.00

18.92

18.49

19.27

19.50

18.73

18.95

22.61

24.12

31.93

28.65

37.61

33.21

1.96

1.51

-3.41

-1.58

-5.80

-3.55

24.38

25.64

28.35

26.87

31.63

29.54

Primary energy production (quadrillion Btu)

Net imports (quadrillion Btu)

Energy consumption by fuel (quadrillion Btu)

Energy consumption by sector, including losses
in electricity generation (quadrillion Btu)b

Petroleum and other liquid fuels
(million barrels per day)

Consumption
Natural gas (trillion cubic feet)
Dry gas production + supplemental gas
Net imports (- indicates exports)
Consumption

U.S. Energy Information Administration | Annual Energy Outlook 2014 Early Release Overview

17
AEO2014 Early Release Overview

Table 1. Comparison of projections in the AEO2014 and AEO2013 Reference cases, 2011-2040 (continued)
2025

Energy and economic factors

2040

2011

2012

AEO2014

AEO2013

AEO2014

AEO2013

1,109

1,027

1,128

1,134

1,139

1,195

96

118

135

124

160

123

1,003

891

993

1,010

979

1,071

Brent spot crude oil (dollars per barrel)

113.24

111.65

108.99

119.45

141.46

165.57

West Texas Intermediate spot crude oil
(dollars per barrel)

96.55

94.12

106.99

117.41

139.46

163.54

4.07

2.75

5.23

4.96

7.65

7.97

41.74

39.94

49.67

52.94

59.16

62.37

10.1

9.8

10.1

9.7

11.1

11.0

13,299

13,593

18,769

18,985

26,670

27,277

1.134

1.154

1.421

1.429

1.913

1.871

10,150

10,304

14,162

14,259

19,724

19,785

5,926

6,147

8,778

8,548

10,994

10,616

7.30

6.99

5.46

5.39

3.99

3.95

312.3

314.6

347.0

356.5

380.5

404.4

5,498

5,290

5,526

5,501

5,599

5,691

Coal (million short tons)
Production and waste coal
Net exports
Consumption
Prices (2012 dollars)

Natural gas at Henry Hub
(dollars per million Btu)
Domestic coal at minemouth
(dollars per short ton)
Average electricity price
(cents per kilowatthour)
Economic indicators
Real gross domestic product
(billion 2005 dollars)
GDP chain-type price index
(2005 = 1.000)
Real disposable personal income
(billion 2005 dollars)
Value of industrial shipments
(billion 2005 dollars)
Primary energy intensity
(thousand Btu per 2005 dollar of GDP)
Population (millions)
Energy-related carbon dioxide emissions
(million metric tons)
a

Includes petroleum-derived fuels and non-petroleum-derived fuels, such as ethanol and biodiesel, and coal-based synthetic liquids. Petroleum coke,
which is a solid, is included. Also included are natural gas plant liquids and crude oil consumed as a fuel.
b
Electric power sector consumption is distributed to the end-use sectors.
Notes: Quantities reported in quadrillion Btu are derived from historical volumes and assumed thermal conversion factors. Other production
includes liquid hydrogen, methanol, and some inputs to refineries. Net imports of petroleum include crude oil, petroleum products, unfinished oils,
alcohols, ethers, and blending components. Other net imports include coal coke and electricity. Both coal consumption and coal production include
waste coal consumed in the electric power and industrial sectors.
Sources: AEO2014 National Energy Modeling System, run REF2014.D102413A; and AEO2013 National Energy Modeling System, run REF2013.
D102312A.

18

U.S. Energy Information Administration | Annual Energy Outlook 2014 Early Release Overview

Más contenido relacionado

La actualidad más candente

Bord Gáis Energy Index June 2015
Bord Gáis Energy Index June 2015Bord Gáis Energy Index June 2015
Bord Gáis Energy Index June 2015Bord Gáis Energy
 
Bord Gáis Energy Index May 2014
Bord Gáis Energy Index May 2014Bord Gáis Energy Index May 2014
Bord Gáis Energy Index May 2014Bord Gáis Energy
 
Bord Gáis Energy Index July 2015
Bord Gáis Energy Index July 2015Bord Gáis Energy Index July 2015
Bord Gáis Energy Index July 2015Bord Gáis Energy
 
BP Statistical Review of World Energy 2017
BP Statistical Review of World Energy 2017BP Statistical Review of World Energy 2017
BP Statistical Review of World Energy 2017Mark Salt
 
BP Statistical Review of World Energy 2014: Presentation
BP Statistical Review of World Energy 2014: PresentationBP Statistical Review of World Energy 2014: Presentation
BP Statistical Review of World Energy 2014: Presentationbp
 
Global Gas Report 2017 - In depth data analysis
Global Gas Report 2017 - In depth data analysisGlobal Gas Report 2017 - In depth data analysis
Global Gas Report 2017 - In depth data analysisSnam
 
Dr Dev Kambhampati | Recent Economic Trends in Manufacturing
Dr Dev Kambhampati | Recent Economic Trends in ManufacturingDr Dev Kambhampati | Recent Economic Trends in Manufacturing
Dr Dev Kambhampati | Recent Economic Trends in ManufacturingDr Dev Kambhampati
 
An All-of-the-Above Energy Strategy as a Path to Sustainable Economic Growth
An All-of-the-Above Energy Strategy as a Path to Sustainable Economic GrowthAn All-of-the-Above Energy Strategy as a Path to Sustainable Economic Growth
An All-of-the-Above Energy Strategy as a Path to Sustainable Economic GrowthMarcellus Drilling News
 
Hacia una época de oro del Gas Natural Una perspectiva mexicana:Horizonte 2025
Hacia una época de oro del Gas Natural Una perspectiva mexicana:Horizonte 2025Hacia una época de oro del Gas Natural Una perspectiva mexicana:Horizonte 2025
Hacia una época de oro del Gas Natural Una perspectiva mexicana:Horizonte 2025Observatorio del Gas
 
Statistical Review of World Energy 2021 Full report - BP
Statistical Review of World Energy 2021 Full report - BPStatistical Review of World Energy 2021 Full report - BP
Statistical Review of World Energy 2021 Full report - BPAbdelmounimTOUILEB
 
BP Statistical Review of World Energy 2016
BP Statistical Review of World Energy 2016BP Statistical Review of World Energy 2016
BP Statistical Review of World Energy 2016bp
 
BP 1Q 2016 results presentation
BP 1Q 2016 results presentation BP 1Q 2016 results presentation
BP 1Q 2016 results presentation bp
 

La actualidad más candente (15)

Bord Gáis Energy Index June 2015
Bord Gáis Energy Index June 2015Bord Gáis Energy Index June 2015
Bord Gáis Energy Index June 2015
 
Bord Gáis Energy Index May 2014
Bord Gáis Energy Index May 2014Bord Gáis Energy Index May 2014
Bord Gáis Energy Index May 2014
 
Bord Gáis Energy Index July 2015
Bord Gáis Energy Index July 2015Bord Gáis Energy Index July 2015
Bord Gáis Energy Index July 2015
 
BP Statistical Review of World Energy 2017
BP Statistical Review of World Energy 2017BP Statistical Review of World Energy 2017
BP Statistical Review of World Energy 2017
 
BP Energy Outlook 2035
BP Energy Outlook 2035BP Energy Outlook 2035
BP Energy Outlook 2035
 
BP Statistical Review of World Energy 2014: Presentation
BP Statistical Review of World Energy 2014: PresentationBP Statistical Review of World Energy 2014: Presentation
BP Statistical Review of World Energy 2014: Presentation
 
Global Gas Report 2017 - In depth data analysis
Global Gas Report 2017 - In depth data analysisGlobal Gas Report 2017 - In depth data analysis
Global Gas Report 2017 - In depth data analysis
 
Dr Dev Kambhampati | Recent Economic Trends in Manufacturing
Dr Dev Kambhampati | Recent Economic Trends in ManufacturingDr Dev Kambhampati | Recent Economic Trends in Manufacturing
Dr Dev Kambhampati | Recent Economic Trends in Manufacturing
 
An All-of-the-Above Energy Strategy as a Path to Sustainable Economic Growth
An All-of-the-Above Energy Strategy as a Path to Sustainable Economic GrowthAn All-of-the-Above Energy Strategy as a Path to Sustainable Economic Growth
An All-of-the-Above Energy Strategy as a Path to Sustainable Economic Growth
 
Hacia una época de oro del Gas Natural Una perspectiva mexicana:Horizonte 2025
Hacia una época de oro del Gas Natural Una perspectiva mexicana:Horizonte 2025Hacia una época de oro del Gas Natural Una perspectiva mexicana:Horizonte 2025
Hacia una época de oro del Gas Natural Una perspectiva mexicana:Horizonte 2025
 
Statistical Review of World Energy 2021 Full report - BP
Statistical Review of World Energy 2021 Full report - BPStatistical Review of World Energy 2021 Full report - BP
Statistical Review of World Energy 2021 Full report - BP
 
Oil 2018 - Launch Presentation
Oil 2018 - Launch PresentationOil 2018 - Launch Presentation
Oil 2018 - Launch Presentation
 
BP Statistical Review of World Energy 2016
BP Statistical Review of World Energy 2016BP Statistical Review of World Energy 2016
BP Statistical Review of World Energy 2016
 
BP 1Q 2016 results presentation
BP 1Q 2016 results presentation BP 1Q 2016 results presentation
BP 1Q 2016 results presentation
 
EY Price Point
EY Price PointEY Price Point
EY Price Point
 

Destacado

Ohio Dept. of Health Guidelines for Sampling Oil & Gas Wastes for TENORM
Ohio Dept. of Health Guidelines for Sampling Oil & Gas Wastes for TENORMOhio Dept. of Health Guidelines for Sampling Oil & Gas Wastes for TENORM
Ohio Dept. of Health Guidelines for Sampling Oil & Gas Wastes for TENORMMarcellus Drilling News
 
FERC Draft Environmental Impact Statement for Constitution Pipeline
FERC Draft Environmental Impact Statement for Constitution PipelineFERC Draft Environmental Impact Statement for Constitution Pipeline
FERC Draft Environmental Impact Statement for Constitution PipelineMarcellus Drilling News
 
NARO-PA Support for HB 1684 to Ensure Minimum Royalties for Landowners
NARO-PA Support for HB 1684 to Ensure Minimum Royalties for LandownersNARO-PA Support for HB 1684 to Ensure Minimum Royalties for Landowners
NARO-PA Support for HB 1684 to Ensure Minimum Royalties for LandownersMarcellus Drilling News
 
Oil and Gas Annual Report 2013 - Pennsylvania
Oil and Gas Annual Report 2013 - PennsylvaniaOil and Gas Annual Report 2013 - Pennsylvania
Oil and Gas Annual Report 2013 - PennsylvaniaMarcellus Drilling News
 
Ohio University's Ohio Shale Development Community Impact Survey Results
Ohio University's Ohio Shale Development Community Impact Survey ResultsOhio University's Ohio Shale Development Community Impact Survey Results
Ohio University's Ohio Shale Development Community Impact Survey ResultsMarcellus Drilling News
 
Assemblywoman Donna Lupardo Letter to DEC Commissioner Joe Martens, Oct 7, 2013
Assemblywoman Donna Lupardo Letter to DEC Commissioner Joe Martens, Oct 7, 2013Assemblywoman Donna Lupardo Letter to DEC Commissioner Joe Martens, Oct 7, 2013
Assemblywoman Donna Lupardo Letter to DEC Commissioner Joe Martens, Oct 7, 2013Marcellus Drilling News
 
Quarterly Economic Trends for Ohio Oil and Gas Industries - April 2014
Quarterly Economic Trends for Ohio Oil and Gas Industries - April 2014Quarterly Economic Trends for Ohio Oil and Gas Industries - April 2014
Quarterly Economic Trends for Ohio Oil and Gas Industries - April 2014Marcellus Drilling News
 
ODNR PR Plan to Promote Drilling in Ohio State Forests/Parks
ODNR PR Plan to Promote Drilling in Ohio State Forests/ParksODNR PR Plan to Promote Drilling in Ohio State Forests/Parks
ODNR PR Plan to Promote Drilling in Ohio State Forests/ParksMarcellus Drilling News
 
Chesapeake Energy 2014 Outlook & Capital Program
Chesapeake Energy 2014 Outlook & Capital ProgramChesapeake Energy 2014 Outlook & Capital Program
Chesapeake Energy 2014 Outlook & Capital ProgramMarcellus Drilling News
 

Destacado (9)

Ohio Dept. of Health Guidelines for Sampling Oil & Gas Wastes for TENORM
Ohio Dept. of Health Guidelines for Sampling Oil & Gas Wastes for TENORMOhio Dept. of Health Guidelines for Sampling Oil & Gas Wastes for TENORM
Ohio Dept. of Health Guidelines for Sampling Oil & Gas Wastes for TENORM
 
FERC Draft Environmental Impact Statement for Constitution Pipeline
FERC Draft Environmental Impact Statement for Constitution PipelineFERC Draft Environmental Impact Statement for Constitution Pipeline
FERC Draft Environmental Impact Statement for Constitution Pipeline
 
NARO-PA Support for HB 1684 to Ensure Minimum Royalties for Landowners
NARO-PA Support for HB 1684 to Ensure Minimum Royalties for LandownersNARO-PA Support for HB 1684 to Ensure Minimum Royalties for Landowners
NARO-PA Support for HB 1684 to Ensure Minimum Royalties for Landowners
 
Oil and Gas Annual Report 2013 - Pennsylvania
Oil and Gas Annual Report 2013 - PennsylvaniaOil and Gas Annual Report 2013 - Pennsylvania
Oil and Gas Annual Report 2013 - Pennsylvania
 
Ohio University's Ohio Shale Development Community Impact Survey Results
Ohio University's Ohio Shale Development Community Impact Survey ResultsOhio University's Ohio Shale Development Community Impact Survey Results
Ohio University's Ohio Shale Development Community Impact Survey Results
 
Assemblywoman Donna Lupardo Letter to DEC Commissioner Joe Martens, Oct 7, 2013
Assemblywoman Donna Lupardo Letter to DEC Commissioner Joe Martens, Oct 7, 2013Assemblywoman Donna Lupardo Letter to DEC Commissioner Joe Martens, Oct 7, 2013
Assemblywoman Donna Lupardo Letter to DEC Commissioner Joe Martens, Oct 7, 2013
 
Quarterly Economic Trends for Ohio Oil and Gas Industries - April 2014
Quarterly Economic Trends for Ohio Oil and Gas Industries - April 2014Quarterly Economic Trends for Ohio Oil and Gas Industries - April 2014
Quarterly Economic Trends for Ohio Oil and Gas Industries - April 2014
 
ODNR PR Plan to Promote Drilling in Ohio State Forests/Parks
ODNR PR Plan to Promote Drilling in Ohio State Forests/ParksODNR PR Plan to Promote Drilling in Ohio State Forests/Parks
ODNR PR Plan to Promote Drilling in Ohio State Forests/Parks
 
Chesapeake Energy 2014 Outlook & Capital Program
Chesapeake Energy 2014 Outlook & Capital ProgramChesapeake Energy 2014 Outlook & Capital Program
Chesapeake Energy 2014 Outlook & Capital Program
 

Similar a EIA Early Release of the 2014 Annual Energy Outlook

World Energy Outlook Factsheet 2014 from the IEA
World Energy Outlook Factsheet 2014 from the IEAWorld Energy Outlook Factsheet 2014 from the IEA
World Energy Outlook Factsheet 2014 from the IEAChris Gray
 
GlobalEnergyReviewCO2Emissionsin2021.pdf
GlobalEnergyReviewCO2Emissionsin2021.pdfGlobalEnergyReviewCO2Emissionsin2021.pdf
GlobalEnergyReviewCO2Emissionsin2021.pdfKiran252903
 
FEX | Industrie & Energie | 131112 | Conferentie Schaliegas & Olie | Presenta...
FEX | Industrie & Energie | 131112 | Conferentie Schaliegas & Olie | Presenta...FEX | Industrie & Energie | 131112 | Conferentie Schaliegas & Olie | Presenta...
FEX | Industrie & Energie | 131112 | Conferentie Schaliegas & Olie | Presenta...Flevum
 
BP Energy outlook 2035
BP Energy outlook 2035BP Energy outlook 2035
BP Energy outlook 2035Raghav Kapoor
 
BP Energy Outlook 2035
BP Energy Outlook 2035BP Energy Outlook 2035
BP Energy Outlook 2035Miguel Rosario
 
study_id71751_energy-industry-worldwide.pptx
study_id71751_energy-industry-worldwide.pptxstudy_id71751_energy-industry-worldwide.pptx
study_id71751_energy-industry-worldwide.pptxSahajpreet Kaur
 
Energy outlook 2035_booklet
Energy outlook 2035_bookletEnergy outlook 2035_booklet
Energy outlook 2035_bookletSmera Chawla
 
BP Energy Outlook 2035: 2014 Booklet
BP Energy Outlook 2035: 2014 BookletBP Energy Outlook 2035: 2014 Booklet
BP Energy Outlook 2035: 2014 Bookletbp
 
World Energy Outlook 2016 - Executive Summary
World Energy Outlook 2016 - Executive SummaryWorld Energy Outlook 2016 - Executive Summary
World Energy Outlook 2016 - Executive SummaryMarcellus Drilling News
 
Energy in the Pacific Alliance: oil and gas, electric power and renewables
Energy in the Pacific Alliance: oil and gas, electric power and renewablesEnergy in the Pacific Alliance: oil and gas, electric power and renewables
Energy in the Pacific Alliance: oil and gas, electric power and renewablesConstruir las Regiones, A.C.
 
The US Coal Crash | Evidence for Structural Change
The US Coal Crash | Evidence for Structural ChangeThe US Coal Crash | Evidence for Structural Change
The US Coal Crash | Evidence for Structural ChangeSustainable Brands
 
Mark Walkington on the Ministry of Economic Development's energy projections
Mark Walkington on the Ministry of Economic Development's energy projectionsMark Walkington on the Ministry of Economic Development's energy projections
Mark Walkington on the Ministry of Economic Development's energy projectionsmhjbnz
 
3.4 – "Natural Gas – Conventional & Unconventional Gas Sources" – Jakub Sieme...
3.4 – "Natural Gas – Conventional & Unconventional Gas Sources" – Jakub Sieme...3.4 – "Natural Gas – Conventional & Unconventional Gas Sources" – Jakub Sieme...
3.4 – "Natural Gas – Conventional & Unconventional Gas Sources" – Jakub Sieme...Pomcert
 

Similar a EIA Early Release of the 2014 Annual Energy Outlook (20)

Newell121409
Newell121409Newell121409
Newell121409
 
World Energy Outlook Factsheet 2014 from the IEA
World Energy Outlook Factsheet 2014 from the IEAWorld Energy Outlook Factsheet 2014 from the IEA
World Energy Outlook Factsheet 2014 from the IEA
 
World Energy Outlook 2012 - Factsheet
World Energy Outlook 2012 - FactsheetWorld Energy Outlook 2012 - Factsheet
World Energy Outlook 2012 - Factsheet
 
GlobalEnergyReviewCO2Emissionsin2021.pdf
GlobalEnergyReviewCO2Emissionsin2021.pdfGlobalEnergyReviewCO2Emissionsin2021.pdf
GlobalEnergyReviewCO2Emissionsin2021.pdf
 
GlobalEnergyReview2021.pdf
GlobalEnergyReview2021.pdfGlobalEnergyReview2021.pdf
GlobalEnergyReview2021.pdf
 
GlobalEnergyReport IEA 2021.pdf
GlobalEnergyReport IEA 2021.pdfGlobalEnergyReport IEA 2021.pdf
GlobalEnergyReport IEA 2021.pdf
 
FEX | Industrie & Energie | 131112 | Conferentie Schaliegas & Olie | Presenta...
FEX | Industrie & Energie | 131112 | Conferentie Schaliegas & Olie | Presenta...FEX | Industrie & Energie | 131112 | Conferentie Schaliegas & Olie | Presenta...
FEX | Industrie & Energie | 131112 | Conferentie Schaliegas & Olie | Presenta...
 
Autumn Seminar. Retos del gas no convencional. Mr. Ian Cronshaw
Autumn Seminar. Retos del gas no convencional. Mr. Ian CronshawAutumn Seminar. Retos del gas no convencional. Mr. Ian Cronshaw
Autumn Seminar. Retos del gas no convencional. Mr. Ian Cronshaw
 
BP Energy outlook 2035
BP Energy outlook 2035BP Energy outlook 2035
BP Energy outlook 2035
 
BP Energy Outlook 2035
BP Energy Outlook 2035BP Energy Outlook 2035
BP Energy Outlook 2035
 
Renewable Energy Essay
Renewable Energy EssayRenewable Energy Essay
Renewable Energy Essay
 
study_id71751_energy-industry-worldwide.pptx
study_id71751_energy-industry-worldwide.pptxstudy_id71751_energy-industry-worldwide.pptx
study_id71751_energy-industry-worldwide.pptx
 
Energy outlook 2035_booklet
Energy outlook 2035_bookletEnergy outlook 2035_booklet
Energy outlook 2035_booklet
 
BP Energy Outlook 2035: 2014 Booklet
BP Energy Outlook 2035: 2014 BookletBP Energy Outlook 2035: 2014 Booklet
BP Energy Outlook 2035: 2014 Booklet
 
World Energy Outlook 2016 - Executive Summary
World Energy Outlook 2016 - Executive SummaryWorld Energy Outlook 2016 - Executive Summary
World Energy Outlook 2016 - Executive Summary
 
Energy in the Pacific Alliance: oil and gas, electric power and renewables
Energy in the Pacific Alliance: oil and gas, electric power and renewablesEnergy in the Pacific Alliance: oil and gas, electric power and renewables
Energy in the Pacific Alliance: oil and gas, electric power and renewables
 
World Energy Outlook 2010
World Energy Outlook 2010World Energy Outlook 2010
World Energy Outlook 2010
 
The US Coal Crash | Evidence for Structural Change
The US Coal Crash | Evidence for Structural ChangeThe US Coal Crash | Evidence for Structural Change
The US Coal Crash | Evidence for Structural Change
 
Mark Walkington on the Ministry of Economic Development's energy projections
Mark Walkington on the Ministry of Economic Development's energy projectionsMark Walkington on the Ministry of Economic Development's energy projections
Mark Walkington on the Ministry of Economic Development's energy projections
 
3.4 – "Natural Gas – Conventional & Unconventional Gas Sources" – Jakub Sieme...
3.4 – "Natural Gas – Conventional & Unconventional Gas Sources" – Jakub Sieme...3.4 – "Natural Gas – Conventional & Unconventional Gas Sources" – Jakub Sieme...
3.4 – "Natural Gas – Conventional & Unconventional Gas Sources" – Jakub Sieme...
 

Más de Marcellus Drilling News

Five facts about shale: it’s coming back, and coming back strong
Five facts about shale: it’s coming back, and coming back strongFive facts about shale: it’s coming back, and coming back strong
Five facts about shale: it’s coming back, and coming back strongMarcellus Drilling News
 
Quarterly legislative action update: Marcellus and Utica shale region (4Q16)
Quarterly legislative action update: Marcellus and Utica shale region (4Q16)Quarterly legislative action update: Marcellus and Utica shale region (4Q16)
Quarterly legislative action update: Marcellus and Utica shale region (4Q16)Marcellus Drilling News
 
Access Northeast Pipeline Project - Dec 2016 Update
Access Northeast Pipeline Project - Dec 2016 UpdateAccess Northeast Pipeline Project - Dec 2016 Update
Access Northeast Pipeline Project - Dec 2016 UpdateMarcellus Drilling News
 
Rover Pipeline Letter to FERC Requesting Final Certificate
Rover Pipeline Letter to FERC Requesting Final CertificateRover Pipeline Letter to FERC Requesting Final Certificate
Rover Pipeline Letter to FERC Requesting Final CertificateMarcellus Drilling News
 
DOE Order Granting Elba Island LNG Right to Export to Non-FTA Countries
DOE Order Granting Elba Island LNG Right to Export to Non-FTA CountriesDOE Order Granting Elba Island LNG Right to Export to Non-FTA Countries
DOE Order Granting Elba Island LNG Right to Export to Non-FTA CountriesMarcellus Drilling News
 
LSE Study: Fracking is Revitalizing U.S. Manufacturing
LSE Study: Fracking is Revitalizing U.S. ManufacturingLSE Study: Fracking is Revitalizing U.S. Manufacturing
LSE Study: Fracking is Revitalizing U.S. ManufacturingMarcellus Drilling News
 
Letter From 24 States Asking Trump & Congress to Withdraw the Unlawful Clean ...
Letter From 24 States Asking Trump & Congress to Withdraw the Unlawful Clean ...Letter From 24 States Asking Trump & Congress to Withdraw the Unlawful Clean ...
Letter From 24 States Asking Trump & Congress to Withdraw the Unlawful Clean ...Marcellus Drilling News
 
Report: New U.S. Power Costs: by County, with Environmental Externalities
Report: New U.S. Power Costs: by County, with Environmental ExternalitiesReport: New U.S. Power Costs: by County, with Environmental Externalities
Report: New U.S. Power Costs: by County, with Environmental ExternalitiesMarcellus Drilling News
 
U.S. Crude Oil and Natural Gas Proved Reserves, Year-end 2015
U.S. Crude Oil and Natural Gas Proved Reserves, Year-end 2015U.S. Crude Oil and Natural Gas Proved Reserves, Year-end 2015
U.S. Crude Oil and Natural Gas Proved Reserves, Year-end 2015Marcellus Drilling News
 
U.S. EIA's Drilling Productivity Report - December 2015
U.S. EIA's Drilling Productivity Report - December 2015U.S. EIA's Drilling Productivity Report - December 2015
U.S. EIA's Drilling Productivity Report - December 2015Marcellus Drilling News
 
Velocys Plan to "Build the Business" - Gas-to-Liquids Plants
Velocys Plan to "Build the Business" - Gas-to-Liquids PlantsVelocys Plan to "Build the Business" - Gas-to-Liquids Plants
Velocys Plan to "Build the Business" - Gas-to-Liquids PlantsMarcellus Drilling News
 
PA DEP Revised Permit for Natural Gas Compression Stations, Processing Plants...
PA DEP Revised Permit for Natural Gas Compression Stations, Processing Plants...PA DEP Revised Permit for Natural Gas Compression Stations, Processing Plants...
PA DEP Revised Permit for Natural Gas Compression Stations, Processing Plants...Marcellus Drilling News
 
PA DEP Permit for Unconventional NatGas Well Site Operations and Remote Piggi...
PA DEP Permit for Unconventional NatGas Well Site Operations and Remote Piggi...PA DEP Permit for Unconventional NatGas Well Site Operations and Remote Piggi...
PA DEP Permit for Unconventional NatGas Well Site Operations and Remote Piggi...Marcellus Drilling News
 
PA DEP: Methane Reduction Strategies for Natural Gas Operations
PA DEP: Methane Reduction Strategies for Natural Gas OperationsPA DEP: Methane Reduction Strategies for Natural Gas Operations
PA DEP: Methane Reduction Strategies for Natural Gas OperationsMarcellus Drilling News
 
US EIA's December 2016 Short-Term Energy Outlook
US EIA's December 2016 Short-Term Energy OutlookUS EIA's December 2016 Short-Term Energy Outlook
US EIA's December 2016 Short-Term Energy OutlookMarcellus Drilling News
 
Northeast Gas Association's 2016 Statistical Guide
Northeast Gas Association's 2016 Statistical GuideNortheast Gas Association's 2016 Statistical Guide
Northeast Gas Association's 2016 Statistical GuideMarcellus Drilling News
 
PA PUC Responses to Auditor General's Act 13 Impact Fee Audit
PA PUC Responses to Auditor General's Act 13 Impact Fee AuditPA PUC Responses to Auditor General's Act 13 Impact Fee Audit
PA PUC Responses to Auditor General's Act 13 Impact Fee AuditMarcellus Drilling News
 
Pennsylvania Public Utility Commission Act 13/Impact Fees Audit by PA Auditor...
Pennsylvania Public Utility Commission Act 13/Impact Fees Audit by PA Auditor...Pennsylvania Public Utility Commission Act 13/Impact Fees Audit by PA Auditor...
Pennsylvania Public Utility Commission Act 13/Impact Fees Audit by PA Auditor...Marcellus Drilling News
 
Clyde Mine Discharge/Tenmile Creek Water Quality Final Report
Clyde Mine Discharge/Tenmile Creek Water Quality Final ReportClyde Mine Discharge/Tenmile Creek Water Quality Final Report
Clyde Mine Discharge/Tenmile Creek Water Quality Final ReportMarcellus Drilling News
 
FERC Order Denying Stay of Kinder Morgan's Broad Run Expansion Project
FERC Order Denying Stay of Kinder Morgan's Broad Run Expansion ProjectFERC Order Denying Stay of Kinder Morgan's Broad Run Expansion Project
FERC Order Denying Stay of Kinder Morgan's Broad Run Expansion ProjectMarcellus Drilling News
 

Más de Marcellus Drilling News (20)

Five facts about shale: it’s coming back, and coming back strong
Five facts about shale: it’s coming back, and coming back strongFive facts about shale: it’s coming back, and coming back strong
Five facts about shale: it’s coming back, and coming back strong
 
Quarterly legislative action update: Marcellus and Utica shale region (4Q16)
Quarterly legislative action update: Marcellus and Utica shale region (4Q16)Quarterly legislative action update: Marcellus and Utica shale region (4Q16)
Quarterly legislative action update: Marcellus and Utica shale region (4Q16)
 
Access Northeast Pipeline Project - Dec 2016 Update
Access Northeast Pipeline Project - Dec 2016 UpdateAccess Northeast Pipeline Project - Dec 2016 Update
Access Northeast Pipeline Project - Dec 2016 Update
 
Rover Pipeline Letter to FERC Requesting Final Certificate
Rover Pipeline Letter to FERC Requesting Final CertificateRover Pipeline Letter to FERC Requesting Final Certificate
Rover Pipeline Letter to FERC Requesting Final Certificate
 
DOE Order Granting Elba Island LNG Right to Export to Non-FTA Countries
DOE Order Granting Elba Island LNG Right to Export to Non-FTA CountriesDOE Order Granting Elba Island LNG Right to Export to Non-FTA Countries
DOE Order Granting Elba Island LNG Right to Export to Non-FTA Countries
 
LSE Study: Fracking is Revitalizing U.S. Manufacturing
LSE Study: Fracking is Revitalizing U.S. ManufacturingLSE Study: Fracking is Revitalizing U.S. Manufacturing
LSE Study: Fracking is Revitalizing U.S. Manufacturing
 
Letter From 24 States Asking Trump & Congress to Withdraw the Unlawful Clean ...
Letter From 24 States Asking Trump & Congress to Withdraw the Unlawful Clean ...Letter From 24 States Asking Trump & Congress to Withdraw the Unlawful Clean ...
Letter From 24 States Asking Trump & Congress to Withdraw the Unlawful Clean ...
 
Report: New U.S. Power Costs: by County, with Environmental Externalities
Report: New U.S. Power Costs: by County, with Environmental ExternalitiesReport: New U.S. Power Costs: by County, with Environmental Externalities
Report: New U.S. Power Costs: by County, with Environmental Externalities
 
U.S. Crude Oil and Natural Gas Proved Reserves, Year-end 2015
U.S. Crude Oil and Natural Gas Proved Reserves, Year-end 2015U.S. Crude Oil and Natural Gas Proved Reserves, Year-end 2015
U.S. Crude Oil and Natural Gas Proved Reserves, Year-end 2015
 
U.S. EIA's Drilling Productivity Report - December 2015
U.S. EIA's Drilling Productivity Report - December 2015U.S. EIA's Drilling Productivity Report - December 2015
U.S. EIA's Drilling Productivity Report - December 2015
 
Velocys Plan to "Build the Business" - Gas-to-Liquids Plants
Velocys Plan to "Build the Business" - Gas-to-Liquids PlantsVelocys Plan to "Build the Business" - Gas-to-Liquids Plants
Velocys Plan to "Build the Business" - Gas-to-Liquids Plants
 
PA DEP Revised Permit for Natural Gas Compression Stations, Processing Plants...
PA DEP Revised Permit for Natural Gas Compression Stations, Processing Plants...PA DEP Revised Permit for Natural Gas Compression Stations, Processing Plants...
PA DEP Revised Permit for Natural Gas Compression Stations, Processing Plants...
 
PA DEP Permit for Unconventional NatGas Well Site Operations and Remote Piggi...
PA DEP Permit for Unconventional NatGas Well Site Operations and Remote Piggi...PA DEP Permit for Unconventional NatGas Well Site Operations and Remote Piggi...
PA DEP Permit for Unconventional NatGas Well Site Operations and Remote Piggi...
 
PA DEP: Methane Reduction Strategies for Natural Gas Operations
PA DEP: Methane Reduction Strategies for Natural Gas OperationsPA DEP: Methane Reduction Strategies for Natural Gas Operations
PA DEP: Methane Reduction Strategies for Natural Gas Operations
 
US EIA's December 2016 Short-Term Energy Outlook
US EIA's December 2016 Short-Term Energy OutlookUS EIA's December 2016 Short-Term Energy Outlook
US EIA's December 2016 Short-Term Energy Outlook
 
Northeast Gas Association's 2016 Statistical Guide
Northeast Gas Association's 2016 Statistical GuideNortheast Gas Association's 2016 Statistical Guide
Northeast Gas Association's 2016 Statistical Guide
 
PA PUC Responses to Auditor General's Act 13 Impact Fee Audit
PA PUC Responses to Auditor General's Act 13 Impact Fee AuditPA PUC Responses to Auditor General's Act 13 Impact Fee Audit
PA PUC Responses to Auditor General's Act 13 Impact Fee Audit
 
Pennsylvania Public Utility Commission Act 13/Impact Fees Audit by PA Auditor...
Pennsylvania Public Utility Commission Act 13/Impact Fees Audit by PA Auditor...Pennsylvania Public Utility Commission Act 13/Impact Fees Audit by PA Auditor...
Pennsylvania Public Utility Commission Act 13/Impact Fees Audit by PA Auditor...
 
Clyde Mine Discharge/Tenmile Creek Water Quality Final Report
Clyde Mine Discharge/Tenmile Creek Water Quality Final ReportClyde Mine Discharge/Tenmile Creek Water Quality Final Report
Clyde Mine Discharge/Tenmile Creek Water Quality Final Report
 
FERC Order Denying Stay of Kinder Morgan's Broad Run Expansion Project
FERC Order Denying Stay of Kinder Morgan's Broad Run Expansion ProjectFERC Order Denying Stay of Kinder Morgan's Broad Run Expansion Project
FERC Order Denying Stay of Kinder Morgan's Broad Run Expansion Project
 

Último

Manipur-Book-Final-2-compressed.pdfsal'rpk
Manipur-Book-Final-2-compressed.pdfsal'rpkManipur-Book-Final-2-compressed.pdfsal'rpk
Manipur-Book-Final-2-compressed.pdfsal'rpkbhavenpr
 
16042024_First India Newspaper Jaipur.pdf
16042024_First India Newspaper Jaipur.pdf16042024_First India Newspaper Jaipur.pdf
16042024_First India Newspaper Jaipur.pdfFIRST INDIA
 
Rohan Jaitley: Central Gov't Standing Counsel for Justice
Rohan Jaitley: Central Gov't Standing Counsel for JusticeRohan Jaitley: Central Gov't Standing Counsel for Justice
Rohan Jaitley: Central Gov't Standing Counsel for JusticeAbdulGhani778830
 
VIP Girls Available Call or WhatsApp 9711199012
VIP Girls Available Call or WhatsApp 9711199012VIP Girls Available Call or WhatsApp 9711199012
VIP Girls Available Call or WhatsApp 9711199012ankitnayak356677
 
IndiaWest: Your Trusted Source for Today's Global News
IndiaWest: Your Trusted Source for Today's Global NewsIndiaWest: Your Trusted Source for Today's Global News
IndiaWest: Your Trusted Source for Today's Global NewsIndiaWest2
 
57 Bidens Annihilation Nation Policy.pdf
57 Bidens Annihilation Nation Policy.pdf57 Bidens Annihilation Nation Policy.pdf
57 Bidens Annihilation Nation Policy.pdfGerald Furnkranz
 
complaint-ECI-PM-media-1-Chandru.pdfra;;prfk
complaint-ECI-PM-media-1-Chandru.pdfra;;prfkcomplaint-ECI-PM-media-1-Chandru.pdfra;;prfk
complaint-ECI-PM-media-1-Chandru.pdfra;;prfkbhavenpr
 
Experience the Future of the Web3 Gaming Trend
Experience the Future of the Web3 Gaming TrendExperience the Future of the Web3 Gaming Trend
Experience the Future of the Web3 Gaming TrendFabwelt
 
Quiz for Heritage Indian including all the rounds
Quiz for Heritage Indian including all the roundsQuiz for Heritage Indian including all the rounds
Quiz for Heritage Indian including all the roundsnaxymaxyy
 
Global Terrorism and its types and prevention ppt.
Global Terrorism and its types and prevention ppt.Global Terrorism and its types and prevention ppt.
Global Terrorism and its types and prevention ppt.NaveedKhaskheli1
 

Último (10)

Manipur-Book-Final-2-compressed.pdfsal'rpk
Manipur-Book-Final-2-compressed.pdfsal'rpkManipur-Book-Final-2-compressed.pdfsal'rpk
Manipur-Book-Final-2-compressed.pdfsal'rpk
 
16042024_First India Newspaper Jaipur.pdf
16042024_First India Newspaper Jaipur.pdf16042024_First India Newspaper Jaipur.pdf
16042024_First India Newspaper Jaipur.pdf
 
Rohan Jaitley: Central Gov't Standing Counsel for Justice
Rohan Jaitley: Central Gov't Standing Counsel for JusticeRohan Jaitley: Central Gov't Standing Counsel for Justice
Rohan Jaitley: Central Gov't Standing Counsel for Justice
 
VIP Girls Available Call or WhatsApp 9711199012
VIP Girls Available Call or WhatsApp 9711199012VIP Girls Available Call or WhatsApp 9711199012
VIP Girls Available Call or WhatsApp 9711199012
 
IndiaWest: Your Trusted Source for Today's Global News
IndiaWest: Your Trusted Source for Today's Global NewsIndiaWest: Your Trusted Source for Today's Global News
IndiaWest: Your Trusted Source for Today's Global News
 
57 Bidens Annihilation Nation Policy.pdf
57 Bidens Annihilation Nation Policy.pdf57 Bidens Annihilation Nation Policy.pdf
57 Bidens Annihilation Nation Policy.pdf
 
complaint-ECI-PM-media-1-Chandru.pdfra;;prfk
complaint-ECI-PM-media-1-Chandru.pdfra;;prfkcomplaint-ECI-PM-media-1-Chandru.pdfra;;prfk
complaint-ECI-PM-media-1-Chandru.pdfra;;prfk
 
Experience the Future of the Web3 Gaming Trend
Experience the Future of the Web3 Gaming TrendExperience the Future of the Web3 Gaming Trend
Experience the Future of the Web3 Gaming Trend
 
Quiz for Heritage Indian including all the rounds
Quiz for Heritage Indian including all the roundsQuiz for Heritage Indian including all the rounds
Quiz for Heritage Indian including all the rounds
 
Global Terrorism and its types and prevention ppt.
Global Terrorism and its types and prevention ppt.Global Terrorism and its types and prevention ppt.
Global Terrorism and its types and prevention ppt.
 

EIA Early Release of the 2014 Annual Energy Outlook

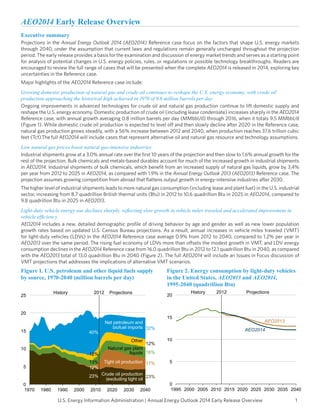
  • 1. AEO2014 Early Release Overview Executive summary Projections in the Annual Energy Outlook 2014 (AEO2014) Reference case focus on the factors that shape U.S. energy markets through 2040, under the assumption that current laws and regulations remain generally unchanged throughout the projection period. The early release provides a basis for the examination and discussion of energy market trends and serves as a starting point for analysis of potential changes in U.S. energy policies, rules, or regulations or possible technology breakthroughs. Readers are encouraged to review the full range of cases that will be presented when the complete AEO2014 is released in 2014, exploring key uncertainties in the Reference case. Major highlights of the AEO2014 Reference case include: Growing domestic production of natural gas and crude oil continues to reshape the U.S. energy economy, with crude oil production approaching the historical high achieved in 1970 of 9.6 million barrels per day Ongoing improvements in advanced technologies for crude oil and natural gas production continue to lift domestic supply and reshape the U.S. energy economy. Domestic production of crude oil (including lease condensate) increases sharply in the AEO2014 Reference case, with annual growth averaging 0.8 million barrels per day (MMbbl/d) through 2016, when it totals 9.5 MMbbl/d (Figure 1). While domestic crude oil production is expected to level off and then slowly decline after 2020 in the Reference case, natural gas production grows steadily, with a 56% increase between 2012 and 2040, when production reaches 37.6 trillion cubic feet (Tcf).The full AEO2014 will include cases that represent alternative oil and natural gas resource and technology assumptions. Low natural gas prices boost natural gas-intensive industries Industrial shipments grow at a 3.0% annual rate over the first 10 years of the projection and then slow to 1.6% annual growth for the rest of the projection. Bulk chemicals and metals-based durables account for much of the increased growth in industrial shipments in AEO2014. Industrial shipments of bulk chemicals, which benefit from an increased supply of natural gas liquids, grow by 3.4% per year from 2012 to 2025 in AEO2014, as compared with 1.9% in the Annual Energy Outlook 2013 (AEO2013) Reference case. The projection assumes growing competition from abroad that flattens output growth in energy-intensive industries after 2030. The higher level of industrial shipments leads to more natural gas consumption (including lease and plant fuel) in the U.S. industrial sector, increasing from 8.7 quadrillion British thermal units (Btu) in 2012 to 10.6 quadrillion Btu in 2025 in AEO2014, compared to 9.8 quadrillion Btu in 2025 in AEO2013. Light-duty vehicle energy use declines sharply, reflecting slow growth in vehicle miles traveled and accelerated improvement in vehicle efficiency AEO2014 includes a new, detailed demographic profile of driving behavior by age and gender as well as new lower population growth rates based on updated U.S. Census Bureau projections. As a result, annual increases in vehicle miles traveled (VMT) for light-duty vehicles (LDVs) in the AEO2014 Reference case average 0.9% from 2012 to 2040, compared to 1.2% per year in AEO2013 over the same period. The rising fuel economy of LDVs more than offsets the modest growth in VMT, and LDV energy consumption declines in the AEO2014 Reference case from 16.0 quadrillion Btu in 2012 to 12.1 quadrillion Btu in 2040, as compared with the AEO2013 total of 13.0 quadrillion Btu in 2040 (Figure 2). The full AEO2014 will include an Issues in Focus discussion of VMT projections that addresses the implications of alternative VMT scenarios. Figure 1. U.S. petroleum and other liquid fuels supply by source, 1970-2040 (million barrels per day) 2012 History 25 Projections 20 20 15 40% Net petroleum and biofuel imports 32% Other 10 12% 13% 12% 5 0 1970 12% 1990 2000 2010 History 2012 Projections 15 AEO2013 AEO2014 10 Natural gas plant liquids 16% Tight oil production 17% 23% Crude oil production 23% (excluding tight oil 1980 Figure 2. Energy consumption by light-duty vehicles in the United States, AEO2013 and AEO2014, 1995-2040 (quadrillion Btu) 2020 2030 2040 5 0 1995 2000 2005 2010 2015 2020 2025 2030 2035 2040 U.S. Energy Information Administration | Annual Energy Outlook 2014 Early Release Overview 1
  • 2. AEO2014 Early Release Overview Natural gas overtakes coal to provide the largest share of U.S. electric power generation Projected low prices for natural gas make it a very attractive fuel for new generating capacity. In some areas, natural gas-fired generation replaces generation formerly supplied by coal and nuclear plants. In 2040, natural gas accounts for 35% of total electricity generation, while coal accounts for 32% (Figure 3). Generation from renewable fuels, unlike coal and nuclear power, is higher in the AEO2014 Reference case than in AEO2013. Electric power generation with renewables is bolstered by legislation enacted at the beginning of 2013 extending tax credits for various renewable technologies; which was passed after the AEO2013 Reference case had been completed, but was considered in an alternative case in AEO2013. The full AEO2014 will include a variety of cases addressing the implications of alternative market conditions and policies for the electricity generation mix. Higher natural gas production also supports increases in exports of both pipeline and liquefied natural gas In addition to increases in domestic consumption in the industrial and electric power sectors, U.S. exports of natural gas also increase in the AEO2014 Reference case (Figure 4). U.S. exports of liquefied natural gas (LNG) increase to 3.5 Tcf in 2029 and remain at that level through 2040. Pipeline exports of U.S. natural gas to Mexico grow by 6% per year, from 0.6 Tcf in 2012 to 3.1 Tcf in 2040, and pipeline exports to Canada grow by 1.2% per year, from 1.0 Tcf in 2012 to 1.4 Tcf in 2040. Over the same period, U.S. pipeline imports from Canada fall by 30%, from 3.0 Tcf in 2012 to 2.1 Tcf in 2040, as more U.S. demand is met by domestic production. Projected exports are sensitive to assumptions regarding conditions in U.S. and global natural gas markets. The full AEO2014 will include cases that illustrate the sensitivity of projected natural gas exports to alternative resource, economic, and price scenarios. With strong growth in domestic crude oil and natural gas production, U.S. use of imported fuels falls sharply In the AEO2014 Reference case, U.S. domestic energy production increases from 79.1 quadrillion Btu in 2012 to 102.1 quadrillion Btu in 2040, and net use of imported energy sources, which was 30% in 2005, falls from 16% of total consumption in 2012 to 4% in 2040. In the AEO2013 Reference case, domestic energy production reached a total of 98.5 quadrillion Btu, and energy imports is projected to decline as a percentage of consumption to 9% in 2040. The larger increase in domestic energy production in AEO2014 is primarily a result of higher projections of production of natural gas and biomass/other renewables. Crude oil production (including lease condensate) increases from 13.9 quadrillion Btu in 2012 to a peak of 20.5 quadrillion Btu in 2019 before dropping to 16.0 quadrillion Btu in 2040. With domestic crude oil production rising to 9.5 MMbbl/d in 2016, the import share of U.S. petroleum and other liquids supply falls to about 25%. Domestic production begins to decline after 2019, and the import share of total petroleum and other liquids supply grows to 32% in 2040, still lower than the 2040 level of 37% in the AEO2013 Reference case. The alternative cases in the full AEO2014 will illustrate how different assumptions about resources, markets, and policies can dramatically impact projections of import dependence. Improved efficiency of energy use in the residential and transportation sectors and a shift away from carbon-intensive fuels for electricity generation keep U.S. energy-related carbon dioxide emissions below their 2005 level through 2040 In the AEO2014 Reference case, total U.S. energy-related emissions of carbon dioxide (CO2) remain below the 2005 level in every year through 2040. Projected emissions in 2020 and 2040 are, respectively, about 9% and 7% below the 2005 level. In AEO2014, CO2 emissions associated with U.S. industrial activity (including CO2 emissions associated with the generation of electricity used in the industrial sector) begin to surpass emissions from the transportation sector in the middle of the next Figure 3. Electricity generation from natural gas and coal, 2005-40 (trillion kilowatthours) 2,500 History 2012 Projections Figure 4. U.S. natural gas imports and exports, 2000-40 (trillion cubic feet) 8 History 2012 6 Natural gas 1,000 LNG exports from lower 48 States 0 1,500 Exports to Canada 2 Coal Exports to Mexico 4 2,000 Alaska LNG exports Imports from Canada -2 500 0 2005 2 Projections LNG imports -4 2010 2015 2020 2025 2030 2035 2040 -6 2000 2005 2010 2015 2020 2025 2030 U.S. Energy Information Administration | Annual Energy Outlook 2014 Early Release Overview 2035 2040
  • 3. AEO2014 Early Release Overview decade for the first time since the late 1990s. In the transportation sector, as a result of new fuel economy standards, biofuel mandates, and shifts in consumer behavior, emissions from transportation sector use of petroleum and other liquids generally decline or remain stable from 2012 through 2040. Emissions from energy use in the commercial sector increase more rapidly than in the residential sector, and in 2040 emissions from these two sectors are about equal. In the electric power sector, CO2 emissions from coal combustion decline after 2029 as more power plants are fueled by lower-carbon fuels, including natural gas and renewables. However, the lower level of CO2 emissions in the electric power sector because of the reduced role for coal is partially offset by less projected generation from nuclear power. Generation from nuclear power in AEO2014 is 10% below levels in AEO2013 in 2040 as a result of increased nuclear plant retirements. Projected growth in real gross domestic product is slightly slower than in AEO2013, but projected per capita GDP and disposable income are higher than in AEO2013 because of a reduced projection for U.S. population growth Annual growth of real gross domestic product (GDP) from 2012 to 2040 averages 2.4% in the AEO2014 Reference case, slightly below the AEO2013 Reference case growth rate over the same period. However, industrial output growth is higher in AEO2014, averaging 2.1% per year from 2012 to 2040. Industries that supply equipment for increased natural gas production, as well as industries benefitting from lower natural gas prices, account for much of the higher growth in manufacturing. On a per capita basis, projected annual growth rates for real GDP and disposable income in AEO2014, both averaging 1.7% per year, are above the comparable rates in AEO2013, reflecting lower projected population growth rate estimates (0.7% in AEO2014 compared to 0.9% in AEO2013) for the 2012-40 period provided by the U.S. Census Bureau. Introduction In preparing the AEO2014 Reference case, the U.S. Energy Information Administration (EIA) evaluated a wide range of trends and issues that could have major implications for U.S. energy markets. This overview presents the AEO2014 Reference case and compares it with the AEO2013 Reference case released in April 2013 (see Table 1 on pages 17-18). Because of the uncertainties inherent in any energy market projection, the Reference case results should not be viewed in isolation. Readers are encouraged to review the alternative cases when the complete AEO2014 publication is released, to gain perspective on how variations in key assumptions can lead to different outlooks for energy markets. To provide a basis against which alternative cases and policies can be compared, the AEO2014 Reference case generally assumes that current laws and regulations affecting the energy sector remain unchanged throughout the projection (including the implication that laws that include sunset dates do, in fact, expire at the time of those sunset dates). This assumption clarifies the relationship of the Reference case to other AEO2014 cases and enables policy analysis with less uncertainty regarding unstated legal or regulatory assumptions. As in past editions, the complete AEO2014 will include additional cases, many of which reflect the effects of extending a variety of current energy programs beyond their current expiration dates and the permanent retention of a broad set of programs that currently are subject to sunset provisions. In addition to the alternative cases prepared for AEO2014, EIA has examined proposed policies at the request of Congress over the past few years. Reports describing the results of those analyses are available on EIA’s website.1 Key updates made for the AEO2014 Reference case include the following: Macroeconomic • Revised U.S. Census Bureau population projections. 2 The population projection for 2040 in the AEO2014 Reference case is almost 6% below the 2040 projection used for the AEO2013 Reference case. Most of the revision in overall population growth results from a lower projection for net international migration, with younger age groups showing the largest differences from the earlier projection. The slower rate of population growth leads to less labor force growth, which contributes to slower GDP growth. Residential, commercial, and industrial • Revised base year residential equipment stocks and energy consumption for space heating, space cooling, and water heating, based on data from EIA’s 2009 Residential Energy Consumption Survey (RECS), the most recent data available. 3 Estimates of appliance stocks and energy consumption for several miscellaneous electric loads also were updated, based on a report by Navigant Consulting Inc., to better reflect recent changes and trends in the residential sector.4 1 See “Congressional & Other Requests,” http://www.eia.gov/analysis/reports.cfm?t=138. T he new population projections were released on December 12, 2012. See U.S. Department of Commerce, “U.S. Census Bureau Projections Show a Slower Growing, Older, More Diverse Nation a Half Century from Now” (Washington, DC: December 12, 2012), http://www.census.gov/ newsroom/releases/archives/population/cb12-243.html. 3 U .S. Energy Information Administration, “Residential Energy Consumption Survey (RECS): 2009 RECS Survey Data, Public Use Microdata File (Washington, DC: January 2013), http://www.eia.gov/consumption/residential/data/2009/index.cfm?view=microdata. 4 N avigant Consulting, Inc., Analysis and Representation of Miscellaneous Electric Loads in the National Energy Modeling System (NEMS) (Washington, DC: May 2013), prepared for the U.S. Department of Energy, U.S. Energy Information Administration. 2 U.S. Energy Information Administration | Annual Energy Outlook 2014 Early Release Overview 3
  • 4. AEO2014 Early Release Overview • Updated and expanded representation of miscellaneous electric loads in the commercial sector, as well as personal computers and data center servers, based on the Navigant report, reflecting recent and expected trends in electronics use.5 • Updated costs and improved representation of residential lighting applications, including wider representation of light emitting diode (LED) lighting and outdoor lighting, based on the 2009 RECS and two U.S. Department of Energy (DOE) reports.6, 7 • Revised handling of the regional efficiency standard for residential furnaces, based on an ongoing legal appeal of the standard. The regional standard scheduled to take effect in 2013 is not included in AEO2014 because of a court challenge and proposed settlement that would vacate the standard in question and require DOE to develop new residential furnace standards. • Revised commercial capacity factors governing annual usage of major end-use equipment, based on an EIA-contracted analysis. • Updated manufacturing sector data to reflect the 2010 Manufacturing Energy Consumption Survey (MECS).8 • Revised outlook for industrial production to reflect the effects of increased shale gas production and lower natural gas prices, resulting in faster growth for industrial production and energy consumption. The industries primarily affected include energyintensive bulk chemicals and primary metals, both of which provide products used by the mining and other downstream industries such as fabricated metals and machinery. The bulk chemicals industry is also a major user of natural gas and, increasingly, hydrocarbon gas liquid (HGL) feedstocks.9 • Expanded process flow models for the cement and lime industry and the aluminum industry, allowing technologies based on energy efficiency to be incorporated, as well as enhancement of the cement model to include renewable fuels. Transportation • Implemented a new approach to VMT projections for LDVs, based on an analysis of VMT by age cohorts and the aging of the driving population over the course of the projection, which resulted in a significantly lower level of VMT growth after 2018 compared with AEO2013. On balance, demographic trends (such as an aging population and decreasing rates of licensing and travel among younger age groups) combine with employment and income factors to produce a 30% increase in VMT from 2012 to 2040 in AEO2014 compared with 41% growth in AEO2013. • Added LNG as a potential fuel choice for freight rail locomotives and domestic marine vessels, resulting in significant penetration of natural gas as a fuel for freight rail (35% of freight rail energy consumption in 2040) but relatively minor penetration in domestic marine vessels (2% of domestic marine energy consumption in 2040). • Adopted a new approach for estimating freight travel demand by region and commodity for heavy-duty vehicles (HDVs), rail, and domestic marine vessels, as well as updated fuel efficiencies for freight rail and domestic marine vessels. • Updated handling of flex-fuel vehicle (FFV) fuel shares to better reflect consumer preferences and industry response. FFVs are necessary to meet the renewable fuels standard (RFS), but the phase-out of corporate average fuel economy (CAFE) credits for their sale, as well as limited demand from consumers, reduces their market penetration. • Revised attributes for battery electric vehicles—including (1) product availability, (2) electric drive fuel efficiency, and (3) nonbattery system costs by vehicle size class, battery size, and added battery cost per kilowatthour based on vehicle power-toenergy ratio for vehicle type—applied to hybrid electric, plug-in hybrid electric, and all-electric vehicles. Oil and natural gas production and product markets • Revised network pricing assumptions based on benchmarking of regional natural gas hub prices to historical spot natural gas prices, basing flow decisions on spot prices, setting variable tariffs based on historical spot natural gas price differentials, and estimating the price of natural gas to the electric power sector off a netback from the regional hub prices.10  5 N avigant Consulting, Inc., Analysis and Representation of Miscellaneous Electric Loads in the National Energy Modeling System (NEMS) (Washington, DC: May 2013), prepared for the U.S. Department of Energy, U.S. Energy Information Administration.  6 U .S. Department of Energy, Office of Energy Efficiency and Renewable Energy, Residential Lighting End-Use Consumption Study: Estimation Framework and Initial Estimates (Washington, DC: December 2012), http://apps1.eere.energy.gov/buildings/publications/pdfs/ssl/2012_residential-lightingstudy.pdf.  7 U .S. Department of Energy, Office of Energy Efficiency and Renewable Energy, 2010 U.S. Lighting Market Characterization (Washington, DC: January 2012), http://apps1.eere.energy.gov/buildings/publications/pdfs/ssl/2010-lmc-final-jan-2012.pdf.  8 U .S. Energy Information Administration, “Manufacturing Energy Consumption Survey (MECS): 2010 MECS Survey Data” (Washington, DC: March 19, 2013), http://www.eia.gov/consumption/manufacturing/data/2010/.  9 G rowing production of wet natural gas and lighter crude oil has focused attention on natural gas liquids (NGL). EIA has developed and adopted a neutral term—“hydrocarbon gas liquid” (HGL)—to equate the supply (natural gas plant liquids [NGPL] + liquefied refinery gases [LRG]) and market (NGL + refinery olefins) terms. For example, liquefied petroleum gas (LPG) is currently defined by EIA as ethane, propane, normal butane, and isobutane and their olefins (ethylene, propylene, butylene, and isobutylene). This definition is inconsistent with definitions used by other federal agencies, international organizations, and trade groups, in that it implies that all the products are in a liquid state (ethane typically is not) and are used in the same way (higher-value olefins are used differently). Part of the HGL implementation redefines LPG to include only propane, butane, and isobutane and to exclude ethane and refinery olefins. The tables included in AEO2014 have been relabeled to conform to this newly adopted definition. 10 E stimating natural gas prices to the electricity generation sector based on hub prices, rather than the citygate prices as was done in prior years, is a better reflection of current market conditions, in which many large natural gas consumers are outside the citygate. 4 U.S. Energy Information Administration | Annual Energy Outlook 2014 Early Release Overview
  • 5. AEO2014 Early Release Overview • Allowed secondary flows of natural gas out of the Middle Atlantic region to change dynamically in the model based on relative prices, which enables a larger volume of natural gas from the Middle Atlantic’s Marcellus formation to supply neighboring regions. • Developed the estimated ultimate recovery of tight oil and shale gas on the basis of county-level data.11 • Updated oil and gas supply module that explicitly reports technically recoverable resources of liquids in natural gas, enabling estimation of dry and wet natural gas. • Improved representation of the dynamics of U.S. gasoline and diesel exports versus U.S. demand, through adoption of endogenous modeling.12 • Added representation of the U.S. crude oil distribution system (pipelines, marine, and rail), to allow crude oil imports to go to logical import regions for transport to refineries, which enables crude imports and domestic production to move among refining regions and keeps imports of Canadian crude oil from flowing directly to U.S. Gulf refiners.13 • Revised production outlook for nonpetroleum other liquids—gas-to-liquids, coal-to-liquids (CTL), biomass-to-liquids, and pyrolysis14—with lower production levels than in AEO2013, as more recent experience with these emerging technologies indicates higher costs than previously assumed.15 • Revised representation of CO2-enhanced oil recovery (EOR) that better integrates the electricity, oil and gas supply, and refining modules.16 Electric power sector • Revised approach to reserve margins, which are set by region on the basis of North American Electric Reliability Corporation/ Independent System Operator requirements,17 and capacity payments, which are calculated as a combination of levelized costs for combustion turbines and the marginal value of capacity in the electricity model. • Revised handling of spinning reserves, with the required levels set explicitly depending on the mix of generating technologies used to meet peak demand by region, to allow better representation of capacity requirements and costs in regions or cases with high penetration of intermittent loads. • Revised assumptions concerning the potential for unannounced retirement of nuclear capacity in several regions to better reflect the impact of rising operating costs and low electricity prices. Announced nuclear retirements are already incorporated as planned. • Updated handling of Mercury and Air Toxics Standards (MATS)18 covering the electric power sector to reflect potential upgrades of electrostatic precipitators, requirements for plants with dry scrubbers to employ fabric filters, and revised costs for retrofits of dry sorbent injection and fabric filters. • Updated treatment of the production tax credit (PTC) for eligible renewable electricity generation technologies—consistent with the American Taxpayer Relief Act of 2012 (ATRA) passed in January 201319—including revision of PTC expiration dates for each PTC-eligible technology to reflect the concept of projects being declared “under construction” as opposed to being placed “in service” and extension of the expiration date of the PTC for wind generation projects by one year. Economic growth Macroeconomic projections in the Annual Energy Outlook (AEO) are trend projections, with no major shocks assumed and with potential growth determined by the economy’s supply capability. Growth in aggregate supply depends on increases in the labor force, growth of capital stocks, and improvements in productivity. Long-term demand growth depends on labor force growth, 11 A fter accounting for infrastructure constraints and general development patterns, oil and natural gas resources in “sweet spots” are developed earlier than lower quality resources, based on net present value. 12 H igh U.S. crude oil production and low fuel costs have given U.S. refiners a competitive advantage over foreign refiners, as evidenced by high U.S. refinery utilization and increasing U.S. exports of gasoline and diesel fuel. 13 O il imports from Canada now are required to go to Petroleum Administration for Defense District (PADD) 2 (Midwest: North Dakota, South Dakota, Nebraska, Kansas, Oklahoma, Minnesota, Iowa, Missouri, Wisconsin, Illinois, Michigan, Indiana, Ohio, Kentucky, and Tennessee); PADD 4 (Rocky Mountain: Montana, Idaho, Wyoming, Utah, and Colorado); and PADD 5 (West Coast: Washington, Oregon, Nevada, California, Arizona, Alaska, and Hawaii) for redistribution through the crude oil distribution infrastructure. 14 P yrolysis is defined as the thermal decomposition of biomass at high temperatures (greater than 400°F, or 200°C) in the absence of air. 15 E IA undertook detailed assessments of these technologies in order to characterize key parameters considered in the model, such as capital cost, contingency factors, construction time, first year of operation, plant life, plant production capacity, efficiency, and feedstock and other operating costs. 16 W hen considering CO2 EOR, the oil and gas supply module assesses a location and the availability and price of CO2 from power plants and CTL facilities. The electric power plants now consider the market size and prices for CO2 captured. The refining module assesses a location and the availability and price of CO2 from CTL facilities. The power sector now assesses opportunities for plants equipped with carbon capture and storage, as the CO2 produced at these facilities can be used for EOR operations. This enables the model to solve dynamically for the capture of CO2 and the production of oil from anthropogenic CO2 EOR. 17 N orth American Electric Reliability Corporation, 2013 Summer Reliability Assessment (Atlanta, GA: May 2013), http://www.nerc.com/pa/RAPA/ra/ Reliability%20Assessments%20DL/2013SRA_Final.pdf. 18 U .S. Environmental Protection Agency, “Mercury and Air Toxics Standards (MATS),” http://www.epa.gov/mats. 19 U .S. House of Representatives, 112th Congress, Public Law 112-240, “American Taxpayer Relief Act of 2012,” Sections 401-412 (Washington, DC: January 2, 2013), http://www.gpo.gov/fdsys/pkg/PLAW-112publ240/pdf/PLAW-112publ240.pdf. U.S. Energy Information Administration | Annual Energy Outlook 2014 Early Release Overview 5
  • 6. AEO2014 Early Release Overview income growth, and population growth. AEO2014 uses the U.S. Census Bureau’s December 2012 middle population projection. The U.S. Census Bureau revised its population projections primarily to reflect lower assumptions regarding international net migration. In AEO2014, U.S. population is expected to grow at an annual rate of 0.7% from 2012 to 2040, or 0.2 percentage points lower than the 0.9% average annual population growth rate in AEO2013. As shown in Figure 5, most of the change from AEO2013 to AEO2014 is in the younger age cohorts. Real GDP, labor force, and productivity in AEO2014 grow by average annual rates of 2.4%, 0.6%, and 1.8%, respectively, from 2012 to 2040. Total industrial production growth (which includes manufacturing, construction, agriculture, and mining) in AEO2014 is higher than projected in AEO2013, primarily as a result of more rapid growth in manufacturing output, with most of the difference accounted for by machinery, transportation equipment, fabricated metals, and bulk chemicals. Those industries, in addition to being tradesensitive, supply equipment or raw materials used in oil and gas production or otherwise benefit from lower natural gas prices. In 2040, the manufacturing share of total gross output is 18% in AEO2014, compared with 16% in AEO2013. Energy prices Crude oil Oil prices are influenced by several factors, including some that have mainly short-term impacts. Other factors, such as expectations about future world demand for petroleum and other liquids and production decisions by the Organization of the Petroleum Exporting Countries (OPEC), can affect prices over the longer term. Supply and demand in the world oil market are balanced through responses to price movements, with considerable complexity in the evolution of underlying supply and demand expectations. For petroleum and other liquids, the key determinants of long-term supply and prices can be summarized in four broad categories: the economics of non-OPEC supply; OPEC investment and production decisions; the economics of other liquids supply; and world demand for petroleum and other liquids. Key assumptions driving global crude oil markets in the AEO2014 Reference case over the projection period include: average economic growth of 1.9% per year for major U.S. trading partners20 and average economic growth of 4.0% per year for other U.S. trading partners. Growth in petroleum and other liquids use occurs almost exclusively outside the Organization for Economic Cooperation and Development (OECD) member countries, with 1.8% average annual growth in petroleum and other liquids consumption by non-OECD countries, including significantly higher average annual consumption growth in both China and India. Petroleum and other liquids production in AEO2014 from non-OPEC countries, particularly the United States, increases to levels above those in AEO2013. As a result, the OPEC market share declines to less than 40% in the near term before starting to rise again after 2016. The Brent crude oil spot price decreases from $112 per barrel (bbl) in 2012 to $92/bbl in 2017 in the Reference case (in 2012 dollars), then increases to $141/bbl in 2040 (or about $235/bbl in nominal dollars) as growing demand leads to the development of more costly resources (Figure 6). However, those resources are not as costly to develop as projected in AEO2013. Figure 5. Comparisons of population growth by projection period and age cohort in the AEO2014 and AEO2013 Reference cases (AEO2014 growth minus AEO2013 growth) 0.1 0.0 Total Ages 0-4 Ages 5-21 Ages 16 and over Ages 55-64 250 -0.2 -0.4 -0.5 -0.6 -0.7 20 History 2012 Projections 200 -0.1 -0.3 Figure 6. Average annual Brent spot crude oil prices in three cases, 1987-2040 (2012 dollars per barrel) 150 Ages 65 and over 2035 to 2040 2030 to 2035 2025 to 2030 2020 to 2025 2015 to 2020 2012 to 2040 High Oil Price 100 Reference Low Oil Price 50 0 1987 2000 2010 2020 Major trading partners include Australia, Canada, Switzerland, United Kingdom, Japan, Sweden, and the Eurozone. 6 U.S. Energy Information Administration | Annual Energy Outlook 2014 Early Release Overview 2030 2040
  • 7. AEO2014 Early Release Overview Petroleum and other liquids products With lower crude oil prices and lower gasoline demand projected in the AEO2014 Reference case, the real end-use price of motor gasoline in the United States declines to $3.03 per gallon (2012 dollars) in 2017, then rises to $3.90 per gallon in 2040 (compared to $4.40 per gallon in 2040 in AEO2013). The end-use price of diesel fuel in the transportation sector follows a similar pattern, dropping to $3.50 per gallon in 2017 and then rising to $4.73 per gallon in 2040 (compared to $5.03 per gallon in AEO2013). Although both gasoline and diesel prices dip modestly in the early years of the projection period, they increase steadily thereafter. The diesel share of total domestic petroleum and other liquids production rises, and the gasoline share falls, mostly as a result of the greenhouse gas (GHG) and CAFE standards for LDVs beginning in model year 2017. Increasing demand for diesel puts pressure on refiners to increase diesel yields and results in a rising difference between diesel prices and gasoline prices from 2017 to 2025. Legislated targets for cellulosic fuels use mandated by the Energy Independence and Security Act of 2007 (EISA2007) are not attained, as the U.S. Environmental Protection Agency (EPA)21 continues to make use of the flexibility provided in the statute to adjust those requirements. Natural gas The Henry Hub spot price for natural gas in the AEO2014 Reference case is higher than projected in AEO2013 through 2037, with price increases in the near term driven by faster growth of consumption in the industrial and electric power sectors and, later, growing demand for export at LNG facilities. A sustained increase in production follows, leading to slower price growth over the rest of the projection period. The Henry Hub spot natural gas price in AEO2014 reaches $4.80 per million Btu (MMBtu) (2012 dollars) in 2018, which is 77 cents/ MMBtu higher than in AEO2013. The stronger near-term price growth is followed by a lagged increase in supply from producers, eventually causing prices to settle at $4.38/MMBtu in 2020, which is still notably higher than in AEO2013. After 2020, increases in natural gas spot prices are driven by continued but slower growth in U.S. demand and net exports. The Henry Hub spot natural gas price rises to $7.65/MMBtu in 2040, an increase of $3.28 from 2020 but 4% below the 2040 price projection in AEO2013. In AEO2014, production grows to 37.5 Tcf in 2040, compared with 33.1 Tcf in AEO2013. A price increase starting in 2033 is far less pronounced than was projected in AEO2013, in part because the growth in net exports from the United States slows significantly. Regional spot price projections throughout the United States follow the same general pattern as the Henry Hub spot price. However, the average Lower 48 spot price generally increases at a slightly slower rate than the Henry Hub spot price, because regional production growth outside those areas that serve the Henry Hub is projected to be somewhat faster than the growth in production that serves the Henry Hub. Coal The average minemouth price of coal increases by 1.4% per year in the AEO2014 Reference case, from $1.98/MMBtu in 2012 to $2.96/MMBtu in 2040 (2012 dollars). The upward trend of coal prices primarily reflects an expectation that cost savings from technological improvements in coal mining will be outweighed by increases in production costs associated with moving into reserves that are more costly to mine. The upward trend in the minemouth price of coal in the AEO2014 Reference case is similar to the trend in the AEO2013 Reference case, but the average price through the projection period in AEO2014 is generally lower, primarily reflecting a lower price outlook for coking coal. Relative to minemouth prices, the average delivered price of coal to all sectors (excluding exports) increases at a slightly slower pace of 1.0% per year, from $2.60/MMBtu in 2012 to $3.43/MMBtu in 2040. The slower growth rate primarily reflects modest growth in average coal transportation rates, which increase by 0.2% per year in AEO2014—from $0.83/MMBtu in 2012 to $0.89/ MMBtu in 2040—as a result of gradually increasing fuel costs and changes over time in the pattern of coal distribution. U.S. coal exports, which have surged in recent years from 50 million short tons in 2005 to a record 126 million short tons (MMst) in 2012, have become an increasingly important source of revenue for both U.S. coal producers and coal transportation companies (primarily railroads and barge companies). In 2012, coal export revenues totaled about $15 billion, representing about 25% of all U.S. coal revenues, despite the fact that coal exports in 2012 represented only 12% of total U.S. production (short tons). In the AEO2014 Reference case, U.S. coal export prices increase by 1.2% per year, to $6.40/MMBtu in 2040. Electricity Following the decline of natural gas prices since 2008, real average delivered prices for electricity have dropped consistently (although more gradually) since 2009, to 9.8 cents per kilowatthour (kWh) in 2012. Retail electricity prices are influenced by fuel prices, and particularly by natural gas prices. However, the relationship between retail electricity prices and natural gas prices is complex, and many factors influence the degree to which, and the timeframe over which, they are linked. Those factors include the share of natural gas generation in a region, the level of costs associated with the electricity transmission and distribution systems, 21 U .S. Environmental Protection Agency, “2014 Standards for the Renewable Fuel Standard Program: Proposed Rule,” 40 CFR Part 80 [EPA-HQOAR-2013-0479; FRL-9900-90-OAR], RIN 2060-AR76, Federal Register, Vol. 78, No. 230 (Washington, DC: November 29, 2013), pp. 7173271784, http://www.gpo.gov/fdsys/pkg/FR-2013-11-29/pdf/2013-28155.pdf. U.S. Energy Information Administration | Annual Energy Outlook 2014 Early Release Overview 7
  • 8. AEO2014 Early Release Overview the mix of competitive versus cost-of-service pricing, and the number of customers who purchase power directly from wholesale power markets. As a result, it can take time for changes in fuel prices to affect electricity prices, and the impacts can vary from region to region. In the AEO2014 Reference case, electricity prices are higher throughout the projection than they were in the AEO2013 Reference case. Natural gas prices for electricity generators are higher than those in AEO2013 in the first few years but fairly similar in the long term. Reliance on natural gas-fired generation remains strong, as a result of additional near-term retirements of coal-fired and nuclear capacity, and natural gas prices continue to influence electricity prices. In the long term, both natural gas prices and electricity prices rise. Electricity prices, which in 2030 are 10.4 cents/kWh (2012 dollars) in the AEO2014 Reference case, compared with 9.9 cents/kWh in the AEO2013 Reference case, continue rising to 11.1 cents/kWh in 2040 in AEO2014, compared with 11.0 cents/kWh in the AEO2013 Reference case. The AEO2014 Reference case includes an updated calculation of electricity prices in competitive regions that better represents payments required to maintain reserve capacity, contributing to higher projected electricity prices relative to AEO2013. In addition, the updated regional reserve margin requirements in AEO2014 generally are higher and thus more costly than those in AEO2013. Delivered energy consumption by sector22 Transportation Delivered energy consumption in the transportation sector declines from 26.7 quadrillion Btu in 2012 to 25.5 quadrillion Btu in 2040 in the AEO2014 Reference case (Figure 7) because of a significant decline in energy consumption by LDVs that more than offsets growth in energy consumption for other modes. The decline in transportation sector delivered energy consumption is markedly different from the historical trend of 1% average annual growth in transportation energy consumption from 1975 to 2012.23 Transportation energy consumption is considerably lower in AEO2014 than projected in the AEO2013 Reference case (27.1 quadrillion Btu in 2040) with energy consumption by nearly all transportation modes reduced in AEO2014 as a result of lower macroeconomic indicators, higher energy efficiency, changing demographics, and a revised calculation of VMT. LDV energy consumption declines in the AEO2014 Reference case from 16.0 quadrillion Btu in 2012 to 12.1 quadrillion Btu in 2040, compared with 13.0 quadrillion Btu in 2040 in the AEO2013 Reference case. GHG emission standards and CAFE standards increase new LDV fuel economy through model year 2025 and beyond, with more fuel-efficient new vehicles gradually replacing older vehicles on the road and raising the fuel efficiency of the LDV stock by an average of 2.0% per year, from 21.5 miles per gallon (mpg) in 2012 to 37.2 mpg in 2040. The higher fuel economy of LDVs more than offsets increases in VMT that average 0.9% per year from 2012 to 2040, a reduction from the AEO2013 projection that reflects changes in driving behavior related to changing demographics. The average fuel economy of the vehicle stock is higher, and travel by LDVs is lower in AEO2014 than projected in AEO2013. The large decline in LDV energy consumption in AEO2014 shrinks the LDV modal share of total transportation energy consumption from 60% in 2012 to 47% in 2040. LDVs powered by motor gasoline remain the dominant vehicle type in the AEO2014 Reference case, retaining a 78% share of new LDV sales in 2040, down from their 82% share in 2012. The fuel economy of LDVs powered by motor gasoline continues to increase, and advanced technology fuel efficiency Figure 7. Delivered energy consumption by sector, subsystems are added, such as micro hybridization, which 1980-2040 (quadrillion Btu) is installed on 42% of new motor gasoline LDVs in 2040. The numbers of LDVs powered by fuels other than gasoline, History 2012 Projections 40 such as diesel, electricity, or E85, or equipped with hybrid drive trains, such as plug-in hybrid or gasoline hybrid electric, increase modestly from 18% of new sales in 2012 to 22% in 2040. Ethanol FFVs account for 11% of overall vehicle sales in 30 2040, followed by hybrid electric vehicles (excluding micro Industrial hybrids) at 5% of new sales in 2040, up from 3% in 2012, diesel vehicles at 4% in 2040, up from 2% in 2012, and plugTransportation 20 in hybrid vehicles and electric vehicles at about 1% each, both up from negligible shares in 2012. New vehicle sales shares are generally similar in AEO2014 and AEO2013 but with Residential moderate variation. In AEO2013, the new vehicle sales share 10 of motor gasoline vehicles was 80% in 2040 (with 36% of Commercial those vehicles including micro hybridization), followed by 7% for ethanol FFVs, 6% for hybrid electric, 3% for diesel, 2% for 0 plug-in hybrids, and 1% for electric vehicles. The differences 1980 1990 2000 2010 2020 2030 2040 from AEO2013 to AEO2014 result from different fuel prices, 22 23 The amount of energy delivered to the sector; no adjustment is made for the fuels consumed to produce electricity or district sources. S .C. Davis, S.W. Diegel, and R.G. Boundy, Transportation Energy Data Book, ORNL-6989 (Edition 32 of ORNL-5198) (Oak Ridge, TN: July 2013), Chapter 2, Table 2.1, “U.S. Consumption of Total Energy by End-Use Sector, 1973-2012.” 8 U.S. Energy Information Administration | Annual Energy Outlook 2014 Early Release Overview
  • 9. AEO2014 Early Release Overview updated manufacturer product offerings, changing technology attributes, and an updated view of consumer perceptions of infrastructure availability for E85 vehicles. Delivered energy demand for HDVs in AEO2014 increases from 5.3 quadrillion Btu in 2012 to 7.5 quadrillion Btu in 2040, similar to the 2040 level of 7.6 quadrillion Btu in AEO2013, and represents the largest growth among all transportation modes. Growth in industrial output in AEO2014 leads to solid growth in HDV VMT, averaging 1.9% per year from 2012 to 2040. HDV energy demand is tempered somewhat by an average 0.5% annual increase in fuel economy from 2012 to 2040 as a result of GHG emission and fuel efficiency standards for medium- and heavy-duty vehicles and engines. Competitive natural gas prices significantly increase the demand for LNG and compressed natural gas in AEO2014, from an insignificant share in 2012 to 8% of HDV energy consumption in 2040, which is less than the 13% share projected in AEO2013 because of the lower prices of competing fuels in AEO2014. The rapid growth of energy consumption by HDVs in AEO2014 increases their modal share of total transportation energy consumption from 20% in 2012 to 29% in 2040. Energy demand for aircraft grows in the AEO2014 Reference case from 2.5 quadrillion Btu in 2012 to 2.7 quadrillion Btu in 2040, which is less than the AEO2013 projection of 2.9 quadrillion Btu in 2040. Personal air travel (billion seat-miles) grows by an average of 0.7% per year in AEO2014, but improved fuel efficiency (by an average of 0.5% per year) reduces the effect on energy consumption. The difference between AEO2014 and AEO2013 stems from lower demand for personal air travel in AEO2014 as a result of lower economic growth. The aircraft share of total transportation energy consumption in AEO2014 increases from 9% in 2012 to 11% in 2040. Energy consumption by marine vessels increases from 0.9 quadrillion Btu in 2012 to 1.0 quadrillion Btu in 2040 in AEO2014, reflecting the impacts of increased foreign trade on international shipping and higher incomes on recreational boating. Pipeline energy use rises modestly, from 0.7 quadrillion Btu in 2012 to 0.8 quadrillion Btu in 2040, as increasing volumes of natural gas are produced but closer to end-use markets. Rail energy consumption remains nearly flat at 0.5 quadrillion Btu from 2012 to 2040 in AEO2014, as a result of a plateau in coal shipments and increases in fuel efficiency, which offset growth in rail transportation of other industrial commodities. Other energy use in the transportation sector, which includes both lubricants and military energy use, increases from 0.8 quadrillion Btu in 2012 to 0.9 quadrillion Btu in 2040. Marine, pipeline, other transportation, and rail energy use all are relatively minor pieces of the overall transportation energy consumption picture in AEO2014, each accounting for less energy demand than in the AEO2013 projections, as a result of lower economic growth in the AEO2014 Reference case. Industrial Approximately one-third of total U.S. delivered energy in 2012, 23.6 quadrillion Btu, was consumed in the industrial sector, which includes manufacturing, agriculture, construction, and mining. In the AEO2014 Reference case, total industrial delivered energy consumption grows to 30.2 quadrillion Btu in 2040—1.5 quadrillion Btu, or 5%, higher than the AEO2013 Reference case projection. The industrial sector becomes the largest energy consuming sector by 2018 and remains so for the rest of the projection period. The growth rate for total industrial energy consumption in the AEO2014 Reference case is greater than in AEO2013 as a result of lower natural gas prices, which boost industrial production, and greater availability of natural gas liquids (NGL).24 The industry that consumes the most energy is bulk chemicals, where total energy consumption grows from 5.5 quadrillion Btu in 2012 to 7.0 quadrillion Btu in 2040. In the AEO2014 Reference case, energy consumption by the bulk chemicals industry in 2040 is 1.2 quadrillion Btu higher than projected in AEO2013. Total manufacturing shipments in the AEO2014 Reference case also increase more rapidly than in the AEO2013 Reference case, from $4.5 trillion in 2012 to $8.4 trillion in 2040, or 87%. The growth rate for shipments in energy-intensive manufacturing is onehalf the rate for non-energy-intensive manufacturing, reflecting the continuing shift toward less energy-intensive manufacturing, such as transportation equipment, computers, and other durable metal goods. The rate of growth in all manufacturing industries is higher from 2012 to 2025 than after 2025, as a result of increased international competition in the later years of the projection. Shipments in the energy-intensive industries—refining, food, paper, bulk chemicals, glass, cement and lime, iron and steel, and aluminum—grow from $1.6 trillion in 2012 to $2.3 trillion in 2040 in the AEO2014 Reference case, an annual rate of growth of 1.3%, compared to 1.0% in the AEO2013 Reference case. The rate of increase in AEO2014 is much faster from 2012 to 2025 (2.0% per year) than from 2025 to 2040 (0.7% per year). Shipments of bulk chemicals, iron and steel, and aluminum peak in the late 2020s and decline thereafter, as export growth slows. Total energy consumption in the energy-intensive industries increases by 0.7% per year from 2012 to 2040, with almost all the growth occurring in the 2012-25 period. Energy use for heat and power in the energy-intensive industries grows from 11.5 quadrillion Btu in 2012 to 13.1 quadrillion Btu in 2040, averaging 0.9% per year from 2012 to 2025 and 0.1% per year from 2025 to 2040. With energy intensity declining in the energy-intensive industries, largely because of improvements in efficiency, the growth of energy use for heat and power is slower than the growth of shipments. In the bulk chemicals and petroleum refining industries, demand for feedstocks—which include HGL,25 petroleum (usually naphtha), and natural gas—grows by 1.3% per year on average, from 3.5 quadrillion Btu in 2012 to 5.0 24 25 Natural gas liquids include ethane, propane, normal butane, isobutane, and pentanes plus. H GL includes NGL, ethane, propane, normal butane, isobutane, natural gasoline (pentanes plus), and olefins. U.S. Energy Information Administration | Annual Energy Outlook 2014 Early Release Overview 9
  • 10. AEO2014 Early Release Overview quadrillion Btu in 2040, with average increases of 2.9% per year from 2012 to 2025 followed by a decline from 2025 to 2040 averaging 0.1% per year. Only the bulk chemical industry uses liquid feedstocks (HGL and petrochemical feedstocks), which are used to produce organic chemicals, inorganic chemicals, resins, synthetic rubber, and fibers. With demand for bulk chemicals higher in the AEO2014 Reference case than in AEO2013, consumption of liquid feedstocks also is higher in AEO2014. HGL feedstocks and petrochemical feedstocks (naphtha and heavier inputs) often can be interchanged to some degree, depending on price and the product slate. In the AEO2014 Reference case, HGL feedstock consumption totals 2.2 quadrillion Btu in 2012, 2.9 quadrillion Btu in 2025, and 2.7 quadrilion Btu in 2040; and petrochemical feedstock use totals 0.8 quadrillion Btu in 2012, 1.5 quadrillion Btu in 2025, and 1.6 quadrillion Btu in 2040. Shipments from the nonenergy-intensive manufacturing sector increase by 2.7% per year from $2.9 trillion in 2012 to $6.1 trillion in 2040 in the AEO2014 Reference case, with growth rates of 3.2% per year from 2012 to 2025 and 2.3% per year after 2025. Energy consumption for nonenergy-intensive manufacturing grows from 3.6 quadrillion Btu in 2012 to 4.9 quadrillion Btu in 2040, averaging 1.0% per year—the same rate as in the AEO2013 Reference case. In parallel with the growth of shipments, energy consumption in the nonenergy-intensive manufacturing sector grows more rapidly from 2012 to 2025 (1.3% per year) than from 2025 to 2040 (0.8% per year). In the nonmanufacturing industries—agriculture, construction, and mining—shipments grow by 1.6% per year from 2012 to 2040 in the AEO2014 Reference case, slightly less than the annual growth rate of 1.8% in the AEO2013 Reference case over the same period. Growth in the AEO2014 Reference case averages 2.8% per year from 2012 to 2025 and slows to 0.7% per year after 2025. Energy consumption by nonmanufacturing industries grows by 1.2% per year, from 4.8 quadrillion Btu in 2012 to 6.8 quadrillion Btu in 2040. While energy intensity declines somewhat in the agriculture and construction industries, it increases in the mining industry as exploration activities move over time to less desirable—and more energy-intensive—resources. Residential Residential delivered energy consumption remains roughly constant in the AEO2014 Reference case from 2012 to 2040. However, consumption levels are lower than those in AEO2013 for most fuels. In addition to lower population growth projections, the lower consumption levels in the AEO2014 Reference case are explained in part by incorporation of the 2009 RECS data, which include characteristic information such as the mix of building types in each region of the country, equipment stocks, and appliance saturation levels, as well as energy consumption estimates for three major end uses—space heating, space cooling, and water heating. In addition, weather-related demand elasticities for heating and cooling also have been updated to better align AEO projections with those in EIA’s Short-Term Energy Outlook. The AEO2014 Reference case removes the 2013 federal efficiency standard for condensing gas furnaces, based on challenges to the DOE rulemaking, first by an association of natural gas utilities and later by equipment distributors. Although natural gas use tends to be lower when the standard is included, consumption in the AEO2014 Reference case (without the standard) is lower than in AEO2013 (with the standard) through most of the projection period, largely because of changes in the end-use allocations from the 2009 RECS. An EIA-contracted report26 provides updated estimates of the installed stock and consumption of several miscellaneous electric loads, including televisions, computers, and related equipment. This update generally resulted in lower electricity consumption for these appliances than was projected in the AEO2013 Reference case. For AEO2014, outdoor lighting was added to the residential model as a separate application. In addition, cost and performance attributes for most residential lighting types were updated on the basis of EIA-contracted technology reports27 and market studies from DOE. 28 Lower costs and wider availability of LEDs result in lower energy consumption after 2020 in AEO2014 relative to AEO2013. Commercial Commercial sector delivered energy consumption grows from 8.3 quadrillion Btu in 2012 to 10.2 quadrillion Btu in 2040 in the AEO2014 Reference case, similar to the AEO2013 Reference case despite slower growth in the near term. Commercial electricity consumption increases by 0.8% per year from 2012 to 2040 in AEO2014, lower than the 1.0% average annual growth in commercial floorspace, in part because projected demand for cooling and lighting is lower than in AEO2013. Also, more rapid reductions in energy use for personal computers than previously estimated, largely because of a shift to more efficient portable devices, result in a projected 5.6% annual decline in electricity demand for commercial PC equipment in the AEO2014 Reference case. Following 26 N avigant Consulting, Inc., Analysis and Representation of Miscellaneous Electric Loads in NEMS (Washington, DC, May 2013), prepared for the U.S. Department of Energy, U.S. Energy Information Administration. 27 U .S. Energy Information Administration, “Updated Buildings Sector Appliance and Equipment Costs and Efficiency” (Washington, DC: August 7, 2013), http://www.eia.gov/analysis/studies/buildings/equipcosts/. 28 U .S. Department of Energy, Energy Efficiency Renewable Energy, Residential Lighting End-Use Consumption Study: Estimation Framework and Initial Estimates (Washington, DC: December 2012), http://apps1.eere.energy.gov/buildings/publications/pdfs/ssl/2012_residential-lighting-study. pdf, and 2010 U.S. Lighting Market Characterization (Washington, DC: January 2012), http://apps1.eere.energy.gov/buildings/publications/pdfs/ ssl/2010-lmc-final-jan-2012.pdf. 10 U.S. Energy Information Administration | Annual Energy Outlook 2014 Early Release Overview
  • 11. AEO2014 Early Release Overview slower-than-expected adoption of new data centers as a result of the recent recession, installations of new data center servers increase more in AEO2014 than in AEO2013. Growth of natural gas consumption in the commercial sector averages roughly 0.7% per year from 2012 to 2040, similar to the AEO2013 Reference case. Energy consumption by primary fuel Total primary energy consumption grows by 12% in the AEO2014 Reference case, from 95 quadrillion Btu in 2012 to 106 quadrillion Btu in 2040—1.3 quadrillion Btu less than in AEO2013 (Figure 8). The fossil fuel share of energy consumption falls from 82% in 2012 to 80% in 2040, as consumption of petroleum-based liquid fuels declines, largely as a result of slower growth in VMT and increased vehicle efficiency. Total U.S. consumption of petroleum and other liquids, which was 35.9 quadrillion Btu (18.5 MMbbl/d) in 2012, increases to 36.9 quadrillion Btu (19.5 MMbbl/d) in 2018, then declines to 35.4 quadrillion Btu (18.7 MMbbl/d) in 2034 and remains at that level through 2040. Total consumption of domestically produced biofuels increases slightly through 2022 and then remains relatively flat. Production of cellulosic biofuels is currently well under 1% of the EISA2007 targets.29 With the PTC for cellulosic biofuels scheduled to expire at the end of 2013, production of cellulosic biofuels remains below the EISA2007 target through the projection period. Within the transportation sector, which dominates demand for petroleum and other liquids, there is a shift from motor gasoline (losing more than 10% of its share of total transportation petroleum and other liquids demand over the projection) to distillate (gaining slightly less than 10% of the total). The increased use of compressed natural gas and LNG in vehicles also offsets about 3% of petroleum and other liquids consumption in the transportation sector in 2040. Domestic natural gas consumption in the AEO2014 Reference case rises from 25.6 Tcf in 2012 to 31.6 Tcf in 2040 (about 2.1 Tcf higher than in the AEO2013 Reference case). The largest share of the growth is for electricity generation. Demand for natural gas in the electric power sector increases from 9.3 Tcf in 2012 to 11.2 Tcf in 2040, with a portion of the growth attributable to the retirement of 50 gigawatts of coal-fired capacity by 2021. Natural gas consumption in the industrial sector is also higher in AEO2014 than was projected in AEO2013, as a result of the rejuvenation of the industrial sector as it benefits from surging shale gas production that is accompanied by slower growth of natural gas prices. Industries such as bulk chemicals, which use natural gas as a feedstock, are more strongly affected than others. In the residential sector, natural gas consumption declines throughout the projection. Total coal consumption increases from 17.3 quadrillion Btu (891 MMst) in 2012 to 18.7 quadrillion Btu (979 MMst) in 2040 in the AEO2014 Reference case. Coal consumption, mostly for electric power generation, falls off in 2016, the first year of the MATS. After 2016, coal-fired electricity generation increases slowly over the next 10 years as the remaining coal-fired capacity is used more intensively, but little capacity is added. Coal consumption in the electric power sector in 2040 is 17.3 quadrillion Btu (909 MMst) in the AEO2014 Reference case. This level is about 1.4 quadrillion Btu (75 MMst) lower than in the AEO2013 Reference case. No coal is consumed for CTL technology in the AEO2014 Reference case. With the implementation of the federal RFS for transportation fuels and state renewable portfolio standards for electricity generation, consumption of marketed renewable fuels grows by 1.4% per year in the AEO2014 Reference case. Marketed renewable energy includes wood, municipal waste, other biomass, and Figure 8. U.S. primary energy consumption by fuel, hydroelectricity in the end-use sectors; hydroelectricity, geothermal, municipal solid waste, biomass, solar, and wind 1980-2040 (quadrillion Btu) power in the electric power sector; and ethanol for gasoline History 2012 Projections 120 blending and biomass-based diesel in the transportation sector, of which 1.5 quadrillion Btu is included with petroleum and other liquid fuels consumption in 2040. Excluding 100 hydroelectricity, renewable energy consumption in the 27% Natural gas 30% electric power sector grows from 1.9 quadrillion Btu in 2012 80 to 4.5 quadrillion Btu in 2040, with biomass accounting for Renewables 8% 10% 27% of the growth and wind 39%. Generation of electricity (excluding biofuels) 60 from solar photovoltaic energy shows the fastest growth, 18% Coal 18% starting from a small base and accounting for 7.5% of total 8% Nuclear 8% electricity generation from all nonhydropower renewable 40 1% Liquid biofuels 2% energy sources in 2040. 20 0 1980 Petroleum and other liquids 32% 37% 1990 2000 2010 2020 2030 2040 Energy intensity From 1992 to 2012, energy use per dollar of GDP declined on average by 1.9% per year, in large part because of shifts within the economy from manufactured goods to the service sectors, 29 B ased on 2010, 2011, 2012, and 2013 evaluations of the volumes of cellulosic biofuels available, EPA substantially reduced the cellulosic biofuels obligation under the RFS for those years, with the 2013 obligation set at 6 million ethanol-equivalent gallons, less than 1% of the legislated target of 1 billion gallons. U.S. Energy Information Administration | Annual Energy Outlook 2014 Early Release Overview 11
  • 12. AEO2014 Early Release Overview which use relatively less energy per dollar of GDP. The dollar-value increase in the service sectors (in constant dollar terms) was almost 12 times the corresponding increase for the industrial sector over the same period. As a result, the share of total shipments accounted for by the industrial sector fell from 30% in 1992 to 22% in 2012 (including a slight increase from 2009 to 2012). In the AEO2014 Reference case, the industrial share of total shipments increases to 24% in 2016, after which it declines again, at a very slow rate, to 23% in 2040. Energy use per 2005 dollar of GDP declines by 43% from 2012 to 2040 in AEO2014 as the result of a continued shift from manufacturing to services (and, even within manufacturing, to less-energy-intensive manufacturing industries), rising energy prices, and the adoption of policies that promote energy efficiency. U.S. energy use per capita was fairly constant from 1990 to 2007 but began to fall after 2007. In the AEO2014 Reference case, energy use per capita continues to decline as a result of improvements in energy efficiency (e.g., new appliance and CAFE standards) and changes in the ways energy is used in the U.S. economy. Total U.S. population increases by 21% from 2012 to 2040, but energy use grows by only 12%, with energy use per capita declining by 8% from 2012 to 2040 (Figure 9). CO2 emissions per 2005 dollar of GDP have historically tracked closely with energy use per dollar of GDP. In the AEO2014 Reference case, however, with lower-carbon fuels accounting for a growing share of total energy use, CO2 emissions per dollar of GDP decline more rapidly than energy use per dollar of GDP, to 56% below their 2005 level in 2040 (or by 2.3% per year). Energy production and imports Net imports of energy decline both in absolute terms and as a share of total U.S. energy consumption in the AEO2014 Reference case (Figure 10). The decline in energy imports reflects increased domestic production of petroleum and natural gas, along with demand reductions resulting from rising energy prices Figure 9. Energy use per capita, energy use per dollar and gradual improvement in vehicle efficiency. At the same of GDP, and emissions per dollar of GDP, 1980-2040 time, natural gas exports increase (as domestic supplies (index, 2005=1) increase and it becomes attractive to liquefy the natural gas History 2005 2012 Projections for export), along with exports of motor gasoline (as demand 2.0 declines and refiners are left with more than they can sell domestically) and exports of crude oil (as lighter domestic crude oil is swapped for the heavier crudes more commonly 1.5 run in modern refineries). The net import share of total U.S. energy consumption is 4% in 2040, compared with 16% in Energy use per 2005 dollar of GDP 2012 and about 30% in 2005. 1.0 Energy use per capita 0.5 CO2 emissions per 2005 dollar of GDP 0 1980 1990 2000 2010 2020 2030 2040 Figure 10. Total energy production and consumption, 1980-2040 (quadrillion Btu) 125 100 75 History 2012 Projections 2035 3% 4% Consumption Net imports 16% 120 History 2012 Projections 100 Natural gas 31% 60 38% Renewables 12% 11% 50 40 1990 2000 2010 2020 2030 2040 Crude oil and 22% natural gas plant liquids 20% 20 25 12 Figure 11. U.S. energy production by fuel, 1980-2040 (quadrillion Btu) 80 Production 0 1980 Petroleum and other liquids U.S. production of crude oil (including lease condensate) in the AEO2014 Reference case increases from 6.5 MMbbl/d in 2012 to 9.6 MMbbl/d in 2019, 22% higher than in AEO2013 (Figure 11). Despite a decline after 2019, U.S. crude oil production remains at or above about 7.5 MMbbl/d through 2040. Higher production volumes result mainly from increased onshore oil production, predominantly from tight (very-low-permeability) formations. Offshore crude oil 26% Coal 22% 10% Nuclear 8% 0 1980 1990 2000 2010 2020 U.S. Energy Information Administration | Annual Energy Outlook 2014 Early Release Overview 2030 2040
  • 13. AEO2014 Early Release Overview provides a steady supply of domestic crude oil production, ranging between 1.6 and 2.0 MMbbl/d from 2015 through 2040, as the pace of development activity quickens and new, large development projects, predominantly in the deepwater and ultradeepwater portions of the Gulf of Mexico, are brought into production. The faster growth of tight oil production through 2020 in the AEO2014 Reference case results in higher domestic crude oil production than in AEO2013 throughout the projection. The pace of oil-directed drilling in the near term is much stronger than in AEO2013, as producers locate and target the sweet spots of plays currently under development and find additional tight formations that can be developed with the latest technologies. In the AEO2014 Reference case, tight oil production increases from 2.3 MMbbl/d in 2012 (35% of total U.S. crude oil production) to 4.8 MMbbl/d in 2021 (51% of the total). As in AEO2013, tight oil production declines in AEO2014 after 2021, as more development moves into less-productive areas. U.S. use of imported petroleum and other liquid fuels continues to decline in AEO2014 mainly as a result of increased domestic oil production. Imported petroleum and other liquid fuels as a share of total U.S. use reached 60% in 2005 before dipping below 50% in 2010 and falling further to 40% in 2012. The import share continues to decline to 25% in 2016 and then rises to about 32% in 2040 in the AEO2014 reference case, as domestic production of tight oil begins to decline in 2022 (Figure 12). Natural gas Cumulative production of dry natural gas from 2012 to 2040 in the AEO2014 Reference case is about 11% higher than in AEO2013, primarily reflecting continued growth in shale gas production resulting from the dual application of horizontal drilling and hydraulic fracturing. Another contributing factor is ongoing drilling in shale and other plays with high concentrations of NGL and crude oil, which in energy-equivalent terms have a higher value than dry natural gas. Cumulative production levels for tight gas and onshore associated-dissolved gas from oil formations exceed those in AEO2013 through 2040 by 9% and 36%, respectively, making material contributions to the overall increase in production. Natural gas prices above $6/MMBtu toward the end of the projection period encourage drilling in less-productive but still-profitable areas in tight oil, shale oil, and natural gas formations. Lower 48 offshore natural gas production fluctuates between 1.7 Tcf and 2.9 Tcf per year, similar to the pattern in AEO2013. The multiyear decline in offshore natural gas production was reversed in 2012, with 15 new deepwater projects coming on line during the year. In the AEO2014 Reference case, the United States becomes a net exporter of LNG in 2016, and it becomes an overall net exporter of natural gas in 2018, two years earlier than in AEO2013. U.S. exports of LNG from new liquefaction capacity are expected to surpass 2 Tcf by 2020 and increase to 3.5 Tcf in 2029. Net pipeline imports from Canada fall steadily until 2033, and then increase through 2040. Net pipeline exports to Mexico grow by more than 400% in the Reference case, with additional pipeline infrastructure added to enable the Mexican market to receive more pipeline natural gas from the United States. U.S. cumulative net LNG exports from 2012 to 2040 are up by 160% in AEO2014 compared with AEO2013, supported by increased use of LNG in markets outside America, strong domestic production, and low U.S. natural gas prices relative to other global markets. Coal Total U.S. coal production grows at an average rate of 0.3% per year in the AEO2014 Reference case, from 20.6 quadrillion Btu (1,016 MMst) in 2012 to 22.6 quadrillion Btu (1,121 MMst) in 2040. U.S. electricity generation accounted for 91% of total U.S. coal consumption (in Btu) in 2012. Coal production declined by more than 7% in 2012, from 1,096 MMst in 2011, mostly in response to gas-on-coal competition. In the Reference case, production recovers to 1,062 MMst by 2015, in response to a rise in natural gas prices along with a moderate increase in electricity demand. A wave of coal-fired generating capacity retirements in response Figure 12. U.S. petroleum and other liquid fuels to MATS requirements coincides with a secondary drop in supply, 1970-2040 (million barrels per day) coal production to 1,022 MMst in 2016. Total production then History 2005 2012 Projections 25 increases gradually to 1,127 MMst in 2030 before stabilizing as a result of limits on achievable long-term capacity utilization rates for available coal units compared to AEO2013. 20 15 10 Consumption 60% Net imports 40% 32% Domestic supply 5 0 1970 1980 1990 2000 2010 2020 2030 2040 Coal production from the Eastern Interior region in the AEO2014 Reference case increases at a faster rate than projected in AEO2013, because of an improved productivity outlook, with 2020 production 27 MMst (18%) higher and 2040 production 58 MMst (34%) higher than projected in AEO2013. Lower overall coal consumption and improved competitiveness of coal produced in the Eastern Interior region compared to AEO2013 lead to lower outlooks for Northern Appalachian and Powder River Basin coal production, as well as an accelerated decline in Central Appalachian production in AEO2014. As a result of changes to CTL cost assumptions, no CTL coal consumption or related production is projected in U.S. Energy Information Administration | Annual Energy Outlook 2014 Early Release Overview 13
  • 14. AEO2014 Early Release Overview AEO2014, compared with 0.3 quadrillion Btu in 2040 in AEO2013. Expectations for total U.S. coal exports in AEO2014 are generally similar to those in AEO2013, with an increase from 126 MMst in 2012 to 161 MMst by 2040. Electricity generation Total electricity consumption in the AEO2014 Reference case, including both purchases from electric power producers and on-site generation, grows from 3,826 billion kWh in 2012 to 4,954 billion kWh in 2040, an average annual rate of 0.9% that is about the same as in the AEO2013 Reference case. While growth in electricity consumption is similar overall, growth in the industrial sector is much stronger than in AEO2013, while growth in the residential sector is weaker. The combination of slow growth in electricity demand, competitively priced natural gas, programs encouraging renewable fuel use, and the implementation of environmental rules dampens future coal use. The AEO2014 Reference case continues to assume implementation of the Clean Air Interstate Rule (CAIR)30 as a result of an August 2012 federal court move to vacate the CrossState Air Pollution Rule. 31 In addition, AEO2014 continues to assume the implementation of MATS in 2016. Once MATS is in place, sulfur dioxide levels are reduced to well below the levels required by CAIR, and mercury emissions drop to 6.1 tons in 2016 from 30.8 tons in 2011 when the rule was finalized. Coal-fired power generation over the next few years is slightly higher in AEO2014 than in the AEO2013 Reference case because of higher natural gas prices during that period, as well as pending nuclear retirements that necessitate additional baseload generation. After 2020, generation from coal flattens out and remains lower than projected in AEO2013, because more coal-fired capacity is retired and fewer new coal plants are built (Figure 13). Coal-fired electricity generation has traditionally been the largest component of electricity generation, representing 37% of total generation in 2012. By 2035, however, natural gas generation is projected to surpass coal generation. Coal and natural gas each represent 34% of total generation in 2035, but by 2040 the coal share drops to 32%, and the natural gas share increases to 35%. Market concerns about GHG emissions continue to dampen the expansion of coal-fired capacity in the AEO2014 Reference case, even with the assumption of current laws and policies. Low fuel prices for new natural gas-fired plants also affect the relative economics of coal-fired capacity, as does the continued rise in construction costs for new coal-fired power plants. As retirements far outpace new additions, total coal-fired generating capacity falls from 310 gigawatts (GW) in 2012 to 262 GW in 2040 in the AEO2014 Reference case. As with all projections, projected generation shares are highly sensitive to both fuel prices and changes in policies and regulations. Alternative cases in the full AEO2014 will quantify these sensitivities. In the first few years of the projection, electricity generation using natural gas is slightly lower in the AEO2014 Reference case than in the AEO2013 Reference case because of higher natural gas prices in AEO2014. By 2017, however, natural gas-fired generation is higher in AEO2014 than in the AEO2013 Reference case, and the difference continues to grow. Additional retirements of coal and nuclear plants result in the need for new capacity, and new natural gas-fired plants are much cheaper to build than coal, nuclear, or renewable plants. In 2020, natural gas-fired generation in AEO2014 is 7% higher than in AEO2013, and in 2040 it is 16% higher. Electricity generation from nuclear power plants grows by 5% in the AEO2014 Reference case, from 769 billion kWh in 2012 to 811 billion kWh in 2040, accounting for about 16% of total generation in 2040 (compared with 19% in 2012). Nuclear generating capacity decreases from 102 GW in 2012 to 98 GW in 2020 Figure 13. Electricity generation by fuel, 1990-2040 as new construction (5.5 GW) and uprates at existing plants (0.7 GW) are more than offset by retirements in several (trillion kilowatthours) regions where existing nuclear units are facing challenging History 2012 Projections 6 economic conditions. After 2025, a small amount of new nuclear capacity comes on line as natural gas prices rise. In 2040, overall nuclear capacity is back up to 102 GW. AEO2014 5 incorporates updated information from EIA data collections regarding planned nuclear plant construction and capacity Natural gas 35% 4 uprates at existing units. 16% 9% 3 30% Renewables 16% 12% 19% 1 19% Nuclear 16% 52% 2 37% Coal 32% 3% 0 1990 1% 2000 2010 Oil and other liquids 2020 2030 1% 2040 Increased generation with renewable energy, excluding hydropower, accounts for 28% of the overall growth in electricity generation from 2012 to 2040 in the AEO2014 Reference case. Generation from renewable resources grows in response to federal tax credits, state-level policies, and federal requirements to use more biomass-based transportation fuels, some of which can produce electricity as a byproduct of their production processes. In the final decade of the projection, however, renewable generation growth is driven by increasing cost competiveness with other nonrenewable technologies. 30 U .S. Environmental Protection Agency, “Clean Air Interstate Rule (CAIR)” (Washington, DC: December 19, 2012), http://www.epa.gov/cair/. U .S. Environmental Protection Agency, “Fact Sheet: The Cross-State Air Pollution Rule: Reducing the Interstate Transport of Fine Particulate Matter and Ozone” (Washington, DC: July 2011), http://www.epa.gov/airtransport/pdfs/CSAPRFactsheet.pdf. 31 14 U.S. Energy Information Administration | Annual Energy Outlook 2014 Early Release Overview
  • 15. AEO2014 Early Release Overview Compared to the AEO2013 Reference case, renewable generation is higher throughout most of the projection period, particularly in the near term, because of the inclusion of the energy provisions of the ATRA. This law, among other things, extends several tax credits for utility-scale renewables and redefines the qualification criteria, resulting in more construction of wind-powered generating capacity in the near term. Reported renewable capacity already under construction has increased in recent years and is represented in AEO2014. Growth in renewable generation is supported by many state requirements, as well as regulations on CO2 emissions in California. The share of U.S. electricity generation coming from renewable fuels (including conventional hydropower) grows from 12% in 2012 to 16% in 2040 in the AEO2014 Reference case, even with federal subsidies for renewable generation assumed to expire as enacted. Extensions of such subsidies could have a large impact on renewable generation. The long-run projections for renewable capacity are also sensitive to natural gas prices and the relative costs of alternative generation sources. Energy-related CO2 emissions In the AEO2014 Reference case, total U.S. energy-related CO2 emissions in 2040 equal 5,599 million metric tons, 92 million metric tons (1.6%) lower than in AEO2013. However, the carbon intensity of the economy in 2040 is slightly (0.6%) higher in AEO2014 as compared with AEO2013. Projected energy-related CO2 emissions in 2020 and 2040 are, respectively, about 9% and 7% below the 2005 level, compared to 9% and 5% below the 2005 level in AEO2013. The lower GDP projection in AEO2014 is partly the result of a lower population growth rate, and GDP per capita in 2040 is almost 4% higher in AEO2014 than in AEO2013. Energy use per capita and energy-related CO2 emissions per capita are higher in AEO2014 than in AEO2013 (about 5% in 2040). Also, higher levels of energy consumption and CO2 emissions per dollar of GDP in AEO2014 occur with a sectoral shift in the share of energy consumption from the residential, commercial, and transportation sectors toward the industrial sector, which generally is more energy- and carbon-intensive than other sectors of the economy. Over the projection period from 2012 to 2040, industrial emissions grow at an average annual rate of 0.6% in AEO2014, and industrial energy-related CO2 emissions in 2040 are 133 million metric tons higher in AEO2014 than in AEO2013. When examining the electric power sector, excluding combined heat and power, there are offsetting factors in comparing AEO2014 and AEO2013. Coal use for generation is 7.9% lower in 2040 (141 billion kWh) in AEO2014 compared to AEO2013 as a result of increased retirements of coal capacity and replacement with natural gas and renewables. However, nuclear generation, which has no CO2 emissions, is also 10.1% (91 billion kWh) lower in 2040 in AEO2014 compared to AEO2013 because of more nuclear retirements in AEO2014. This offsets the CO2 reduction achieved by switching from coal to natural gas and renewables. In total, the carbon intensity of the electric power sector is lower in AEO2014 as generation declines by 0.2% (9 billion kWh), but emissions are 1.9% lower in 2040. U.S. Energy Information Administration | Annual Energy Outlook 2014 Early Release Overview 15
  • 16. AEO2014 Early Release Overview List of Acronyms AEO Annual Energy Outlook LDV Light-duty vehicle AEO2013 Annual Energy Outlook 2013 LED Light emitting diode AEO2014 Annual Energy Outlook 2014 LNG Liquefied natural gas ATRA American Taxpayer Relief Act of 2012 LPG Liquefied petroleum gases bbl Barrels LRG Liquefied refinery gases Btu British thermal units MATS Mercury and Air Toxics Standards CAFE Corporate average fuel economy MECS Manufacturing Energy Consumption Survey CAIR Clean Air Interstate Rule MMbbl/d Million barrels per day CO2 Carbon dioxide MMBtu Million Btu CTL Coal-to-liquids MMst Million short tons DOE U.S. Department of Energy NEMS National Energy Modeling System E85 Motor fuel containing up to 85% ethanol NGL Natural gas liquids EIA U.S. Energy Information Administration NGPL Natural gas plant liquids EISA2007 Energy Independence and Security Act of 2007 OECD EOR Enhanced oil recovery Organization for Economic Cooperation and Development EPA U.S. Environmental Protection Agency OPEC FFV Flexible fuel vehicle Organization of the Petroleum Exporting Countries GDP Gross domestic product PADD Petroleum Administration for Defense District GHG Greenhouse gas PTC Production tax credit GW Gigawatts RECS Residential Energy Consumption Survey HDV Heavy-duty vehicle RFS Renewable fuel standard HGL Hydrocarbon gas liquid Tcf Trillion cubic feet kWh Kilowatthour VMT Vehicle-miles traveled 16 U.S. Energy Information Administration | Annual Energy Outlook 2014 Early Release Overview
  • 17. AEO2014 Early Release Overview Table 1. Comparison of projections in the AEO2014 and AEO2013 Reference cases, 2011-2040 2025 Energy and economic factors 2040 2011 2012 AEO2014 AEO2013 AEO2014 AEO2013 Crude oil and natural gas plant liquids 15.31 17.08 23.03 18.70 19.99 17.01 Dry natural gas 23.04 24.59 32.57 29.22 38.37 33.87 Coal 22.22 20.60 22.36 22.54 22.61 23.54 Nuclear/Uranium 8.26 8.05 8.15 9.54 8.49 9.44 Hydropower 3.11 2.67 2.84 2.86 2.90 2.92 Biomass 3.90 3.78 5.08 5.27 5.61 6.96 Other renewable energy 1.70 1.97 3.09 2.32 3.89 3.84 Other 0.80 0.41 0.24 0.85 0.24 0.89 Total 78.35 79.15 97.36 91.29 102.09 98.46 Petroleum and other liquid fuelsa 18.78 16.55 11.41 15.89 13.65 15.99 Natural gas (- indicates exports) 2.03 1.58 -3.41 -1.56 -5.81 -3.55 Coal/other (- indicates exports) -2.32 -2.86 -3.16 -3.02 -3.69 -2.95 Total 18.49 15.26 4.85 11.31 4.15 9.49 Petroleum and other liquid fuelsa 36.56 35.87 36.28 36.87 35.35 36.07 Natural gas 24.91 26.20 28.97 27.28 32.32 29.83 Coal 19.62 17.34 19.03 19.35 18.75 20.35 Nuclear/Uranium 8.26 8.05 8.15 9.54 8.49 9.44 Hydropower 3.11 2.67 2.84 2.86 2.90 2.92 Biomass 2.60 2.53 3.74 3.82 4.26 4.91 Other renewable energy 1.70 1.97 3.09 2.32 3.89 3.84 Other 0.35 0.39 0.35 0.30 0.35 0.29 Total 97.11 95.02 102.45 102.34 106.31 107.64 Residential 21.39 20.10 20.58 21.08 21.48 23.08 Commercial 18.05 17.61 18.77 19.04 20.88 21.13 Industrial 30.46 30.54 37.43 35.46 38.33 36.16 Transportation 27.21 26.77 25.67 26.75 25.62 27.27 Total 97.11 95.02 102.45 102.34 106.31 107.64 Domestic crude oil production 5.66 6.49 9.00 6.79 7.48 6.13 Other domestic production 4.71 4.60 5.14 5.63 5.22 5.83 Net imports 8.57 7.50 5.12 7.08 6.02 7.00 18.92 18.49 19.27 19.50 18.73 18.95 22.61 24.12 31.93 28.65 37.61 33.21 1.96 1.51 -3.41 -1.58 -5.80 -3.55 24.38 25.64 28.35 26.87 31.63 29.54 Primary energy production (quadrillion Btu) Net imports (quadrillion Btu) Energy consumption by fuel (quadrillion Btu) Energy consumption by sector, including losses in electricity generation (quadrillion Btu)b Petroleum and other liquid fuels (million barrels per day) Consumption Natural gas (trillion cubic feet) Dry gas production + supplemental gas Net imports (- indicates exports) Consumption U.S. Energy Information Administration | Annual Energy Outlook 2014 Early Release Overview 17
  • 18. AEO2014 Early Release Overview Table 1. Comparison of projections in the AEO2014 and AEO2013 Reference cases, 2011-2040 (continued) 2025 Energy and economic factors 2040 2011 2012 AEO2014 AEO2013 AEO2014 AEO2013 1,109 1,027 1,128 1,134 1,139 1,195 96 118 135 124 160 123 1,003 891 993 1,010 979 1,071 Brent spot crude oil (dollars per barrel) 113.24 111.65 108.99 119.45 141.46 165.57 West Texas Intermediate spot crude oil (dollars per barrel) 96.55 94.12 106.99 117.41 139.46 163.54 4.07 2.75 5.23 4.96 7.65 7.97 41.74 39.94 49.67 52.94 59.16 62.37 10.1 9.8 10.1 9.7 11.1 11.0 13,299 13,593 18,769 18,985 26,670 27,277 1.134 1.154 1.421 1.429 1.913 1.871 10,150 10,304 14,162 14,259 19,724 19,785 5,926 6,147 8,778 8,548 10,994 10,616 7.30 6.99 5.46 5.39 3.99 3.95 312.3 314.6 347.0 356.5 380.5 404.4 5,498 5,290 5,526 5,501 5,599 5,691 Coal (million short tons) Production and waste coal Net exports Consumption Prices (2012 dollars) Natural gas at Henry Hub (dollars per million Btu) Domestic coal at minemouth (dollars per short ton) Average electricity price (cents per kilowatthour) Economic indicators Real gross domestic product (billion 2005 dollars) GDP chain-type price index (2005 = 1.000) Real disposable personal income (billion 2005 dollars) Value of industrial shipments (billion 2005 dollars) Primary energy intensity (thousand Btu per 2005 dollar of GDP) Population (millions) Energy-related carbon dioxide emissions (million metric tons) a Includes petroleum-derived fuels and non-petroleum-derived fuels, such as ethanol and biodiesel, and coal-based synthetic liquids. Petroleum coke, which is a solid, is included. Also included are natural gas plant liquids and crude oil consumed as a fuel. b Electric power sector consumption is distributed to the end-use sectors. Notes: Quantities reported in quadrillion Btu are derived from historical volumes and assumed thermal conversion factors. Other production includes liquid hydrogen, methanol, and some inputs to refineries. Net imports of petroleum include crude oil, petroleum products, unfinished oils, alcohols, ethers, and blending components. Other net imports include coal coke and electricity. Both coal consumption and coal production include waste coal consumed in the electric power and industrial sectors. Sources: AEO2014 National Energy Modeling System, run REF2014.D102413A; and AEO2013 National Energy Modeling System, run REF2013. D102312A. 18 U.S. Energy Information Administration | Annual Energy Outlook 2014 Early Release Overview