Aumentó por sexto año consecutivo la capacidad de generación renovable
•
0 recomendaciones•119 vistas

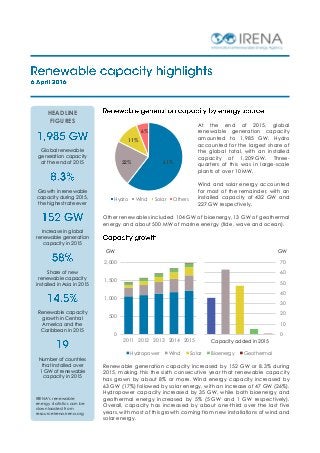
A finales de 2015, mundial capacidad de generación renovable ascendió a 1.985 GW, representando un aumento de 152 GW o 8,3% durante 2015, haciendo de este el sexto año consecutivo en el que la capacidad renovable ha crecido alrededor de un 8% o más. La energía hidroeléctrica con 1.209 GW de capacidad instalados, es la de mayor proporción del total mundial. Tres cuartos de esta capacidad total hidroeléctrica corresponde a plantas de más de 10 MW.

Recomendados
Recomendados
Más contenido relacionado
Más de Mario Albarrán Mendoza
Más de Mario Albarrán Mendoza (20)
Último
Último (20)
Aumentó por sexto año consecutivo la capacidad de generación renovable
- 1. At the end of 2015, global renewable generation capacity amounted to 1,985 GW. Hydro accounted for the largest share of the global total, with an installed capacity of 1,209 GW. Three- quarters of this was in large-scale plants of over 10 MW. Wind and solar energy accounted for most of the remainder, with an installed capacity of 432 GW and 227 GW respectively. Other renewables included 104 GW of bioenergy, 13 GW of geothermal energy and about 500 MW of marine energy (tide, wave and ocean). Renewable generation capacity increased by 152 GW or 8.3% during 2015, making this the sixth consecutive year that renewable capacity has grown by about 8% or more. Wind energy capacity increased by 63 GW (17%) followed by solar energy, with an increase of 47 GW (26%). Hydropower capacity increased by 35 GW, while both bioenergy and geothermal energy increased by 5% (5 GW and 1 GW respectively). Overall, capacity has increased by about one-third over the last five years, with most of this growth coming from new installations of wind and solar energy. 0 500 1,000 1,500 2,000 2011 2012 2013 2014 2015 Hydropower Wind Solar Bioenergy Geothermal 0 10 20 30 40 50 60 70 Capacity added in 2015 GW GW 61%22% 11% 6% Hydro Wind Solar Others HEADLINE FIGURES Global renewable generation capacity at the end of 2015 Growth in renewable capacity during 2015, the highest rate ever Increase in global renewable generation capacity in 2015 Share of new renewable capacity installed in Asia in 2015 Renewable capacity growth in Central America and the Caribbean in 2015 Number of countries that installed over 1 GW of renewable capacity in 2015 IRENA’s renewable energy statistics can be downloaded from resourceirena.irena.org
- 2. For the complete dataset see: IRENA, 2016, Renewable Capacity Statistics 2016, available at: www.irena.org/publications Over 80% of renewable capacity is in Asia, Europe and North America. In 2015, Asia accounted for 58% of new capacity, bringing its total to almost 800 GW or 40% of global capacity. Asia was also one of the fastest growing regions, with a 12.4% increase in renewable capacity. Capacity increased by 24 GW (5.2%) in Europe and 20 GW (6.3%) in North America. With the exception of South America, the other global regions account for a smaller share of global renewable capacity, but capacity increased by about 5% or more in all of these regions. Particularly noticeable was the increase of 14.5% in Central America and the Caribbean, where a number of major solar plants were commissioned in 2015. However, the expansion of renewables remains mostly focused on a few countries, with only 19 countries installing over one gigawatt during 2015 and these countries accounting for over 90%. Hydropower: In 2015, three-quarters of new hydro capacity was installed in Brazil, China, India and Turkey (26.3 GW in total). Over one gigawatt of new capacity was also installed in Europe, North America and the Middle East (Iran), plus 550 MW in Africa. Wind energy: About 95% of wind capacity is located in Asia (China and India), Europe and North America; and 90% of new capacity was installed in those regions in 2015 (57.1 GW). However, wind energy is also starting to expand rapidly in other regions such as South America, where capacity increased by 3.1 GW (40%) in 2015. Bioenergy: Almost 40% of bioenergy capacity is in Europe, with another 30% in Asia and the remainder divided equally between North and South America. Growth in 2015 was similarly distributed, with an increase of 1.8 GW in Europe, 1.7 GW in Asia and the remainder elsewhere. Solar energy: At the end of 2015, Europe accounted for 43% of global solar capacity, with another 40% in Asia (mostly China and Japan) and 13% in North America. The major development in 2015 was the 48% increase in solar capacity in Asia, where 15 GW of new capacity was installed in China and another 10 GW in Japan. An increase of 8 GW in North America also surpassed the level of new installations in Europe (7.6 GW) for the first time. Capacity also expanded significantly in Oceania and Africa, with additions of 1 GW and 0.9 GW respectively. Almost all of the growth in 2015 came from increases in solar photovoltaic capacity, with concentrated solar power expanding by a relatively modest 270 MW. Geothermal energy: Geothermal power capacity increased by about 600 MW in 2015. Four countries (Italy, Mexico, Turkey and the United States of America) accounted for almost all of this increase. Capacity 497 GW Global share 25% Increase +24 GW Growth +5.2% Capacity 330 GW Global share 17% Increase +20 GW Growth +6.3% Capacity 89 GW Global share 4% Increase +4.0 GW Growth +4.7% Capacity 17 GW Global share 1% Increase +1.3 GW Growth +7.8% Capacity 797 GW Global share 40% Increase +88 GW Growth +12.4% Capacity 26 GW Global share 1% Increase +1.4 GW Growth +5.6% Capacity 37 GW Global share 2% Increase +2.2 GW Growth +6.3% Capacity 12 GW Global share 1% Increase +1.5 GW Growth +14.5% Capacity 180 GW Global share 9% Increase +9.1 GW Growth +5.3%