Sustainability Report 2013 from Dublin City, Ireland
•
2 recomendaciones•1,792 vistas

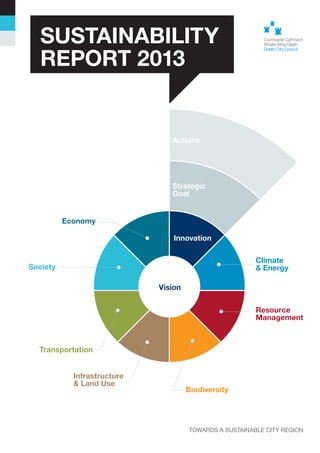
Holistic sustainability approach across Society, Economy, Innovation, Climate & Energy, Transportation, Infrastructure & Land Use, Biodiversity and Resource Management

Recomendados
Más contenido relacionado
La actualidad más candente
La actualidad más candente (20)
Destacado
Destacado (7)
Similar a Sustainability Report 2013 from Dublin City, Ireland
Similar a Sustainability Report 2013 from Dublin City, Ireland (20)
Último
Último (20)
Sustainability Report 2013 from Dublin City, Ireland
- 1. PART A SUSTAINABILITY REPORT 2013 Actions Strategic Goal TOWARDS A SUSTAINABLE CITY REGION Biodiversity Society Resource Management Climate & Energy Innovation Vision Economy Transportation Infrastructure & Land Use
- 2. VISION* Within the next 25-30 years Dublin will have an established international reputation as one of the most sustainable, dynamic and resourceful city regions in Europe.Dublin,throughthesharedvisionofits citizens and civic leaders, will be a beautiful, compact city, with a distinct character and a vibrant culture, and a diverse, smart, green innovation based economy. It will be a socially inclusive city of urban neighbourhoods, all connected by exemplary public transport, cycling and walking system and interwoven withaqualitybiodiversegreenspacenetwork. In short, the vision is for a capital city where people will seek to live, work and experience as a matter of choice. * Dublin City Development Plan 2011 – 2017
- 3. DISCLAIMER Dublin City Council has made every effort to ensure that the information given in this work is accurate and complete. However, we give no representation or warranty, expressed or implied, as to its accuracy or completeness and assume no responsibility for any loss or damage arising out of the provision of this report. Given the dynamic nature of the data included in the report, readers are encouraged to reference the external data sources wherever possible for the most accurate and up-to-date content. Additionally, the policies and strategies of the council relating to each theme have been interpreted from a sustainability perspective and you are encouraged to refer to Dublin City Council’s website, for the latest council policies, goals and actions. 2013 KEY INITIATIVES 4 FOREWORD 5 INTRODUCTION 5 DUBLIN CITY COUNCIL 6 REPORT APPROACH 7 SUSTAINABILITY INDICATORS 8 INDICATOR FRAMEWORK 9 BASELINE & BENCHMARKING 10 FLAGSHIPS 11 SOCIETY – CULTURE 12 CULTURE INDICATORS 13 SOCIETY – COMMUNITY & ENGAGEMENT 14 COMMUNITY & ENGAGEMENT INDICATORS 15 SOCIETY – HEALTH & WELL-BEING 16 HEALTH & WELL-BEING INDICATORS 17 ECONOMY 18 ECONOMY INDICATORS 19 INNOVATION 20 INNOVATION INDICATORS 21 CLIMATE & ENERGY 22 CLIMATE & ENERGY INDICATORS 23 TRANSPORTATION 24 TRANSPORTATION INDICATORS 25 INFRASTRUCTURE & LAND USE 26 INFRASTRUCTURE & LAND USE INDICATORS 27 BIODIVERSITY 28 BIODIVERSITY INDICATORS 29 RESOURCE MANAGEMENT 30 RESOURCE MANAGEMENT INDICATORS 32 SNAPSHOT OF THE REGION 33 APPENDIX I – GRI INDEX 34 GLOBAL REPORTING INITIATIVE INDEX '1 in 5 jobs in Ireland are located in Dublin City'(CSO, 2006) 'Dublin is the 35th most liveable city in the world'(Mercer, 2012) 'Dublin City Council has over 500 services and over 6000 staff'(www.dublincity.ie, 2012) 'Dublin is the 9th most bicycle friendly city in the world'(Copenhagenize Index, 2011) 'In 2011, Dublin City Council had an energy savings of 13,446MWh'(CODEMA, 2012) 'Just over 30% of the entire transport network, including 90% of primary network has cycle facilities'(Transport Department, Dublin City Council, 2012) 'There have been over 4 million journeys on Dublinbikes to date'(www.dublinbikes.ie, 2012) 'The City has a population of 527,612 (Dublin Region has a population of 1.27 million)'(CSO, 2012) 'Dublin City has 78 square metres of green space per person' (Creative Dublin Alliance – Discovering Dublin's Identity, 2011) Dublin ranked overall the fourth most prosperous city in the 2012/13 UN prosperity index , State of the Worlds Cities, UN 2013 Dublin 13th friendliest place in world Conde Nast Traveler survey, 2013 CONTENTS
- 4. Sustainability Report 2013 – Towards A Sustainable City Region 4 2013 KEY INITIATIVES The 21st century will be a century of cities and Dublin has the resources, physical characteristics, and governance models required to become an internationally recognised smart city and a gateway to Europe. The following key initiatives highlight our progress in 2013. DIGITAL DUBLIN Digital Dublin is an alliance between Government, Business, Higher Education, and Citizens. This alliance is developing Dublin as one of the world’s leading smart, innovative, and intelligent cities. In 2013, Digital Dublin delivered a Digital Masterplan for the city. This provides an innovation roadmap, and will result in increased efficiency in the management of the city, its resources, and everyday activities. As a key implementation milestone, the city rolled out free public WiFi in early 2013 with the intention of enhancing Dublin’s economic success, its ability to attract talent and investment, and its international standing. DUBLINKED This first-of-its-kind data sharing initiative for the Dublin Region sees previously unreleased public operational data being made available online for others to research or reuse. Datasets are detailed within the Dublinked Datastore, ranging from planning, transport, environment, arts, culture and heritage. In addition to the data, Dublinked hosts a variety of workshops, thematic events and Dubmeets. DCU INNOVATION CAMPUS Innovation Campus Opened in January 2013, the Innovation Campus will be a national centre for innovation in the cleantech sector, one of the fastest growing areas of economic activity, worth more than €5 trillion globally. The campus will attract new high-growth, cleantech enterprises that wish to locate in a supportive entrepreneurial ecosystem, international entrepreneurs wishing to take advantage of advanced R&D capabilities, university spinout companies, and student and graduate start-ups. Dalkia, the utilities and energy management service provider, is the first tenant in the new campus. DUBLINBIKES EXPANSION 2013 marked the beginning of the €35m expansion of the dublinbikes network which further integrated the scheme into the fabric of Dublin city, with 102 stations and 1,500 bikes planned by July 2014. Members have taken over six million journeys since the scheme transformed public transport in 2009. Dublin City also opened the Tolka Valley Park Greenway. Facilities like this and the Grand Canal Way Cycle Route have played a critical role in growing green transport numbers in the city. SUSTAINABILITY GATHERING 2013 Held in December, the one-day Gathering brought together finance, enterprise and policy stakeholders in the green economy. The high-level panel participants outlined the best sustainability practices of leading cities and organisations. The event offered practical perspectives on how best to achieve a prosperous transition to sustainability, marked by increased investment and employment in Ireland. ACTIVATING DUBLIN Activating Dublin is a joint initiative of Dublin City Council, Dublin Chamber of Commerce and Central Government aimed at generating growth and employment in the Dublin Region. The vision is to transform Dublin into a great international city to live, work and visit. As an illustrative example a unique pilot programme was established with Google, Facebook, and PayPal to help Irish Businesses get online and develop a more effective online trading presence. ECOMERIT EcoMerit assists small, medium and large businesses in saving money by looking closely at energy, waste and other resource use costs. EcoMerit finds cost-efficient ways of increasing efficiency directly and through the supply chain, resulting in a greener business. Dublin City Council works with EcoMerit, Dun Laoghaire – Rathdown County Council, Waterford County Council, Cork County Council and the EPA to identify opportunities for greening businesses. DUBLIN CITY BETA PROJECTS This innovative approach to trialling of new products and processes was initiated by a member of staff who identified the opportunity through his work in City Architects. It provides a better way for Council staff and Dublin citizens to discuss issues and opportunities, and to test ideas at city and local level using quicker, cheaper, reversible trials which enables early discussion and measurements.
- 5. Sustainability Report 2013 – Towards A Sustainable City Region 5 FOREWORD I am pleased to present Dublin City Council’s 2013 Sustainability Report. This report lays out in detail the vision, strategic goals, achievements and future actions for the city in eight focus areas. The accomplishments described in this report are a testament to our efforts to make Dublin a better place to live, work, and visit. By taking a holistic approach to sustainability we can better balance the needs of residents, businesses and partners in the city. This report also seeks to empower citizens by giving them information on how the city is developing over time and on our efforts to ensure economic, social and environmental resources are used efficiently. I am proud to have been a part of the dublinbikes expansion program this year. To date, members have taken over six million bike journeys in the city through the scheme. Programs of this calibre reinforce positive community values like sustainability, health and well-being, and civic pride. At its heart, the concept of sustainability is about collaboration, balance, and consideration for future generations. The 2013 Sustainability Report illustrates the positive impacts that our sustainability efforts are having. The initiatives described within are constructing a future for the city that is secure, prosperous, and where Dublin is recognized internationally as the gateway to Europe. Oisín Quinn Ardmhéara Bhaile Átha Cliath Lord Mayor of Dublin INTRODUCTION As the City Manager I am keenly aware of the challenges facing the city, and I am privileged to work directly with people and projects that are meeting them. Dublin is an attractive world-class city and sustaining this position is central to our future vision. In practical terms this means managing our staff, infrastructure and resources efficiently and intelligently. As a consequence of major national policy changes, Dublin City Council is undergoing transformation and I am confident that this process will result in us being better able to respond to future opportunities. However, we do not operate in isolation and we rely upon partners in the city, including state bodies, private industry and academia, to work with us to achieve positive change. One successful example of partnership is Activating Dublin, an initiative where we are working with the Dublin Chamber and central government to help get more business trading online, to provide better supports to startups and drive forward on our smart city and open data agenda. This and other examples of best practice and innovation are explained in more detail in the report and I encourage you to use it as a starting point to engaging with us on these issues. I look forward to working with you on our shared future. Owen Keegan Bainisteoir na Cathrach City Manager We have published these reports since 2010 and in 2012 we published an accompanying indicators report to better measure our progress. The workshops held during this process encouraged us to widen our scope beyond resource management to include themes such as wellbeing and innovation. As a consequence, in 2013 we have reported against eight themes and have integrated high-level indicators into a single report. There continue to be issues of indicator suitability and data availability and we would welcome feedback on how to improve on this. Additionally, we hope to expand our use of the Global Reporting Initiative (GRI) index. The index helps to standardise reports so that they become comparable between organisations. In this way we can more easily benchmark ourselves against peers nationally and internationally. As in previous years we are publishing this report exclusively online. This is consistent with the principles behind the report but also allows us to increase usability. Hyperlinks (in bold text) help users access further information more easily. Being online also increases the audience for the reports and they have been viewed thousands of times across the world. Our sustainability reporting is an evolving process and we look forward to your feedback on how to improve it further. Mark Bennett Oifigeach na nGnólachtaí Glasa Green Business Officer
- 6. Sustainability Report 2013 – Towards A Sustainable City Region 6 DUBLIN CITY COUNCIL Dublin City Council is the democratically elected local authority that governs Dublin City. It is the largest local authority in Ireland. The elected members of the council determine overall policy, while the City Manager and his staff carry out the day-to-day management of services. POLITICAL ORGANISATIONAL STRUCTURE 5 Area Committees Central North Central South Central South East North West 6 Strategic Policy Committees (SPCs) Arts, Culture, Leisure and Youth Affairs Enviroment and Engineering Transportation & Traffic Housing Economic Development, Planning and International Affairs Finance Corporate Policy Group Lord Mayor Chair of 6 SPCs City Manager Lord Mayor of Dublin Dublin City Council (52 Elected Members) CITY OF DUBLIN ADMINISTRATIVE AREAS Dublin City is divided into 5 administrative areas. These are called Local Areas and are used to co-ordinate the delivery of services. Wherever possible, the Sustainability Report considers both the direct impacts to this area, as well as the wider implications for the Greater Dublin Region. ENGAGEMENT Sustainability is mainstreamed into all of the Council’s planning and activities. Looking to the future, our goal is to play a lead role in creating a city and region premised on sustainable prosperity. As part of this process, we recognise the vital importance of stakeholder engagement. We would like to encourage an open and honest dialogue as part of this process and encourage feedback from stakeholders. Thoughts, opinions, and ideas are all welcome via email at sustainability@dublincity.ie and through facilities such as Dublinked, Your Dublin Your Voice, and others. To find out more about Dublin City Council, its governance, and services, visit dublincity.ie
- 7. Sustainability Report 2013 – Towards A Sustainable City Region 7 REPORT APPROACH Dublin City Council acknowledges that sustainability challenges and opportunities are often complex and overlapping; they cannot be addressed in isolation, and instead require a comprehensive, systems-based approach. As such, our sustainability efforts must address integrated social, economic, and environmental objectives. To coordinate this diversity of effort and the complexity of the subject matter, we have relied on several internationally recognized tools and methodologies, and have employed standard reporting structures across eight sustainability themes. Standard for Sustainability Reporting The Global Reporting Initiative (GRI), an international standard for sustainability reporting, has influenced the contents of this report. Over 4000 organisations from 60 countries are now using the GRI framework for creating balanced, accurate, clear and reliable reports. The index found at the end of this report directs readers to where GRI standard disclosures are referenced. As our sustainability planning evolves we will endeavour to include an increasing number of these disclosures. Strategic Sustainable Development The Natural Step Framework for Strategic Sustainable Development is being used to integrate sustainable practices into Dublin City Council’s work. The internationally recognized framework has been developed over 25 years and places an emphasis on impact, replicability, flexibility, and backcasting. Its purpose is to address challenges and sustainably empower organisations and communities to innovate and accesses new opportunities. Four primary principles form the basis for the framework and have guided the vision and actions of Dublin City Council. Minimise the consumption of materials extracted from Earth's crust Mitigate impacts through wise land-use policies, low impact maintenance operations and sustainable design. Reduce our dependence on man-made chemicals. Pursue policies and actions that maximise stakeholder's ability to meet their basic needs. Report Structure This report is organised around eight key themes with a series of quantitative indicators as measures of performance. The themes and indicators chosen are illustrative of Dublin City Council’s holistic approach to sustainability, balancing social, economic, and environmental development. The report provides opportunities for monitoring and review that are important for strategic planning. Within the body of the report, the following content is elaborated upon for each thematic area. 1. Vision: A specific vision driven by both practical achievability and ambitious long-term impact. 2. Context & Strategic Goals: The context sets out the major internal and external factors impacting the theme and its progress. Achievable five to ten year strategic goals are outlined to assess and guide operations. 3. Achievements & Future Actions: Illustrative examples of activities past and future that are helping to achieve the vision 4. Indicators: Each theme is followed by data and commentary relating to our performance according to sustainability indicators. These indicators are described in greater detail on the following page.
- 8. Sustainability Report 2013 – Towards A Sustainable City Region 8 SUSTAINABILITY INDICATORS Our 2011 report, “Developing a Framework for Sustainability Indicators for Dublin” began the process of framing a shared vision for sustainable development in the Dublin Region. The report identified several sustainability themes represented by more than 30 performance indicators. Indicators were selected as part of a considered process designed to address inclusive stakeholder participation, international best practices, and future goals and planning. More information on the indicator selection process can be found in the 2011 report. Stakeholder workshop 2 The selected headline indicator suite was reviewed Stakeholder workshop 1 Defined vision and themes from the existing vision and themes of development plans across the region and stakeholder input Indicator review Compiled a list of over 300 indicators under the ten themes Indicator selection 37 provisional headline indicators were selected Final report The feedback from the second workshop was used to finalise the headline indicator suite Literature Review Stakeholder Interviews The Indicator selection process as detailed in the Sustainability Indicators Framework (Dublin Regional Authority, Trinity Haus & DCC, 2011) The Value of Data The sustainability indicators offer an empirical window into the current state of the region’s sustainability efforts and a measurable means to track future progress and success. The diverse environmental, economic, and social indicators presented in this report bring together data drawn from a host of international, national, regional, and local sources. The sustainability indicators are designed to: 1. Baseline the current position of the Dublin Region; 2. Benchmark against international best practices and set performance targets; and 3. Communicate performance to policymakers and citizens in an open and transparent manner. The collection, analysis, and dissemination of these indicators run parallel to Dublin City Council’s mission to enable transparency and data-driven innovation across the region. By linking data and metrics with planning and actions, we hope to demonstrate the value of open-data and its practical applications. This year the sustainability indicators have for the first time been incorporated into the body of the Sustainability Report. Due to data availability, not all indicators are updated. Additionally, space limitations have restricted extended analysis of all indicators. Please refer to the 2012 Indicators Report for additional indicator information.
- 9. Sustainability Report 2013 – Towards A Sustainable City Region 9 INDICATOR FRAMEWORK Following a series of interviews with key stakeholders throughout the region a number of workshops were held to outline an agreed upon vision for the sustainable development of the region. The vision was broken into key concepts, referring to economic, social, and environmental development. This vision is supported by eight themes, each represented by a series of indicators upon which to measure the progress of the region towards its overall sustainable development vision. Transportation Infrastructure & Land Use Biodiversity ResourceManagement Society Economy Innovation Climate&Energy A city region promoting vibrant culture and a diverse innovation based economy which supports the livelihoods and well-being of its citizens A city region that protects and improves the natural environment and manages resources efficiently while maximising energy security and adapting to local and global challenges A socially inclusive capital city region of resilient communities with a high quality public domain connected through exemplary pedestrian, cycling and integrated transport networks Burglaries, Robberies & Thefts Per Annum Voter Participation % Of Population Born Outside Ireland Cultural Venues Per 10,000 Inhabitants Attendance At Cultural Events Per Capita Life Expectancy At Birth Perceived General Health Of Population Physical Activity Of Adults % Of People Who Volunteer Schools Awarded A Green Flag Tourism Numbers Per Annum % Of Population At Risk Of Poverty Unemployment Rate Gross Value Added Per Capita At Basic Prices Retention Rates For Secondary Schools Population With 3rd Level Education Broadband Quality Total R&D As A Percent Of GDP GHG Emissions Per Capita % Renewables Of Total Energy Consumption Energy Consumption % Zoned Land At Risk Of Flooding % Of Population Living Within Half Kilometer Of A Bus Corridor Or One Kilometer From A Train/Luas Stop Road Accidents Mean Travel Time To Work, School Or College Modal Split To Work, School, Or College % Population Both Living And Working In The Dublin Region Vacancy Rates % Of Inhabitants Within 300m Of Basic Services Tidy Town Awards Population Trends Of Birds Loss Or Gain Of Hedgerows Waterways Classified As At Least ‘Good’ In Status Exposure To Particulate Matter Household Waste Production Per Inhabitant % Household Waste Recycled Domestic Water Consumption
- 10. Sustainability Report 2013 – Towards A Sustainable City Region 10 BASELINE & BENCHMARKING Having established a broad vision of the future, the first step towards reaching this vision is to develop a clear picture of Dublin’s sustainability position—its baseline. The Sustainability Report relies on a number of sources for baseline and benchmarking data, three of these sources are outlined below. DUBLIN CITY SUSTAINABLE ENERGY ACTION PLAN In 2005 Dublin’s energy agency Codema, on behalf of Dublin City Council, began developing the Dublin City Sustainable Energy Action Plan (SEAP). The most recent version was published in 2010 and is currently being updated. The plan contains a vision of Dublin becoming an energy-smart and efficient city and evaluates how to reduce energy consumption in areas such as planning, transport, residential and commercial buildings, while incorporating the use of renewable energy. As a signatory to the Covenant of Mayors, Dublin City has joined over 2,000 cities and towns in a commitment to the principles of best practice in energy policy, while going beyond the EU targets of a 20% reduction in carbon emissions by 2020. In the specific case of the City Council’s own energy use—for public lighting, water pumping, public buildings and facilities, and our fleet of vehicles, Dublin City Council intends to be the embodiment of good practice and has set a more ambitious target of 33% reduction over the timescale of the Action Plan. The results of the updated report will provide an update on the baseline from which we can measure progress and ensure that our objectives are being achieved. THE 2009 EUROPEAN GREEN CITY INDEX The European Green City Index measured the environmental performance of 30 leading European cities. Dublin ranked 21st overall with a score of approximately 54 out of 100. Dublin’s results were strong in the air quality category, where the city ranked fourth overall, but poor showings in other categories, including buildings and carbon dioxide (CO2 ) emissions, lowered the overall score. As a baseline measure, this data provides a foundation for setting targets and monitoring our progress in future editions of the report. THE CARBON DISCLOSURE PROJECT The Carbon Disclosure Project (CDP) reporting platform helps organisations to measure and disclose their greenhouse gas emissions, water use and climate change strategies. This information is made publicly available for use by a wide audience including institutional investors, corporations, policy makers and their advisors, public sector organisations, government bodies, academics and the public. The CDP collects data in a standardised way, making it available to the global marketplace. Dublin City Council expressed its intention to engage in CDP disclosures in our 2010 report and started doing so in 2011. Ireland began CDP reporting in 2009 with a report devised by KPMG, with additional support from the Environmental Protection Agency (EPA), Sustainable Energy Authority Ireland (SEAI) and McCann Fitzgerald. Over 40 of the largest companies in Ireland by market capitalisation are now taking part. 0 2 4 6 8 10 BuildingsAir Quality Waste and Land Use Transport Water CO 2 Environmental governance Energy Dublin Best Average
- 11. Sustainability Report 2013 – Towards A Sustainable City Region 11 FLAGSHIPS Every year we identify a flagship location or initiative that highlights actions towards sustainability. These projects illustrate how multiple actions can support each other. The flagship approach raises awareness, creating the opportunity for piloted actions to be replicated on a wider scale. Over the last four years, successful initiatives have been deployed across the region and the last three are described below. We are grateful to the individuals and teams who have driven these projects and look forward to future progress. 2010 Kilbarrack Fire Station, a 40 year old building, became the first carbon neutral Fire Station in the world through the hard work and dedication of staff. The project and staff won many prizes, including; The National Green Leader Award, 2011, International Green Apple Award and an International Green Hero Award for the project leader. A Biodiversity Action Plan was developed and the actions continue to protect the local eco systems and Biodiversity Action Days were held involving nine local National Schools 2011 Pearse Street Library was extensively renovated in 2000 and re-opened in 2003. The facilities and services offered by the library were modernised, while the heritage of the building was maintained. The library is an excellent model for Dublin City Council’s commitment to the preservation of our history and culture, while guaranteeing the advancement of innovation and the knowledge economy. In 2011 among other activities, Pearse Street Library hosted meetings of the Sustainable Energy Communities Programme and was an information resource for sustainability activities throughout the city. 2012 The Green IFSC, in partnership with the Sustainable Energy Authority of Ireland (SEAI) and Dublin City Council, created the ‘Greening the IFSC’ initiative in a bid to ensure Ireland has one of the most resource efficient financial centres in the world. The first-of-its-kind project was also designed to assist companies operating from the IFSC to measure their carbon footprint and collaborate on plans to reduce resource consumption and ultimately to improve their efficiency and competitive advantage. The project is ongoing. The Green Way drives productivity and innovation using the cluster’s ‘triple helix’ of competencies in industry capability, academic RD&I, and government engagement. Within The Green Way, Irish cleantech companies benefit from access to academic institutions, access to procurers of cleantech products and services, and access to test beds and a talent pool provided by all cluster members. A focal point for this initiative was the DCU Innovation Campus, where The Green Way established permanent offices. 2013 Emerge is the project name for the Dublin City element of the Sustainable Energy Community initiative launched by SEAI in 2011. The initiative saw the formation of three exemplar communities around Ireland to demonstrate best practice in sustainable energy. In 2012, the Emerge team concentrated on a 4 km2 zone in Dublin City Centre and included two additional nodes, Grangegorman and Ballymun. Projects mainly represented energy efficient improvement measures, specifically in public buildings and social housing. In 2013, the Emerge Steering Committee decided to focus its activities on the Dublin Docklands as the area is home not only to world leaders in finance and technical innovation but also to schools, residential housing and small indigenous businesses. Many of these companies have strong expertise in implementing energy efficiency schemes in the workplace and can act as leaders for promoting sustainable energy practice. This past year the initiative resulted in the creation of a GIS energy map of the Docklands with the first energy benchmark for the area. Metering of a selection of public buildings was also undertaken to collect valuable real-time data, and case studies were developed highlighting energy best practices in the Docklands area.
- 12. Sustainability Report 2013 – Towards A Sustainable City Region 12 SOCIETY – CULTURE Dublin’s character and culture are vital assets that help the city compete as an international capital. They also enrich and enhance the everyday quality of life for Dublin’s citizens. By making this a priority within the Development Plan, the City Council is protecting and developing Dublin’s character and culture for the future. VISION: From medieval architecture to modern art, Dublin has a global reputation for character and culture. Protecting and promoting this reputation is vital to Dublin’s success as a tourist destination and as a desirable place to live. CONTEXT & STRATEGIC GOALS: In addition to enhancing the quantity and quality of cultural events throughout the city, Dublin City Council is dedicated in its efforts to enhance the character of the city through the conservation of its built heritage. Work has taken place on many street monuments, the medieval City Wall, and protected structures such as St. Luke’s and Numbers 3 & 4 Henrietta Street. In recent years Dublin has benefitted from several new cultural facilities including the National Dance Centre, the Science Gallery in Trinity College and the Lighthouse Cinema in Smithfield. Cultural quarters are emerging at Heuston and Merrion Square, while existing areas such as Parnell Square and Temple Bar continue to give the city a distinctive cultural edge. PIVOT Dublin is a Dublin City Council initiative, devised and co-ordinated by Dublin City Architects that has established itself as a focus for Irish design initiatives and created a resurgence of international interest in Irish design. Dublin’s street patterns, architectural features, civic and industrial buildings contribute significantly to the city’s identity. We must protect this unique character while also allowing the city to develop and grow. Throughout the next decade we must also strive to unlock the tourism potential of the medieval city, regenerate historic areas and encourage regeneration to keep older structures in use. ACHIEVEMENTS & FUTURE ACTIONS: 2013 marked the year of The Gathering, Ireland’s biggest ever tourism initiative, a year-long programme of festivals, events, and gatherings. In Dublin, these diverse events included sport, music, literature, dance and in particular, family-friendly fun and entertainment. The city also saw the return of cultural favourites, including St. Anne’s Rose Festival in St. Anne’s Park, the Bram Stoker Festival, the Dublin Marathon 2013, and NYE Dublin. There were also many local festivals supported throughout the City including the Gathering of Vikings in Clontarf, the Docklands Summer Festival, the LiFT Youth Arts Festival in Ballymun, and the Kilmainham Arts Festival. Dublin City Council is proud to be directly associated with many of these Festivals as either a producer or partner. Ongoing initiatives like the €100,000 International IMPAC DUBLIN Literary Awards promote excellence in world literature as well as provide an opportunity to promote Irish writing internationally. This year over 31,000 people attended the Festival of Curiosity, Dublin’s first annual festival of science. The 2013 festival programme featured free day- time events for families and children and was accompanied by an evening programme of interactive science debates, discussions and shows that intrigued and challenged. Work is underway to expand the festival for 2014. As we look ahead, we must acknowledge and celebrate cultural diversity in the city, provide affordable living and working environments for new artists and add more art to public areas. Specific objectives include ensuring that fit-for-purpose, accessible, cultural facilities are provided as part of larger developments in the City Centre, and continuing to create a coherent network of attractive, integrated streets and spaces with supporting tourism and cultural signage. FURTHER READING Events Galore In Dublin City In 2013 Three Irish Authors Nominated For 2014 International Impac Dublin Literary Award. Igniting Ireland’s Cultural And Creative Capital Grafton Street To Get Unique Street Art As Part Of Council Grand Design Dip Into Dublin City Council Events Culture Night 2013
- 13. Sustainability Report 2013 – Towards A Sustainable City Region 13 CULTURE INDICATORS Due to poor data availability the collection of relevant indicators that measure and baseline performance in Culture, Arts and Heritage are incomplete. % OF THE POPULATION BORN OUTSIDE OF IRELAND: One fifth of the total population usually resident and present in the Dublin Region is now foreign born. Diversity is a key component of a contemporary and progressive urban society and knowledge economy. In 2011 there were 248,917 foreign born persons residing in Dublin, up from 127,933 in 2002 (+51%). 0 5 10 15 20 25 30 2011 2006 2002 DublinState Population Born outside of Ireland (Usually resident and Present on Census night) % Source: CSO, 2012 In 2011, persons born in the United Kingdom accounted for 23% of the foreign born population in Dublin. Persons born in Poland accounted for 13.5%, while persons born in Romania and Lithuania accounted for 4.7% and 4% respectively. At a national level the foreign born population has also increased significantly in recent years rising from 10.4% in 2002 to 16.9% in 2011. In 2011 there were 766,770 foreign born persons residing within the state, up from 400,016 in 2002, ( +52%). In 2011, persons born in the United Kingdom accounted for 38% of the foreign born population in Ireland. Notably, the Polish born population accounted for 15% of the foreign born population in the State while Lithuanian nationals accounted for 4.5%. NUMBER OF CULTURAL VENUES AND ATTENDANCE AT CULTURAL EVENTS PER CAPITA: There is currently no centralised database at a national or city level that captures the information required for this indicator. As an interim measure we have included the number of visitors to the top tourism attractions in Ireland in 2012. For the second year running the Guinness Storehouse has topped the indicator with an increase of 61,532 visitors on 2011. The iconic Dublin attraction grew its visitor numbers by almost 6% to 1,087,209, followed closely by the Dublin Zoo with 1,029,417 (up 3% on 2011) and the Cliffs of Moher Visitor Experience attracting 873,988 visitors (up 8% on 2011). The National Gallery of Ireland continued its popularity among free attractions in Ireland—recording over 660,000 visitors last year followed by the National Botanic Gardens at 544,685. 0 200,000 400,000 600,000 800,000 1,000,000 1,200,000 StPatrick’sCathedral,Dublin TaytoPark,Meath NationalMuseum ofIreland(Archaeology),Dublin NationalBotanicGardens,Dublin BookofKells,Dublin TheNationalGalleryofIreland,Dublin NationalAquaticCentre,Dublin CliffsofMoherVisitorExperience,Clare DublinZoo,Dublin GuinnessStorehouse,Dublin Top Ten Tourist Attractions 2012 Source: Fáilte Ireland 2012
- 14. Sustainability Report 2013 – Towards A Sustainable City Region 14 SOCIETY – COMMUNITY & ENGAGEMENT Public participation is a critical and integral aspect of the sustainable development agenda. Dublin City is committed to the promotion of sustainable urban development and the current Dublin City Development Plan sets out this vision for the city. VISION: Through the shared vision of its citizens and civic leaders, Dublin will support a vibrant culture and will be a socially inclusive city of urban neighbourhoods with distinct character. CONTEXT & STRATEGIC GOALS: Only through collaboration between citizens, business, research and academia, and local government can the city achieve its vision. To this end, local authorities seek to meet the needs of their communities in an accountable and transparent manner. This requires effective governance that allows for compliance with national policy and a balance between local objectives and wider strategic/national interests. City Council staff participate in a host of events aimed at these objectives, including Family Fun Days, Resident Associations, Local Festivals, Lets Walk and Talk, and Passport for Leisure. The Dublin City Community Forum was established to represent more than 700 community and voluntary groups from all areas of Dublin City. Member groups include those representing residents, tenants, the arts, the environment, childcare, youth, disability, new communities, diversity, the homeless, and sports & recreation. ACHIEVEMENTS & FUTURE ACTIONS: In 2013, Dublin City Council supported community and engagement by providing more than 827 grants to a wide range of community groups. Equality and Diversity was the theme of this years’ Dublin City Social Inclusion Week. The week celebrated diversity and promoted the right of all citizens to be treated equally. Among the many events that took place was a photographic exhibition ‘Dublin’s Working Prams’ in the Central library and ‘Champions Day’, a sports day for people with different abilities. This year Dublin became the first city in a first world country to join the UN Women’s Safe Cities Programme. Dublin already is one of the world’s safest cities and Dublin City Council is committed to making it the safest city in the world for all citizens. To innovate you must experiment and learn, this is the new approach by Dublin City Council to encourage, support and facilitate experimentation and innovation. The ‘Dublin City Beta Projects’ initiative offers a systematic approach to discuss issues and opportunities, co-create solutions, and prototype them ‘on the street’ for measurement and debate. 2013 also marked the release of the Dublin City Digital Master Plan and the establishment of Digital Dublin Day. Integral to these initiatives is the recognition that technology is a tool for engagement with benefits that extend beyond the digital domain. In partnership with Intel Labs Europe and Trinity College Dublin, Dublin City Council launched the CityWatch Initiative. The project created a mobile app that allows participants to submit positive reports on what they see around them, such as biodiversity and events with eco-friendly themes, as well as negative observations such as a lack of bike lanes or littering. In this way we hope to enable citizens to become collaborators around city-greening initiatives. All the feedback is received by the city to help policy makers craft better programs and fix problems more rapidly. Our innovation lab The Studio led a number of street conversation projects with members of the public in the Sandymount, Ballymun, Finglas and in the City Centre on ageing, play, the docklands strategic development plan and the proposed elected mayor for Dublin. Additionally, 'Your Dublin Your Voice' held two surveys through 2013 which have informed council policies. FURTHER READING Dublin City Development Plan Local Anti-Poverty and Social Inclusion Strategy The Future Is OURS – Integration Strategy & Action Plan Dublin City Council receives Excellence in Local Government Awards Dublin signs up to UN Safe Cities Global Programme Social Inclusion Awareness Week Dublin hosts European Conference aiming to make diversity work Dublin wins bid to host ‘One Young World Annual Summit’ in 2014 Dublin – A City of Welcome Potential and Opportunity
- 15. Sustainability Report 2013 – Towards A Sustainable City Region 15 COMMUNITY & ENGAGEMENT INDICATORS Good governance is an important aspect of sustainable development. It is necessary for the public to be and to feel engaged in the decision making processes and empowered to make changes themselves. NUMBER OF BURGLARIES, ROBBERIES AND THEFTS: There has been an increase in Dublin from 2009 in the numbers of offences (burglaries, robberies and thefts). Nationally, Ireland performs slightly better than the EU average for perceptions of crime, violence or vandalism (10th out of 27 EU nations in the European Quality of Life Survey (EQLS 2012)). This indicator highlights the number of reported offences in the Dublin Region over the period of 2004-2012. 0 5000 10000 15000 20000 25000 30000 35000 40000 Theft and related offences Burglary and related offences Robbery, extortion and hijacking offences 201220112010200920082007200620052004 No. of Burglaries, Robberies & Thefts Per Annum – Dublin Region Recordedoffences Source: CSO, 2012 % OF PEOPLE WHO VOLUNTEER: The 2012 European Quality of Life Survey (EQLS) places Ireland 3rd highest within the EU 27 for volunteering. Figures from Volunteer Ireland also show a large increase of +104% in volunteer registrations from 2008-2012 (Volunteer Ireland 2014). SCHOOLS AWARED A GREEN FLAG: This indicator looks at the number of schools in the Dublin Region who have received a green flag. We have seen steady improvement in participation and attainment in the Dublin Region from 2004-2010 with over 551 schools now registered. Source: Waste Management Plan for the Dublin Region 0 100 200 300 400 500 600 700 800 Schools in Region 201020092008200720062004 Schools Awarded a Green Flag Schools Registered in Programme Schools Awarded a Green Flag Dublin Region No.ofSchools VOTER PARTICIPATION: Upward trend in voting participation in general elections by Irish residents (69.9% in 2011). Nationally, voting levels were slightly higher than the EU 27 average in 2011 of 69.6%. In local elections there was a participation level of 49.6% in 2009. 0 10 20 30 40 50 60 70 80 Dublin Region State 201120072002 General Election Turnout Rate % Source: Waste Management Plan for the Dublin Region
- 16. Sustainability Report 2013 – Towards A Sustainable City Region 16 SOCIETY – HEALTH & WELL-BEING The health and well-being of our citizens is a cornerstone of Dublin City’s public policy. The physical, mental, and social experiences of citizens are considered in maintaining and growing a city with a high quality of life. VISION: Dublin will be a city where everyone’s quality of life has improved through involvement in healthy activities and through access to a people-centred and community-based health care system. CONTEXT & STRATEGIC GOALS: Health is a multi-agency concern, and the successful implementation of plans and strategies requires dialogue and co- ordination between many stakeholders. There are many council activities that target improved health and well-being. The Dublin City Sports Network was established in 2003 to source funding from the Irish Sports Council under the Local Sports Partnership scheme. Its aim is to promote participation in sport and physical activity by raising awareness of the activities and facilities available and by developing programmes and events to encourage participation. Ensuring an age-friendly city is a major priority for the council. Dublin has developed unique initiatives to support older people in society. These include the Passport for Leisure Programme, the AccessDublin business initiative, the Walk and Talk events, the Your Dublin-Your Voice Opinion Panel and the Community ICT initiatives with Dublin Institute of Technology. The Dublin Region Homeless Executive is provided by Dublin City Council as the lead statutory local authority in the response to homelessness in Dublin and adopts a shared service approach across the region. ACHIEVEMENTS & FUTURE ACTIONS: In 2013, the Lord Mayor launched the 5 Alive Challenge for the following year. The activities highlight the benefits of a healthy and active lifestyle as a vital part of a person’s wellbeing. Dublin City Council and the FAI are working on a joint bid to host a package of UEFA EURO2020 games at Aviva Stadium. Sustainability is a vital element of the bid and a sustainable approach to the hosting the games is a mandatory requirement In the important domain of mental health, the Technology for Well-Being International Conference was held in Dublin this year. Industry experts in the technology and mental health fields gathered to offer discussion on the positive role technology plays in supporting general well-being. In September 2013, Dublin City Comhairle na nÓg launched their DVD on Mental Health “Dare to Talk”. The event is an example of local young people taking action to help themselves and others. Since their AGM in 2012, mental health has been the main focus for Comhairle members. It is hoped that the DVD will support young people in maintaining good mental health. In 2005 Dublin city council hosted Ireland’s first ever Playday in Merrion Square Park. National Playday is now an annual event to promote play and encourage communities throughout the country to organise energetic and health-focused play activities in their own cities, neighbourhoods, streets, parks and open spaces. The theme for this year’s event was ‘Street Games’ which was aimed at communities taking action to encourage and support children and young people playing outdoors more often. The annual Cold Weather Initiative for 2013 provided an emergency humanitarian response to the needs of persons who may be sleeping rough during cold weather. The Housing First Demonstration Project offered tenancies to persons with extensive rough sleeping and homeless histories and with significant support needs. FURTHER READING Dublin Sport Official Street Count Figures On Rough Sleeping For Winter 2013 Across The Dublin Region Let’s Stay Fit! O’Connell Street Gets Sporty The Lord Mayor’s 5 Alive Challenge Reaches The Finish Line!
- 17. Sustainability Report 2013 – Towards A Sustainable City Region 17 HEALTH & WELL-BEING INDICATORS The health and overall wellbeing of the population is of central importance to the sustainable development of the Dublin Region. LIFE EXPECTANCY AT BIRTH: Life Expectancy continues to increase in Dublin and Ireland. However, Ireland still has lower than average EU levels (males 5th lowest and females 3rd lowest of the EU15 nations in 2006). These figures rose from 76.8 years (males) and 81.6 years (females) in 2002. 73 74 75 76 77 78 79 80 Male 2006 Sweden Italy Netherlands Spain France Greece UK Germany Austria Luxembourg Ireland Belgium Denmark Finland Portugal Male Life Expectancy 2006 75.5 76.8 78.8 Source: CSO Database, 2012 Source: CSO Database, 2012 78 79 80 81 82 83 84 85 Female 2006 Spain France Italy Sweden Finland Austria Germany Belgium Portugal Netherlands Greece Luxembourg Ireland UK Denmark Female Life Expectancy 2006 80.7 81.6 84.4 GENERAL HEALTH OF POPULATION: Very high levels of self-perceived health are apparent. Within the European Quality of Life Survey (EQLS 2012), Ireland ranks first of 27 EU nations. The CSO comments that self-perceived health provides a well validated and widely used measure of actual health, despite its subjective nature. PHYSICAL ACTIVITY OF ADULTS: The Irish Sports Monitor publication produced by the Irish Sports Council and the Economic Social Research Institute provides trend data on this indicator from 2007 to 2011. A notable highlight is the upward trend in levels of physical activity. Ireland ranked 3rd of 27 EU nations in daily physical activity levels in 2012 European Quality of Life Survey. 10 15 20 25 30 35 Sedentary Just Active Fairly Active Highly Active 2011200920082007 % Level of Recreational Physical Activity Source: The Irish Sports Monitor 2007–2011 Source: CSO, 2012 0 10 20 30 40 50 60 70 Dublin RegionState Perceived level of General health 2011 % 60.3 60.8 28.0 27.2 7.5 1.3 8.0 1.2 0.3 2.2 0.3 2.9 Very good Good Fair Bad Very Bad Not Stated
- 18. Sustainability Report 2013 – Towards A Sustainable City Region 18 ECONOMY The Irish economy is undertaking a profound transition from a model built around debt, construction and housing to one based on innovation, enterprise and exports. Dublin City Council and partners are working to support existing businesses and attract new businesses and social entrepreneurs to set up in the city. VISION: Dublin will be a location of choice for indigenous and foreign companies to establish clean and green businesses. It will be home to a rich and diverse SME sector, social enterprises and excellence in corporate citizenship will enhance Dublin’s international reputation. CONTEXT & STRATEGIC GOALS: At a national level, the Action Plan for Jobs has been established to reconfigure the economy so that long term sustainable jobs are created and so that the mistakes of the past will not be repeated. At the city level, the Dublin City Council Economic Development Unit (EDU) works, in collaboration with a range of key agencies in both the public and private sectors, to create the right conditions for strong economic activity and to increase Dublin’s global competitiveness. The unit coordinates the delivery of the Economic Action Plan for the Dublin City Region, providing support to the Creative Dublin Alliance, co-ordinating the annual Innovation Dublin festival, as well as the operation of the Business Support Unit. The Economic Action Plan sets out the key priorities for the development of Dublin as an internationally competitive city region. Its aim is to position the Dublin City Region, the engine of Ireland’s economy, as a significant hub in the European knowledge economy through a network of thriving sectoral and spatial clusters providing a magnet for creative talent and investment. It takes the involvement of many stakeholders to turn this vision into reality, so the plan is a core project of the Creative Dublin Alliance. The Alliance has the membership of the four main Higher Educational Institutions in Dublin—UCD, Trinity College Dublin, DCU and the DIT—along with the Dublin Chamber of Commerce, IBEC, the IDA and Enterprise Ireland. Along with the work of the Dublin Regional Authority and the Economic Development Units in each of the Dublin Local Authorities to co- ordinate the delivery of the Action Plan, an intrinsic part of measuring the impact of the Economic Action Plan is the development of City Indicators and ongoing monitoring of Dublin’s performance in international benchmarking. This reveals Dublin’s international profile and highlights areas of concern, that then become the focus of efforts through the Economic Action Plan. ACHIEVEMENTS & FUTURE ACTIONS: Activating Dublin is a joint initiative of Dublin City Council, Dublin Chamber, central government and social sectors — aimed at generating growth and employment in the Dublin Region. The vision is to transform Dublin into a great international city to live, work and visit. The resources required to realise this are at Dublin’s disposal, but need to be ‘activated’. Activating Dublin | Online is a unique partnership with Google, Facebook, and PayPal to help Irish Businesses get online and develop a more effective online trading presence. Activating Dublin | Startups has the intention of further promoting Dublin as a successful startup city with a thriving ecosystem to support a wide range of startup tech businesses. Other projects currently in progress include Supporting Youth Activation, Smart Cities, and Open Data. Finally, for the duration of his time in office, Lord Mayor Oisín Quinn has committed to firmly establishing Dublin City as the business Gateway to Europe. During 2013 our two flagship projects of 2012 have been progressing well. An executive director is in place for The Green Way and two international events were held in the city. A Cluster Managers Forum attracted attendees from across Europe, while a Cleantech Investment Conference brought investors and businesses together. The Green IFSC project has continued to attract funds and talent to Dublin and the year was capped off with a major Sustainability Gathering event in Dublin Castle, bringing policy, finance and enterprise sectors together. FURTHER READING Event Gets Dublin Ready, Set, ‘Startup’ For New Businesses Technology Fights Poverty – Dublin Showing The Way Digital Hub – Dublin's digital cluster Dublin City Enterprise Board – support start ups across Dublin City
- 19. Sustainability Report 2013 – Towards A Sustainable City Region 19 ECONOMY INDICATORS This theme is of vital importance to the region’s future development and relates to the development of a diverse innovation based economy. UNEMPLOYMENT RATE: National unemployment decreased by 41,700 (-12.8%) in the year to Q3 2013 bringing the total number of persons unemployed to 282,900. This is the fifth quarter in succession where national unemployment has declined on an annual basis. Ireland still has one of the highest unemployment rates in Europe (8th of 28 in 2013). The high rate of long-term unemployment is of particular concern. Source: CSO, 2013 0 10 20 Dublin State 2013Q32012Q32011Q32010Q32009Q32008Q32007Q32006Q32005Q32004Q32003Q32002Q32001Q32000Q31999Q31998Q3 % International Labour Organisation Unemployment Rate (%) by Quarter GROSS VALUE ADDED (GVA) PER CAPITA AT BASIC PRICES: GVA per capita continues to decline (down 11.6% since 2010). The level of national GDP per capita is high in the international context (Ireland is 3rd in the EU28), while Dublin (Greater Dublin Area) is 50th out of 300 global metros by GDP per capita (Brookings Metro Monitor, 2012). PERCENTAGE OF POPULATION AT RISK OF POVERTY: In 2011, the at risk of poverty rate increased to 16.0% from 14.7% in 2010. An analysis by socio-demographic characteristics showed that those most at risk of poverty in 2011 were people living in accommodation that was rented at below the market rate or was rent free (36.4%) and those living in households where there was no one at work (33.2%). Further, the Dublin Region Homeless Executive conducts a count every six months of people sleeping rough in the capital. The spring 2013 count saw a 30% rise in people sleeping rough on 2012’s figure, itself a 25% rise on 2011. Source: CSO survey on Income and Living conditions 2007, 2009, 2010 0 10 20 State 201120102009200820072006 % At Risk of Poverty Rate South & Eastern Region TOURISM NUMBERS: This indicator looks at the number of overseas visits to Dublin per annum. There appears to be signs of recovery following a decline in the tourism numbers in recent years (2008-10). Overseas visits are up in the Dublin Region by 6.7% from 2010 to 2012. 0 5 10 Dublin Ireland 2012201120102009200820072006200520042003200220012000 Source: CSO Overseas Visits MillionVisits
- 20. Sustainability Report 2013 – Towards A Sustainable City Region 20 INNOVATION Cities and urban environments are a driving force for innovation across the world. Dublin will continue to be Ireland’s engine for sustainable economic growth and innovation. VISION: Build on Dublin’s existing high capacity for innovation and use that advantage to develop as an exemplar smart city. CONTEXT & STRATEGIC GOALS: Dublin has been developing smart city capability for many years. One element of this is the Digital Dublin initiative that will help the city use digital tools and solutions effectively. The initiative has published a Digital Masterplan which uses a Digital Maturity Scorecard jointly developed by Intel Labs, NUI Maynooth, Imperial College London and Dublin City Council. This scorecard helps direct investment to where it will have the greatest impact. Dublin City Council is promoting the city as a test-bed and living laboratory for innovative solutions to city challenges. One enabler of this is our policy of open innovation, whereby the council adopts a default position of releasing project data for wider benefit (always respecting and ensuring data protection for individuals). This is evidenced by projects such as Dublinked, a data- driven innovation network that hosts city-generated data from traffic, air, and other data sources. ACHIEVEMENTS & FUTURE GOALS: In 2013, a number of key events put Dublin in the spotlight as a global hub for innovation. Open Innovation 2.0 was a collaborative event coordinated by Intel, Dublin City Council and the European Commission among others. Global thought leaders from industry, academia and government gathered in Dublin to work on a new innovation approach for Europe. Over the course of the 2013 Web Summit, Dublin became the centre of attention for the technology world globally. Ten thousand delegates gathered in the RDS to hear 350 speakers discuss the state of technology and its future. The Innovation Dublin Festival is a Creative Dublin Alliance project created with a view to supporting the considerable talent and innovation found throughout the city. Initiatives such as Dublin Talks were convened to showcase many of the talented people and ideas taking shape in Dublin. Dublin City Council is working closely with companies such as IBM and Intel to develop a Smart Cities approach that allows us to use the power of information and communication technology to better manage the city. Examples of this include water pressure monitoring and control on water pumps to save water and electricity, and a smartphone app that enables users to report features and services in the city that they like and don’t like. These and other approaches allow the council to more efficiently target limited resources and to anticipate future issues. In 2013 the Science Gallery celebrated its 5th year with a €1.8m award from the Wellcome Trust. It also held an exhibition called ‘Grow Your Own’, where it invited visitors to consider some of the potentially ground-breaking applications and uncertain implications of synthetic life and brought together engineers, scientists, designers, artists and biohackers to design ‘living machines’. FURTHER READING New Forum Forges Creative Design Possibilities Dublin Can Be The Number One Tech Startup City In Europe Digital Dublin Day, Encouraging Public To Engage With Technology Across The City Dublin City Goes Digital With Free Wifi DUBLIN RANKED THE 20TH MOST REPUTABLE CITY IN THE WORLD REPUTATION INSTITUTE, 2013 9 OF THE TOP 10 GLOBAL SOFTWARE LEADERS ARE IN DUBLIN AND 8 OF THE TOP 10 US COMPANIES ARE LOCATED HERE THREE OF THE TOP 8 EUROPEAN START UP ACCELERATORS AND INCUBATORS ARE LOCATED IN DUBLIN TECHCOCKTAIL 2012 DUBLIN PROJECTED TO BE 22ND MOST COMPETITIVE GLOBAL CITY IN 2025 (EIU, 2013) DUBLIN 3RD BEST METRO TO INVEST IN WESTERN EUROPE SITE SELECTION MAGAZINE, 2013
- 21. Sustainability Report 2013 – Towards A Sustainable City Region 21 INNOVATION INDICATORS In order to achieve an innovation-based economy it is necessary for the Dublin Region to continue its focus on the education of its citizens and to strengthen its investment in R&D and infrastructure. % OF POPULATION WITH THIRD LEVEL EDUCATION: Very positive performance with Ireland ranking 3rd in the EU 27 for tertiary education attainment amongst 15-64 year olds, while Dublin was ranked as the top international city for human capital in 2011 (EIU, 2012). 0 10 20 30 40 50 60 2011 2006 2002 StateDublin RegionSouth DublinFingalDLRDublin City Third Level Education Attainment % Source: CSO 2011 RETENTION RATE IN SECONDARY SCHOOLS: Steady rate of improvement nationally. Retention rates in Dublin are similar to national figures. Good performance in the EU context, 7th of 27 EU nations for the 20-24 year age cohort (Eurostat). INVESTMENT IN R&D: Despite being below the EU average for overall spend in Research and Development (R&D) as a proportion of GDP, Ireland’s performance continues to improve and move closer to the average. BROADBAND QUALITY (SPEEDS): Broadband penetrations levels continue to increase now up to 65% (Eurostat, 2012), though Ireland remains behind the EU 27 average. Connection speeds in Ireland and Dublin are lagging in the international context with Ireland ranking 42nd in the world (NetIndex, 2013). Gross Expenditure on R&D as % of GDP InvestmentasaproportionofGDP(%) Source: Eurostat 2012 0 10 20 30 40 50 60 70 80 90 Dublin 28.7 88.58 (20)Macau,MO Am sterdam ,NL DenHaag,NL Taoyüan,TW Helsinki,FI Cluj-Napoca,RO Lyon,FR Riga,LV Tokyo,JP Vilnius,LT Göteborg,SE Marseille,FR Bucharest,RO Taipei,TW Seoul,KR Singapore,SG Kowloon,HK Paris,FR CentralDistrict,HK (1)Tim isoara,RO Average Broadband Speeds by City (May 2011 – Nov 2013) Mbps Source: Netindex.com, 2013 0 1 2 3 4 5 EU 27 Ireland 2012 2011 2010 2009 2008 2007 2006 2005 2004 2003 2002 2001 2000 Finland South Korea United States Netherlands UK 80 82 84 86 88 90 92 2006 entry cohort 2005 entry cohort DLRFingalStateSouth DublinDublin City Leaving Certificate Retention Rate % Source: Dept. of Education & Skills
- 22. Sustainability Report 2013 – Towards A Sustainable City Region 22 CLIMATE & ENERGY Climate-related actions and improvements in residential and commercial energy usage will not only make the city more environmentally friendly but will also improve competitive efficiency and allow for significant job and training opportunities. VISION: In the future, energy costs in the city will be minimised, the carbon footprint of the city will be reduced, while at the same time increasing human well-being. Energy efficiency and renewable energy generation will be increased and there will be a further reduction on the region’s dependence on non-renewable energy sources. CONTEXT & STRATEGIC GOALS: Dublin City Council, in association with its energy agency Codema, is committed to the EU 20-20-20 climate and energy targets for the year 2020. The City has adopted a suite of local policies and strategies with regard to energy and climate change. Outlined in the city’s ‘Climate Change Strategy’ (2008) and ‘Sustainable Energy Action Plan’ (SEAP; 2010), these policies are in line with the National Climate Change Strategy, the National Energy Efficiency Action Plan, and the National Renewable Energy Action Plan. Codema evaluates and monitors renewable energy levels and CO2 emissions for the region. The calculations are in eccordance with the Intergovernmental Panel on Climate Change and the methodology used has been approved by the Covenant of Mayors Office and the EU Joint Research Council. In the short term, residential and commercial buildings are identified as having the greatest opportunity for reducing carbon emissions, and account for more than half of the total CO2 in Dublin. It is estimated in the SEAP that extra insulation, boiler replacement and CFL light bulbs, when combined could mitigate about 10% of Dublin’s total emissions. While it is relatively inexpensive to include extra insulation and more energy efficient equipment at the design and construction stage of a building, it is much more costly to retrofit these measures into existing buildings. For this reason Dublin City Council has, through Variation 22 to the 2007 City Development Plan, specified high energy standards in all new residential and commercial building developments. ACHIEVEMENTS & FUTURE ACTIONS: Dublin City is currently on track to meet its 2020 target of 20% reduction in per capita CO2 emissions but further efforts will be required in the period 2015-2020. The City Council is leading by example through its commitment to reducing its own energy consumption by 33% by 2020. A number of long-term investments in infrastructure, towards meeting the long-term target of 80% reduction in greenhouse gas emissions by 2050, have already commenced under three headings: 1. Sustainable Transport: Extension of the LUAS; real-time public transport information at bus stops and on the web; extension of the cycleway network, especially the off-street cycle-ways, and expansion of the dublinbikes rental scheme. 2. Dublin District Heating Project: Market assessment completed in preparation for developing a business plan for district heating in Dublin. 3. Renewable Energy: The first ever inventory of locally-produced renewable energy sources in Dublin City and County has been carried out, along with public promotion of renewable energy use through the ‘Ace’ project. The total installed capacity of renewable energy in Dublin, based upon the survey, was 62 MW made up of biomass (including landfill gas), wind, solar and hydropower. The point of reference for Dublin City’s future plans on climate change is the UN Intergovernmental Panel on Climate Change, stipulating a reduction in emissions by 80% by the year 2050 in order to stabilize the Earth’s temperature. FURTHER READING Codema Renewable Energy Map Of Dublin Renewable Energy In Dublin Market Assessment – Codema (2013) Dublin City Sustainable Energy Action Plan Energy, Transport, Waste, Water, Air Dublin City Council Leading The Way In Sustainability The Minus 3% Project – Key Findings on Energy Efficiency for City Administrations
- 23. Sustainability Report 2013 – Towards A Sustainable City Region 23 CLIMATE & ENERGY INDICATORS Climate change and energy are central issues when considering sustainable development, where energy security and adaptation to local and global challenges are key priorities. Energy information in Ireland is available only recently at the national level through Sustainable Energy Authority of Ireland (SEAI) publications. ENERGY CONSUMPTION: Energy use per capita (kg of oil equivalent) has reduced year on year in Ireland from 2003 to 2011. Ireland is an average performer within the EU 27 (the 15th highest energy use per capita in 2010 (World Bank, 2012)). Energy use in Dublin City Council in terms of megawatts per hour per capita (MWh/Capita) reduced by approximately 18% from 2006-2011 (Codema, 2012). Dublin was ranked 18th out of 30 cities under the energy category in the Siemens Green City Index in 2009. 0 2500 5000 2012201120102009200820072006200520042003 Kg.ofoilequivalent Energy use per capita in Ireland Source: World Bank 2013 RENEWABLE ENERGY CONSUMPTION: The latest data shows that the contribution of Renewable energy as a percentage of Total Energy Consumption has increased to 6.7% in Ireland in 2011. Source: Eurostat 0 50 Sweden Latvia Finland Austria Estonia Portugal Denmark Romania Lithuania Slovenia Croatia Spain Bulgaria EU(27countries) Germany Greece France Italy Poland Slovakia CzechRepublic Hungary Ireland 6.7 13 46.8 Cyprus Netherlands Belgium UnitedKingdom Luxembourg Malta % Kg.ofoilequivalentpercapita Share of Renewable Energy in Gross Final Consumption 2011 GREENHOUSE GASES (GHG) EMISSIONS PER CAPITA: In terms of the Dublin Region, no data is currently available for this indicator. However, the estimated annual emissions per capita calculated for the Dublin City Council area was 5.6 tonnes of CO2 in 2011. Under the category of CO2 emissions in the Siemens Green City index, Dublin ranked in 19th of 30 EU capital cities (2009). The latest data indicates that emissions from greenhouse gases in Ireland in 2012 were 57.92 Mt CO2 eq. This represents an increase of 1% (0.58 Mt CO2 eq) on emissions in 2011 and reverses a trend of decreasing emissions since 2006 (EPA, 2013). 0 50 100 20122011201020092008200720062005200420032002200120001999199819971996199519941993199219911990 Kg.ofoilequivalent Total Greenhouse Gas Emissions in Ireland Source: EPA, 2013 MilliontonnesCO2 eq Source: Eurostat 0 50 Sweden Latvia Finland Austria Estonia Portugal Denmark Romania Lithuania Slovenia Croatia Spain Bulgaria EU(27countries) Germany Greece France Italy Poland Slovakia CzechRepublic Hungary Ireland 6.7 13 46.8Cyprus Netherlands Belgium UnitedKingdom Luxembourg Malta % Kg.ofoilequivalentpercapita Share of Renewable Energy in Gross Final Consumption 2011
- 24. Sustainability Report 2013 – Towards A Sustainable City Region 24 TRANSPORTATION The movement of people and goods is intimately linked to the prosperity and liveability of the region. The approach to movement in Dublin City reflects that of national and regional policy and is based on a strong emphasis on sustainable forms of transport, a proactive approach to influencing travel behaviour and effective traffic management, all underpinned by integrated land-use and transportation. VISION: In the future, the movement of people and goods within Dublin City will be by safe and sustainable means and predominantly by public transport, cycling, and walking. Transport and land use will be effectively integrated to ensure the most efficient use of land to minimise the need for travel. CONTEXT & STRATEGIC GOALS: As the capital city of Ireland, approximately 500,000 people move into, out of, and around Dublin City every day. There is approximately 1200km of road and 2400km of footpath within the city. The road network is constrained by the historic layout of the city and the natural barriers of the River Liffey and the Grand and Royal canals along which there are limited crossing points. The public transport network comprises bus, mainline rail, Luas (tram) and DART (electric rail) facilities. The city’s strategic cycle network continues to grow with an increasing emphasis on off road cycle routes. A Mobility Management Section has been established in the City Council and Mobility Management Plans are required of all developments of significant size in the city. Our strategic goals include reducing the modal split for private cars coming into the city centre to 20% by 2020, meaning that 80% of all trips will be by public transport, cycling and walking. The Council has the ambitious aim of increasing the modal split for cycling to 20–25% by 2020, exceeding the government’s 10% target in the ‘Smarter Travel Plan’. ACHIEVEMENTS & FUTURE ACTIONS: Dublin City Council, in partnership with the National Transport Authority (NTA), has committed €23 million to sustainable transport projects in 2013. This follows on from an expenditure of €20 million on sustainable transport projects in 2012. 2013 witnessed the beginning of the €35m expansion of the Dublinbikes network which integrated the scheme even further into the fabric of Dublin city, with 102 stations and 1,500 bikes planned by July 2014. Members have taken over six million journeys since the scheme transformed public transport in 2009. The NTA Draft Greater Dublin Area Cycle Network Plan was released for consultation in August of 2013. Helping to further promote sustainable transport options, Google Maps Transit is now live in Ireland as a result of a partnership between Google and the National Transport Authority. Car clubs and car sharing are also being rolled out across the city, and Hailo, a Taxi App, passed 125,000 downloads in Dublin only 6 months after launching. The implication of these services is that those who are carless in the city have a network of safe, economical options available to them. Hike It, Bike It, Like It Drimnagh!, a smarter travel project promoting sustainable travel in partnership with the Drimnagh community was short-listed for both the National Green Awards and the Excellence in Local Government Awards 2013. For the future, the city has a number of ambitious plans, including: the Metro North and Metro West Interconnector Development of Greater Dublin Area train service; the Eastern by-pass, which is a link between the southern end of the Dublin Port Tunnel and the M50 in the south of the city; the extension of the LUAS Network, involving among other enhancements, an essential interchange opportunity between the Green and Red lines and the Luas Cross City; Future Bus Rapid Transit Schemes; a 10km fuel line running from Dublin Port to Dublin Airport to reduce city fuel tanker transit; and the consideration of a system of cycle-dominated streets (e.g. 20 km/ hr speed). FURTHER READING Cycling Numbers Up As Commuters Take Variety Of Transport Options Gocar To Operate Capital’s First On- Street Car Club Dublin City Council Opens New Greenway Route In Tolka Valley Park To Mark Bike Week Intelligent Transport Congress In Dublin Offers Real Intelligent Transport Solutions For Europeans’ Needs Trinity To Host Euro Space Expo
- 25. Sustainability Report 2013 – Towards A Sustainable City Region 25 TRANSPORTATION INDICATORS Movement and Transport is a key issue within the Dublin Region and will have significant impacts on the sustainable development of the region in the future. MODAL SPLIT TO SCHOOL, WORK OR COLLEGE: Slight increase in overall levels of less sustainable travel patterns. Dublin ranked 30th out of 30 European Capital cities for Transportation (Siemens Green City Index). Increasing bicycle usage is apparent, particularly in the Dublin City Council area. PERCENTAGE OF THE POPULATION LIVING WITHIN 500 METERS WALK OF A QUALITY BUS CORRIDOR OR 1 KM WALK FROM A TRAIN/LUAS STOP: Accessing appropriate data sources for this indicator proved difficult and still requires further development and refinement. The All-Island Research Observatory mapping tools allow users to find approximate driving times to the closest railway station. Visit www.airo.ie/mapping-module to view and explore the mapping tool. MEAN TRAVEL TIME TO SCHOOL, WORK OR COLLEGE (RESIDENTS AGED 5+): Mean journey times to school and work have decreased in the Dublin Region with an overall improvement for trips less than 45 minutes since 2006. 0 5 10 15 20 25 30 35 2011 2006 Not stated1½ hours and over1 hour – <1½ hours¾ hour – <1 hour½ hour – <¾ hour¼ hour – <½ hourUnder ¼ hour Travel Times to School, Work, or College Residents of Dublin aged 5+ % Source: CSO, 2012 ROAD ACCIDENTS: Significant improvement, the data shows a substantial decrease in persons killed in the Dublin Region, from 49 in 2002 to a low of 11 in 2011. A total of 1607 persons were injured in road traffic accidents in Dublin in 2011 down from 2113 in 2002 (Road Safety Authority 2011). Source: RSA Road collision factbook 2011 Persons Killed in Roads Collisions Dublin NumberofPersons Source: RSA Road collision factbook 2011 Persons Injured in Roads Collisions Dublin NumberofPersons 0 75 2011201020092008200720062005200420032002 0 2,500 2011201020092008200720062005200420032002 % OF POPULATION LIVING AND WORKING IN THE DUBLIN REGION: This indicator looks at the proportion of those that live and work in the Dublin Region (CSO, 2012) using place of work and place of residence data from the Census (POWCAR, 2012). Of the total workers that live in Dublin City 84.4% work in the Dublin Region. Furthermore 76.4% of the total workforce that live in South Dublin work in the Dublin Region. These figures compare to 80.3% in Fingal and 80.9% in Dún Laoghaire-Rathdown. Between 2006 and 2011 there has been a reduction in these proportions (a drop of – 1.5% for Dublin City, – 2.8% in South Dublin City, – 1.6% in Fingal and – 1.3% in Dún Laoghaire-Rathdown). This reflects an increase in the share of the total workforce commuting from outside the Dublin Region. The continuation of this trend will have significant implications for the long-term urban development and sustainability of Dublin. 0 10 20 30 40 50 60 70 Dublin Region DúnLaoghaire -Rathdown Fingal SouthDublin DublinCity Modal Split 2011 % Car driver/Passenger On foot, Bicycle or Public Transportation Other/Not Stated Motorcycle or scooter Source: CSO, 2012
- 26. Sustainability Report 2013 – Towards A Sustainable City Region 26 INFRASTRUCTURE & LAND USE Dublin’s physical identity is defined by its pattern of streets and urban spaces, the River Liffey, the canals and Dublin Bay. Preserving and enhancing Dublin's distinct identity will ensure the city's continued success as a place that people desire to live, work, visit and exchange ideas. VISION: Creating good neighbourhoods and successful communities includes strengthening Dublin’s existing neighbourhoods and communities and fostering beneficial qualities in newly emerging areas. CONTEXT & STRATEGIC GOALS: As a heritage city, much of the inner city comprises protected structures. This puts certain constraints on infrastructure development and land-use change. The urban form is defined by a high-density centre of medieval origin based within a circular canal system surrounded by low-density 20th century suburban districts, where distribution of green space is highest. For example, the inner city and docklands contains 25% of the city’s population and over 15% of its land area, but provides only 5% of its public green spaces. Over the last two decades, rapid development of the city has put pressure on all city infrastructure, including green and blue spaces. Although Dublin City has a high level of green space, interconnectivity remains an ongoing issue. However, approximately 98% of all households in Dublin City live within 300 metres of an hourly (or more frequent) public transport service. The city recognises the value of green and blue spaces and is committed to their promotion. This is reflected in the City Development Plan, Biodiversity Action Plan, and so forth. There has been a recent resurgence of interest in community gardening and allotments and the city council is facilitating these where possible. New mixed-use, family-friendly neighbourhoods and communities have emerged in areas such as Ballymun, Pelletstown and North Fringe. Community facilities such as the Ballyfermot Leisure, Youth & Community Centre, The LAB in the inner city, and the Red Stables in St. Anne’s Park have helped in creation of community supports and amenities. Sustainable neighbourhoods require higher densities to make the facilities, services and transport connections efficient. The Development Plan recognizes this by prioritizing the provision of "quality homes in a compact city." Dublin City Council also follows and informs regional and national guidelines on best practice in urban planning. We are implementing policies to protect and enhance Dublin as a predominantly low-rise city, and continuing to develop a network of safe, clean, and attractive pedestrian routes and lanes in order to make the city easier to navigate. ACHIEVEMENTS & FUTURE ACTIONS: Dublin City is proud to have more green space per square kilometer than any other European capital city. There are thirty landmark parks within a 5km radius of the city centre. Dublin City Council has zoned 2,580 hectares as ‘recreational amenity and open space’. This represents 22% of the land area within the city boundary, and comprises land administered by local and central government. In 2012-2013, Dublin City Council prepared Green Infrastructure Strategies for all of its Local Area Plans. These included a joint approach with an adjoining local authority where there were transboundary developments proposed. In the years ahead, our challenge is to manage change within the canals sensitively and creatively, to cultivate the inner suburbs and provide neighbourhoods with a choice of homes, and to extend the form and structure of the city to new developing areas. In 2013, a project was begun by the Heritage Office to research and publish a guide to help owners of pre-1945 homes to make energy efficiency retrofits that are sympathetic to the heritage of the property. Look out for this ‘Built to Last’ publication in 2014. Another project looking at local level sustainability is the TURAS project, which looks at transitioning to urban resilience and sustainability. The project is run in partnership with UCD and has involved EU partners. FURTHER READING Docklands Regeneration looks to Sustainable Future DCC launches Grafton Street Improvement
- 27. Sustainability Report 2013 – Towards A Sustainable City Region 27 INFRASTRUCTURE & LAND USE INDICATORS Policies and actions within land use and spatial planning are key to the sustainable development of the Dublin Region and central to creating a high quality public domain. While important to measure, there are only a few recognised indicators that effectively capture this theme. This is an area that requires further development. VACANCY RATES: This indicator examines the number of vacant houses, flats and holiday homes as a percentage of the total housing stock in Dublin. In total the vacancy rate in the Dublin Region has reduced from 9.7% to 8.3% over a 5 year period (2006- 2011). The vacancy rate in Dublin is significantly lower than the state figure which stood at 14.5% in 2011. South Dublin has the lowest levels of vacancy at 5.4% compared to 10.2% in Dublin City. Nationally, the highest levels of vacancy were recorded in Leitrim at 30.5%. 0 3 6 9 12 15 2011 2006 StateDublin RegionSouth DublinFingalDun LaoghaireDublin City Vacancy Rates %oftotalhousingstock Source: CSO, 2012 PERCENTAGE OF INHABITANTS WITHIN 300 METRES OF BASIC SERVICES: This indicator was not developed further as the required data on proximity to local services in terms of distance is not readily available for the Dublin Region. Currently, maps published by the All-Island Research Observatory provide the best resource on accessibility. The accessibility mapping facility enables users to view estimated travel times by car to education facilities, airports and railway stations, healthcare services, emergency services and large grocery outlets. The comprehensive dataset behind this mapping tool was not available to the research team at the time of publication of this report. TIDY TOWN AWARDS: In the past half-century, hundreds of towns and villages throughout Ireland have participated in the national TidyTowns competition. Originally launched by Bord Fáilte as an initiative to encourage the fledgling tourism industry, the competition quickly became a rallying cause for communities throughout the country, determined to maintain and improve their local environment. While there is useful data available from the tidy town awards, it proved challenging to summarise in a consistent manner. The feasibility of this indictor will be further investigated. See the Tidy Towns 2013 report for more information on Dublin's performance. CATEGORY B MARK Sandymount 264 CATEGORY C MARK Chapelizod 280 CATEGORY D MARK Temple Bar 271 CATEGORY E MARK Raheny 274 Ballyfermot 247 CATEGORY F MARK Finglas 259 CATEGORY G MARK Ballymun 262
- 28. Sustainability Report 2013 – Towards A Sustainable City Region 28 BIODIVERSITY The Biodiversity Action Plan identifies the amazing wealth of wildlife and nature that exist in Dublin city. Given that birding is one of the most popular and most rapidly growing hobbies in the world, we can be proud that Dublin Bay is internationally recognised for its protected habitats and birds. VISION: We will sustainably manage city parks, open spaces and natural environments so that they contribute to the biodiversity, recreational and economic life of the city. CONTEXT & STRATEGIC GOALS: As a coastal city, built at the confluence of three rivers situated on a shallow bay and flanked by mountains, Dublin has a rich variety of habitats, with much of Dublin Bay having dual designations as Special Protection Areas (SPA) and Special Areas of Conservation (SAC). However, challenges arise from the legacy of industrialisation and land development in the city. Many of the natural areas in Dublin city occur over former landfills, infills, and quarries. Efforts are continually being made to remediate lands and to increase the number and interconnectedness of green and blue spaces. Implementation of the Dublin City Biodiversity Action Plan is ongoing since 2008. A constraint to the management of biodiversity has been that natural features, such as rivers and park lands, extend beyond the administrative boundaries that exist between the local government bodies. To ensure collaboration and a unity of purpose, the city’s Biodiversity Officer consistently liaises with adjoining authorities. ACHIEVEMENTS & FUTURE ACTIONS: Dublin City Council is undertaking projects to involve the general public more in the biodiversity recording process and to encourage monitoring on private lands. The data collected is being used by Parks staff to inform park management, prioritise resources, and assess project efficiency. In April of 2013, Dublin City Council hosted the EU LIFE+ project on river restoration in Dublin, with site visits to demonstrate non-chemical methods of invasive vegetation control, and the creation of salmon and trout spawning areas on the River Tolka. Dublin City Council is collaborating with Inland Fisheries Ireland, Queen’s University Belfast and local angling clubs in a genetic study of trout populations in all of the city’s major rivers to determine spawning areas and population sources for future management of fisheries stocks. Dublin’s biodiversity achievements received international attention when they were acknowledged by the International Union for Conservation of Nature as a best practice case study in its 2013 report, ‘Invasive Alien Species: the Urban Dimension.’ Dublin City is currently undertaking a UNESCO Biosphere Review and examining an enlargement of the Biosphere Reserve in cooperation with National Parks and Wildlife Service and UNESCO. The purpose of this exercise is to raise awareness, increase the potential of the Biosphere for nature conservation, and to promote ecotourism. Highlights of 2013 include: a salt marsh flora and fauna survey; a bumble bee populations survey in City Parks with Trinity College Dublin and the Office of Public Works; a Dublin Bay Birds study with Birdwatch Ireland, Dublin Port Company, and National Parks and Wildlife Service; a survey of protected orchids in Dublin City parks; a restoration of habitats of the River Naniken at St. Anne’s Park; and a Dublin City Swifts survey with Birdwatch Ireland, to assess remaining breeding populations and raise community awareness by direct involvement of recording birds through a citizen science project. In June 2013 a ‘Bioblitz’ event was organised for the community at North Bull Island and St. Anne’s Park in conjunction with the National Biodiversity Data Centre. The event attracted thousands of visitors and encouraged the recording of local flora and fauna species. In total, 237 species were recorded and there was a great uptake of guided walks. Dublin City Council plans to hold this event again in 2014. 2014 will also mark the inititation of a common lizard survey of North Bull Island, and the North Bull Island Management Plan review. FURTHER READING Dublin City Council Biodiversity Action Plan 2008-2012
- 29. Sustainability Report 2013 – Towards A Sustainable City Region 29 BIODIVERSITY INDICATORS Broadly speaking the City's biodiversity efforts are aimed at protecting and improving the natural environment. However, the collection of headline biodiversity and environmental protection indicators are challenging to source. PROPORTION OF WATERWAYS CLASSIFIED AS AT LEAST ‘GOOD’ STATUS AS PER EC REGULATIONS: There is a general trend of improving waters across the Eastern River Basin District with a large decrease in water bodies classified as poor or bad since 1998 (from 31.5% to 19% of the total). There are 497 water bodies in total, 365 rivers, 75 groundwater, 28 lakes, 13 transitional, 8 coastal and 8 artificial water bodies in the ERBD. There are still significant challenges, as some water bodies have slipped into the moderate category between 2004-06 and 2007-09 (EPA, 2010). 0 10 20 30 40 50 60 Bad Poor Moderate High/Good 2007-20092004-20062001-20031998-2000 Eastern River Basin District Water Quality Trends %ofsurveyedwaterbodies Source: EPA, Water Quality in Ireland 2001–2009 POPULATION TRENDS OF BIRDS: In total 150 species were recorded over the study period of 1998-2010 with 53 species recorded in 30 or more squares. Of these 53 species examined, 17 species showed increasing trends while 13 species declined, and 23 species remained relatively stable over the study period. For more information please see www.birdwatchireland.ie LOSS AND GAIN OF HEDGEROWS: Ireland has a rich hedgerow resource that is important for wildlife and needs to be managed in the interests of both farming and biodiversity. The legislation regarding the removal of hedgerows is currently under review. Hedges in place since or before 2009 have protection by being deemed landscape features for the purposes of Good Agricultural and Environment Condition, required for farm payments under the Single Farm Payment Scheme. Agri-environment schemes generally require protection and maintenance of hedgerows. In the past 2 years there has been considerable removal of scrub, due to land eligibility rules in the Single Farm Payment scheme. According to the National Forestry Inventory, hedgerows and scrub comprise 3.9% and 1.3% of the total land area respectively (Actions For Biodiversity 2011 – 2016, Ireland’s National Biodiversity Plan). Detailed information for the Dublin Region was a challenge to interpret. There have also been a number of studies between 2004 and 2011 including reports, guidelines and spatial biodiversity mapping to characterise the green infrastructure associated with the designated Strategic Greenway Network (SGN) in Dublin City. Further analysis is required to measure the loss and gain of hedgerows across the Dublin Region. In 2013, Ireland’s unique hedgerow network is receiving the recognition it deserves with the establishment of a National Hedgerow Database and a Hedgerow Appraisal System. Ireland’s intricate network of hedgerows, primarily comprised of native trees, shrubs and flowers, are a unique feature of our landscape and vital for safeguarding our environment (Heritage Council, 2013).
- 30. Sustainability Report 2013 – Towards A Sustainable City Region 30 RESOURCE MANAGEMENT Effectively managing resources and consumption levels is essential to ensuring the future competitiveness and sustainability of the region. Achieving greater efficiency in resource inputs and minimising waste also improves productivity and reduces costs. AIR VISION: By reducing the amount of private cars on city roads and promoting electric vehicles, we will reduce emissions and improve the region’s air quality. CONTEXT & STRATEGIC GOALS: Dublin ranks fourth overall in relation to air quality in the Siemen’s European Green City Index. The air quality has improved dramatically over the past two decades due to Dublin City Council’s legislation, an outright ban on coal, and the elimination of leaded petrol. Dublin City Council aims to continue to improve air quality and bring about positive behavioural change in support of a cleaner environment. ACHIEVEMENTS & FUTURE ACTIONS: Dublin City Council has assumed operational management of Dublin regional air quality monitoring since October 2012. An innovative approach to putting air quality data in the hands of citizens has been to make this data available through Dublin City Council’s open data platform, Dublinked. Dublin City Council, with partners in the Environmental Health Sciences Institute, is engaged in an EPA funded project on ‘The Contribution of Solid Fuel Use to Particulate and PAH Air Pollution in Ireland’. The final project report was submitted to the EPA in November 2013. Dublin was also chosen in 2012 as one of eight cities across the EU to participate in the Air Implementation Pilot Project under the auspices of the European Environment Agency. The aim is of this pilot project is to inform large- scale twinning action between urban areas. In the future, key actions will include assessing the ability of emission inventories at the local level to inform development of air quality management plans, modelling activities and other management practices. The European Enviroment Agency published their report on this project in May 2013. Waste VISION: Dublin City aims to have one of the most sustainable waste management systems in the world. Waste handling follows the EU waste hierarchy of prevention, reuse, recycling and disposal. The transportation of waste will be minimised, while goods and services will be designed to allow for the efficient recovery of materials. Organic material will be composted at, or close to, the point of generation. CONTEXT & STRATEGIC GOALS: The Dublin Waste Management Plan 2005-2010 aims to achieve 59% recycling, 25% incineration, and 16% landfill. Dublin City Council has recently commenced preparation of a new plan in line with the requirements of the Waste Framework Directive. The City Council is Lead Authority for a new Region (Eastern & Midlands) which covers 12 Local Authorities. Household waste generated in Dublin City is collected, treated and disposed of through an increasingly integrated system. Dublin City Council officially transferred its waste collection business to Greyhound Recycling and Recovery in January 2012. For recycling, householders have access to a kerbside green bin for mixed dry recyclables as well as a comprehensive network of recycling centres, community bring centres, and a glass bottle network. Waste Prevention and awareness plays an important role in implementing and achieving the objectives set out in the Dublin Waste Management Plan. ACHIEVEMENTS & FUTURE ACTIONS: The Dublin City Neighbourhoods Competition, organised by Dublin City Council, took place for the 9th consecutive year in 2013. The competition involved 5 areas within the City Council area that were rated on a number of local environmental aspects including waste management and recycling initiatives.
- 31. Sustainability Report 2013 – Towards A Sustainable City Region 31 The ‘An Taisce’ Green Schools Programme provides young children with education in responsible waste management. The Green Flag is given to schools that complete all of the essential elements of the Green Schools Programme. A short term objective that will have long term benefits for waste management in Dublin is the construction of the Waste to Energy Facility in the city. Waste to Energy has an important role to play in the long term management of residual waste. The proposed facility will be located on the Poolbeg Peninsula in Dublin and the site will cover an area of 5.5 hectares (13.6 acres). The facility will be able to handle 600,000 tonnes of municipal waste annually. The facility will produce energy to meet the needs of approximately 50,000 houses in the form of electricity supplied to the national grid. The facility will also have the capacity to provide district heating for up to 60,000 homes in the Poolbeg and adjacent areas of Dublin. WATER VISION: To ensure the continued collection, treatment, storage, and delivery of drinking water in sufficient quantity, at sufficient pressure and of a quality that meets all national and EU standards. CONTEXT & STRATEGIC GOALS: The availability of a long term, reliable, high quality, and economic supply of drinking water is a key requirement for the future development of any modern economy. Every day an average of 540 million litres of high quality drinking water is produced and supplied to 1.5 million customers in the Dublin Region. Dublin City Council’s Water Services Division has traditionally been responsible for supplying 70% of this water, with the balance provided by Fingal County Council. The average daily consumption for 2013 for the Dublin City Council Area was 217 million litres of drinking water per day. The per capita consumption of drinking water is 151 litres per person per day in Dublin City. ACHIEVEMENTS & FUTURE ACTIONS: Irish Water, a publicly owned national water authority, was established in 2013. AThe creation of a national water authority is expected to have many benefits. Most importantly, this new approach will facilitate increased investment into the system, resulting in better water services. Ancillary benefits include new jobs through upgrades to the water system, improved water conservation, enhanced water and wastewater quality standards, and a more cost-efficient water system that can deliver economies of scale. FURTHER READING Energy, Transport, Waste, Water, Air Dublin City Council leading the way in Sustainability Dublin City Council progresses with replacing another 19km of old and leaking water mains in Dublin City Dublin Waste to Energy Project RESOURCE MANAGEMENT
- 32. Sustainability Report 2013 – Towards A Sustainable City Region 32 RESOURCE MANAGEMENT INDICATORS Effectively managing resources and consumption levels is essential to ensuring the future sustainable development of the Dublin Region. HOUSEHOLD WASTE GENERATED PER INHABITANT: Reduction in the levels of household waste produced per capita in the Dublin Region and Ireland. According to Eurostat (2010), household waste per capita in Ireland is 387kg or 16% less than the EU 27 average of 438kg. Source: EPA, National Waste Reports 2006-2011 & CSO 2011 290 310 330 350 370 390 410 430 201120102009200820072006 Household Waste Per Capita KgperInhabitant DCC Dub RegionSDCCFCCDLR PERCENTAGE OF HOUSEHOLD WASTE RECYCLED: Trend of significant improvement in terms of household waste recycling rates within the Dublin Region. Recycling rates are higher in Dublin than the State average. Household Waste Recycling Rate 0 10 20 30 40 50 60 201020092008200720062003 Household Waste Recycling Rate % Source: DCC DCC Dub RegionSDCCFCCDLR DOMESTIC WATER CONSUMPTION: Average consumption levels have remained stable; Dublin ranked 19th of 30 EU capital cities in the water category of the Siemens Green City Index (2009). MEASURE OF PARTICULATE MATTER (PM10): In Dublin, traffic emissions are the main source of PM10. A decreasing trend is observed since 2003, which is most likely due to the decreases in particulate emissions from traffic due to improved vehicle engine emissions (EPA 2013). 140 141 142 143 144 145 146 147 148 149 2012 Jan-Oct 201120102009200820072006 Water Consumption Dublin Region Litres/Person/Day Source: DCC 0 10 20 30 40 201220112010200920082007200620052004200320022001 Dublin Region Monitoring stations Average number of days in exceedance of 50µg/m3 Days Source: EPA, 2013 Limit (35 days)