SlideShare una empresa de Scribd logo
1 de 26
Descargar para leer sin conexión
Rochester Area Community Foundation
Social Capital Survey Technical Report (March, 2007)1
Demographic Information
Number of participants: 2000 2006 2000 2006
Rochester 988 700 3003 2741 National
Participants by Gender: 2000 2006 2000 2006
Rochester National
Male 45.7% 47.6% 47.7% 48.3%
Female 54.3% 52.4% 52.3% 51.7%
Participants by Age: 2000 2006 2000 2006
Rochester National
20-34 18.7% 29.2% 20.1% 26.7%
35-54 44.1% 39.2% 42.3% 41.5%
55-64 14.6% 15.4% 15.4% 15.2%
65 and over 22.5% 16.2% 22.2% 16.6%
Participants by Education: 2000 2006 2000 2006
Rochester National
Less than grade 11 7.1% 9.8% 18.4% 17.2%
H.S. diploma/GED 30.7% 26.4% 24.3% 30.4%
Some college 25.1% 21.9% 19.6% 16.7%
Associates/technical 13.8% 16.6% 7.6% 9.2%
Bachelor’s 12.6% 12.5% 16.9% 14.5%
Some grad training 1.8% 2% 2.8% 1.5%
Grad/Professional 8.8% 10.7% 10.4% 10.5%
Race/Ethnicity: 2000 2006 2000 2006
Rochester National
Non-Hispanic White 83.9% 79.3% 73.3% 70.4%
African-American/Black 8.9% 11.2% 11.9% 9.7%
Latino 2.7% 7.1% 9.6% 14.2%
Other 4.6% 2.4% 5.2% 5.7%
Income: 2000 2006 2000 2006
Rochester National
$20K or less 19% 18% 16% 15.4%
$20K to 30K 18% 18% 17% 16.2%
$30K to 50K 26% 25% 26% 26%
$50K to 75K 20% 19% 20% 20%
$75K to 100K 9.8% 8.5% 9.2% 9.6%
Over $100K 7.5% 11.1% 11% 12%
1
Please see Analytic Narrative at end of report for details on study methodology and statistical analysis. Bold
type indicates statistically significant findings, while italicized type indicates strong, but not statistically
significant, trends. Because the absolute number of Latino participants in Rochester was low, analyses
involving this group should be considered tentative.
1
Rochester Area Community Foundation
Trust Analyses
Q: Generally speaking, would you say that most people can be trusted or that you can’t
be too careful in dealing with people?
2000 2006 2000 2006
Rochester National
Most people can be trusted 52% 41.4% 47.1% 43.9%
You can’t be too careful 42.5% 52.3% 45.9% 52.3%
It depends 5.5% 6.3% 6.9% 3.8%
Both Rochester and the nation suffered significant declines in overall trust between 2000
and 2006.
Q: How much can you trust the people in your neighborhood?
2000 2006 2000 2006
Rochester National
Trust them a lot 53.2% 48.1% 48.8% 45.9%
Trust them some 33.8% 31% 33.6% 34.8%
Trust them only a little 9.4% 15.5% 11.3% 13.6%
Trust them not at all 3.6% 5.5% 6.3% 5.7%
Again, both Rochester and the nation experienced significant drops in neighborhood
trust. Analyses indicated that the decrease in neighborhood trust was significantly greater in
Rochester than in the nation as a whole.
Q: How much can you trust the people you work with?
2000 2006 2000 2006
Rochester National
Trust them a lot 52.9% 47.7% 52.7% 49.7%
Trust them some 34.5% 36.5% 31.3% 32.5%
Trust them only a little 8.9% 12.7% 11.4% 12%
Trust them not at all 3.8% 3.1% 4.6% 5.8%
Again, both Rochester and the nation experienced significant declines in trust of co-
workers. Again, the decline in Rochester was significantly greater than the decline in the
national sample.
2
Rochester Area Community Foundation
Q: How much can you trust the people who work in the stores where you shop?
2000 2006 2000 2006
Rochester National
Trust them a lot 31.8% 27.9% 29.2% 29.7%
Trust them some 49.5% 51.1% 46.7% 48.5%
Trust them only a little 13.8% 17.2% 16.9% 16.5%
Trust them not at all 5% 3.7% 7.2% 5.3%
Rochester suffered a significant, albeit small decrease in trust in this area, while the
nation held predominately steady.
Q: How much do you trust the police in your local community?
2000 2006 2000 2006
Rochester National
Trust them a lot 55.6% 57% 50.6% 54.5%
Trust them some 31.5% 29.5% 31.8% 28.5%
Trust them only a little 8.6% 9.1% 10.8% 10%
Trust them not at all 4.3% 4.5% 6.8% 7%
Rochesterians have tended to trust the police slightly but significantly more than the
nation across time.
Analyses of Inter-racial Trust
Q: How much do you trust white people?
2000 2006 2000 2006
Rochester National
Trust them a lot 34.5% 31.5% 31.4% 32.5%
Trust them some 57.6% 59.3% 55.8% 54.9%
Trust them only a little 5.8% 7% 11% 9.5%
Trust them not at all 2% 2.3% 1.8% 3.1%
In Rochester, there was a significant, albeit small decrease in trust for white people,
while the reverse trend was apparent in the national sample.
3
Rochester Area Community Foundation
Q: How much do you trust African-Americans?
2000 2006 2000 2006
Rochester National
Trust them a lot 28.6% 25.6% 25.9% 27.1%
Trust them some 61.3% 62.8% 58.3% 56.9%
Trust them only a little 7.3% 10.2% 12.1% 10.9%
Trust them not at all 2.8% 1.4% 3.7% 5/2%
Despite small changes, Rochesterians remain significantly more trusting of African-
Americans, when compared to the nation.
Q: How much do you trust Asian people?
2000 2006 2000 2006
Rochester National
Trust them a lot 29.5% 26.2% 25.4% 28.5%
Trust them some 60.3% 61.8% 57.5% 55.7%
Trust them only a little 7.7% 10.2% 12.9% 11.6%
Trust them not at all 2.6% 1.8% 4.2% 4.2%
Despite small changes, Rochesterians remain significantly more trusting of Asian-
Americans when compared to the nation.
Q: How much do you trust Latinos?
2000 2006 2000 2006
Rochester National
Trust them a lot 26.8% 23.6% 23.5% 28%
Trust them some 61.2% 64.3% 57.9% 55.2%
Trust them only a little 8.9% 10.5% 14.9% 13%
Trust them not at all 3.1% 1.5% 3.6% 3.7%
Rochester experienced a significant dip in trust for Latinos, while the nation experienced
a significant increase. However, overall, Rochesterians still appear more trusting.
4
Rochester Area Community Foundation
Tolerance Analyses
Q: Would you like to see spending to tighten border security increased or decreased?
(Asked only in 2006)
2006 2006
Rochester National
Decreased 23.4% 23.4%
Neither 6.9% 7.3%
Increased 69.6% 69.3%
In 2006, Rochesterians agreed strongly with the nation that border security should be
tightened, with approximately 70% endorsing increases in spending in this area.
Q: Would you like to see aid to Blacks increased or decreased?
(Asked only in 2006)
2006 2006
Rochester National
Decreased 29% 28.4%
Neither 17.4% 20.9%
Increased 53.6% 50.6%
No significant differences between Rochester and the nation emerged on this variable.
The variable is a proxy for racism, however, as there are no aid programs specific to African-
Americans. Thus, nearly 30% of those surveyed, both in Rochester and across the nation,
appear to believe there are such programs, and would like to see these non-existent programs
cut.
Q: Immigrants are getting too demanding in their push for equal rights.
2000 2006 2000 2006
Rochester National
Agree strongly 12.5% 17.8% 20.7% 30.8%
Agree somewhat 16.5% 21.9% 23.2% 23%
Neither/Depends 4.4% 4.5% 4.4% 3.6%
Disagree somewhat 35% 31.8% 27.9% 21.8%
Disagree strongly 31.5% 24% 23.9% 20.7%
Both Rochester and the nation evidenced significant declining support for immigrant
rights between 2000 and 2006. However, it is notable that overall, Rochesterians remain more
supportive of immigrant rights than the nation as a whole.
5
Rochester Area Community Foundation
Q: A book that most people disapprove of should be kept out of my public library.
2000 2006 2000 2006
Rochester National
Agree strongly 8.4% 10.8% 14% 17.4%
Agree somewhat 10% 10.9% 12.8% 10.3%
Neither/Depends 3.4% 3.6% 3.5% 2.5%
Disagree somewhat 23.2% 23.3% 20.9% 20.5%
Disagree strongly 55% 51.3% 48.7% 49.3%
Overall, 2006 proved a less tolerant year for both Rochester and the nation on this
question; however Rochester remains more tolerant of controversial books when compared to
the rest of the country.
Q: Do you think the number of immigrants to America nowadays should be increased a
lot, increased a little, remain the same as it is, reduced a little, or reduced a lot?
(Only administered in 2006)
2006 2006
Rochester National
Increased a lot 3.4% 3.9%
Increased a little 9.7% 9.5%
Remain the same 42% 36.4%
Reduced a little 21.5% 22.1%
Reduced a lot 17.9% 22.5%
Can’t choose 5.5% 5.5%
Overall, Rochester and the nation looked similar on this question, although there was a
trend in the national sample for reducing the number of immigrants “a lot.”
Q: Suppose a close friend or relative were marrying an Asian person. Would you very
much favor it happening, somewhat favor, neither favor nor oppose, somewhat
oppose, or very much oppose it happening?
2000 2006 2000 2006
Rochester National
Very much favor 31.7% 25.4% 28.7% 22.4%
Somewhat favor 12.2% 9.4% 13.3% 15%
Neither favor nor oppose 50.2% 54% 47.8% 49%
Somewhat oppose 4% 3.3% 5.6% 6.9%
Very much oppose 1.9% 7.9% 4.6% 5.9%
Both the nation and Rochester demonstrated significant decreases in tolerance on this
question between 2000 and 2006, and the decrease in Rochester was particularly significant.
6
Rochester Area Community Foundation
Q: Suppose a close friend or relative were marrying a Black person. Would you…
2000 2006 2000 2006
Rochester National
Very much favor 27.8% 26.2% 25.8% 22.2%
Somewhat favor 10.7% 9.6% 12.6% 12.5%
Neither favor nor oppose 47.3% 50.8% 42.6% 45.9%
Somewhat oppose 7.7% 5.2% 8.8% 9%
Very much oppose 6.5% 8.2% 10.2% 10.4%
Analyses indicated that overall, Rochesterians view marrying a Black person
significantly more favorably than the nation does.
Q: Suppose a close friend or relative were marrying a White person. Would you…
2000 2006 2000 2006
Rochester National
Very much favor 39.5% 39.7% 40.6% 36.6%
Somewhat favor 9.9% 9.7% 13.4% 13.3%
Neither favor nor oppose 46.9% 46.8% 42% 45.1%
Somewhat oppose 2.2% 1.9% 1.9% 2.6%
Very much oppose 1.6% 1.9% 2% 2.4%
There were no significant changes to this question between 2000 and 2006, and there
were also no significant differences between Rochester and the nation.
Q: Suppose a close friend or relative were marrying a Latino person. Would you…
2000 2006 2000 2006
Rochester National
Very much favor 30.1% 28% 26.8% 25.6%
Somewhat favor 13.3% 8.5% 17.9% 14.6%
Neither favor nor oppose 47.7% 52.6% 45.2% 47.3%
Somewhat oppose 4.9% 4.8% 5.4% 6.6%
Very much oppose 4.1% 6.1% 4.7% 5.8%
There appeared to be a small but significant decrease between 2000 and 2006 in the
perception of favorability of marriage to Latino people across the nation.
Important to note about all 4 of these questions on inter-racial marriage –
Rochesterians appeared more neutral that the nation overall, with higher endorsements of the
“Neither favor nor oppose” option on each question, across both time periods.
7
Rochester Area Community Foundation
Q: Do you have a friend with a different religious orientation?
2000 2006 2000 2006
Rochester National
Yes 82.3% 80% 76.5% 78%
No 17.7% 20% 23.5% 22%
Analyses indicated that although the difference is small, Rochesterians do tend to have
more friends with different religious orientations than is seen nationally.
Q: Do you have a friend who is Latino?
2000 2006 2000 2006
Rochester National
Yes 46% 47.8% 49.4% 58.5%
No 54% 52.2% 50.6% 41.5%
Significantly more individuals in the national sample report having a Latino friend, and
this trend increased significantly in the national sample between 2000 and 2006.
Q: Do you have a friend who is African-American?
2000 2006 2000 2006
Rochester National
Yes 65.2% 66.9% 60.7% 62.6%
No 34.8% 33.1% 39.3% 37.4%
Rochesterians are significantly more likely to report having an African-American friend,
when compared to the national sample, and this finding is robust over time.
8
Rochester Area Community Foundation
Political Engagement
Q: How interested are you in politics and national affairs?
2000 2006 2000 2006
Rochester National
Very interested 11.6% 30.5% 13.2% 34.1%
Somewhat interested 21.3% 38.5% 20.8% 35.5%
Only slightly interested 40.1% 20.3% 36.1% 18.5%
Not at all interested 26.9% 10.7% 29.9% 11.9%
Analyses indicated strong increase in political interest between 2000 and 2006, with the
nation slightly but significantly more interested than Rochester.
Q: Are you currently registered to vote?
2000 2006 2000 2006
Rochester National
Yes 84.9% 85.8% 80.1% 80.8%
No 15.1% 14.2% 19.9% 19.2%
Rochesterarians were significantly more likely to be registered to vote in 2000 when
compared to the nation, and this trend continued in 2006.
Q: Did you vote in the 1996/2004 presidential election?
2000 2006 2000 2006
Rochester National
Yes 72.5% 79.4% 69.3% 73.9%
No 27.5% 20.6% 30.7% 26.1%
Reports of voting increased between 2000 and 2006 for both Rochester and the nation,
and Rochesterians remained significantly more likely to have voted when compared to the
nation.
Q: How much of the time do you think you can trust the national government to do
what is right?
2000 2006 2000 2006
Rochester National
Just about always 2.3% 2.9% 3.3% 5.2%
Most of the time 28% 30% 25.3% 25.6%
Only some of the time 54.7% 48.2% 52% 45.6%
Hardly ever 14.9% 19% 19.3% 19.6%
Overall, trends on this question appeared to remain relatively stable over time, despite
some movement within categories.
9
Rochester Area Community Foundation
Q: How much of the time do you think you can trust the local government to do what is
right?
2000 2006 2000 2006
Rochester National
Just about always 6.7% 6.4% 6% 5.9%
Most of the time 41.1% 41.9% 37.3% 40.3%
Only some of the time 43.3% 42.1% 45.7% 43.6%
Hardly ever 8.9% 9.7% 11% 10.1%
No significant differences emerged between 2000 and 2006, or between Rochester and
the nation.
Q: Have you signed a petition in the last 12 months?
2000 2006 2000 2006
Rochester National
Yes 40.8% 38.6% 35.1% 35.3%
No 59.2% 61.4% 64.9% 64.7%
Rochesterians remained significantly more likely to report having recently signed a
petition when compared to the nation.
Q: Have you attended a political meeting or rally in the last 12 months?
2000 2006 2000 2006
Rochester National
Yes 12% 21% 16.2% 17.8%
No 88% 79% 83.8% 82.2%
There was a significant increase in the country and in Rochester in participation in
political meetings and rallies between 2000 and 2006, and this increase was particularly notable
in Rochester.
Q: Have you participated in demonstrations, boycotts, or marches in the past 12
months?
2000 2006 2000 2006
Rochester National
Yes 4.3% 6.3% 7.1% 7.2%
No 95.7% 93.7% 92.9% 92.8%
Although there was a small, non-significant increase in demonstration participation in
Rochester in 2006, the nation still significantly participates in more demonstrations, boycotts,
and marches that do Rochesterians.
10
Rochester Area Community Foundation
Q: Do you participate in a political group?
2000 2006 2000 2006
Rochester National
Yes 7.7% 9.8% 9.1% 9.8%
No 92.3% 90.2% 90.9% 90.2%
Analyses indicated no significant change on this question between 2000 and 2006, nor a
significant difference between Rochester and the nation. Participation in political groups is
roughly equal and stable.
11
Rochester Area Community Foundation
Community Engagement
Q: Are you a member of a church or synagogue?
2000 2006 2000 2006
Rochester National
Yes 68.5% 62.1% 65.4% 62.7%
No 31.5% 37.9% 34.6% 37.3%
Membership in religious institutions was significantly lower in 2006 than it was in 2000.
Rochester and the nation did not differ from one another on this question.
Q: Do you participate in church activities other than attending services?
2000 2006 2000 2006
Rochester National
Yes 40.8% 44.5% 44.8% 45.2%
No 59.2% 55.5% 55.2% 54.8%
There were no changes on this question from 2000 to 2006, and no differences between
Rochester and the nation.
Q: Do you participate in an organization that is affiliated with religion?
2000 2006 2000 2006
Rochester National
Yes 11.9% 16.2% 16.2% 17.2%
No 88.1% 83.8% 83.8% 82.8%
Although there was an increase in participation in such groups in Rochester between
2000 and 2006, the nation remains significantly more likely to participate in groups like Knights
of Columbus, B’nai B’rith, or bible study groups.
Q: Do you participate in a sports club, league, or outdoor activity club?
2000 2006 2000 2006
Rochester National
Yes 23% 23.9% 20.5% 21.2%
No 77% 76.1% 79.5% 78.8%
There were no changes in participation in these groups between 2000 and 2006, nor
were there any significant differences between Rochester and the nation.
12
Rochester Area Community Foundation
Q: Do you participate in a youth organization?
2000 2006 2000 2006
Rochester National
Yes 22.4% 18.8% 22.3% 24.1%
No 77.6% 81.2% 77.7% 75.9%
There were no changes in participation in these groups between 2000 and 2006, nor
were there any significant differences between Rochester and the nation.
Q: Do you participate in a parent organization or other school support group?
2000 2006 2000 2006
Rochester National
Yes 17.4% 19.2% 22.3% 20.8%
No 82.6% 80.8% 77.7% 79.2%
Rochesterians are significantly less likely to report participation in a parent organization
or other school-affiliated group when compared to the national sample.
Q: Do you participate in a veterans group?
2000 2006 2000 2006
Rochester National
Yes 7.9% 13.2% 9.2% 10%
No 92.1% 86.8% 90.8% 90%
Participation in veterans groups showed a significant increase between 2000 and 2006.
Q: Do you participate in a neighborhood association?
2000 2006 2000 2006
Rochester National
Yes 15.4% 18.4% 20.4% 20.5%
No 84.6% 81.6% 79.6% 79.5%
Although more Rochesterians participated in neighborhood groups in 2006, this increase
was not statistically significant; the nation still has significantly higher participation in
neighborhood associations when compared to Rochester.
13
Rochester Area Community Foundation
Q: Do you participate in a seniors group?
2000 2006 2000 2006
Rochester National
Yes 13.3% 16% 14.3% 14.6%
No 86.7% 84% 85.7% 85.4%
There were no changes in participation in these groups between 2000 and 2006, nor
were there any significant differences between Rochester and the nation.
Q: Do you participate in a charity or social welfare organization?
2000 2006 2000 2006
Rochester National
Yes 29.7% 31.2% 31.9% 34%
No 70.3% 68.8% 68.1% 66%
Analyses indicated a significant increase in participation in such organizations between
2000 and 2006.
Q: Do you participate in a labor union?
2000 2006 2000 2006
Rochester National
Yes 10.1% 11.7% 11.6% 10.3%
No 89.9% 88.3% 88.4% 89.7%
There were no changes in participation in labor unions reported between 2000 and 2006,
nor were there any significant differences between Rochester and the nation.
Q: Do you participate in a professional, trade, farm, or business association?
2000 2006 2000 2006
Rochester National
Yes 22.4% 23.8% 24.9% 22.2%
No 77.6% 76.2% 75.1% 77.8%
There were no changes in participation in these groups between 2000 and 2006, nor
were there any significant differences between Rochester and the nation.
Q: Do you participate in a service or fraternal organization?
2000 2006 2000 2006
Rochester National
Yes 13.4% 12.4% 14.1% 13.9%
No 86.6% 87.6% 85.9% 86.1%
There were no changes in participation in these groups between 2000 and 2006, nor
were there any significant differences between Rochester and the nation.
14
Rochester Area Community Foundation
Q: Do you participate in an ethnic, nationality, civil rights organization?
2000 2006 2000 2006
Rochester National
Yes 4.4% 5.4% 6.5% 5.9%
No 95.6% 94.6% 93.5% 94.1%
Participants in the national sample reported significantly higher participation in such
groups when compared to Rochesterians.
Q: Do you participate in a literary, art, or musical group?
2000 2006 2000 2006
Rochester National
Yes 17% 20.7% 17.4% 19.4%
No 83% 79.3% 82.6% 80.6%
Across the country, including Rochester, participation in arts and cultural groups
increased significantly between 2000 and 2006.
Q: Do you participate in a hobby, investment, or garden club?
2000 2006 2000 2006
Rochester National
Yes 26.7% 29.1% 24.7% 23.8%
No 73.3% 70.9% 75.3% 76.2%
Rochesterians are significantly more likely to report participating in a hobby,
investment, or garden club, when compared to the nation.
Q: Do you participate in a self-help program?
2000 2006 2000 2006
Rochester National
Yes 18.8% 20% 17% 20.3%
No 81.2% 80% 83% 79.7%
Across the nation, more individuals report participating in self-help programs in 2006
than did in 2000.
15
Rochester Area Community Foundation
Q: Did any of the groups that you were involved with take any local action for social or
political reform in the past 12 months?
2000 2006 2000 2006
Rochester National
Yes 16.9% 22.8% 17.5% 20.1%
No 83.1% 77.2% 82.5% 79.9%
Nationwide, significantly more people reported taking local social or political action for
reform as part of a group in 2006.
Q: In the past 12 months, have you served as an officer or served on a committee of any
local club or organization?
2000 2006 2000 2006
Rochester National
Yes 18.6% 22.4% 17.9% 17.6%
No 81.4% 77.6% 82.1% 82.4%
Significantly more Rochesterians reported taking a leadership role in a local committee,
club, or organization during the last year when compared to the nation.
Q: In the last 12 months, how many times have you volunteered?
2000 2006 2000 2006
Rochester National
Zero times 47.4% 35.2% 45.3% 41.1%
1-4 times 16.1% 19.5% 17.8% 20%
5-11 times 14.5% 14.1% 14.8% 16%
12-23 times 8.2% 13.1% 8.3% 8.7%
24 or more times 13.9% 18% 13.9% 14.2%
There was a significant decrease nationwide in the number of people reporting
volunteering “zero times” during the past 12 months, and this decrease was notable in
Rochester. This indicates that the nation is volunteering more, and this trend is clearly marked
in Rochester.
16
Rochester Area Community Foundation
Q: During the past 12 months, approximately how much money did you and the other
members of your household contribute to non-religious charities?
2000 2006 2000 2006
Rochester National
None 28.1% 25.6% 35.6% 33.4%
Less than $100 21.8% 20.8% 20.6% 18.3%
$100 to less than $500 31.1% 27.7% 25.8% 28.5%
$500 to less than $1000 9.7% 12.6% 9% 9%
$1000 to less than $5000 8.6% 12.2% 7.3% 9.5%
More than $5000 0.8% 1% 1.6% 1.4%
Analyses indicated that Rochesterians gave significantly more to non-religious charities
overall.
Q: During the past 12 months, approximately how much money did you and the other
members of your household contribute to all religious causes, including your
congregation?
2000 2006 2000 2006
Rochester National
None 32.7% 37.8% 29.6% 30.1%
Less than $100 12.8% 14.2% 13.1% 12.8%
$100 to less than $500 28% 19.4% 23.3% 22.5%
$500 to less than $1000 9.7% 9.8% 10.5% 11.1%
$1000 to less than $5000 14.1% 15.3% 18.7% 17.7%
More than $5000 2.6% 3.5% 4.9% 5.7%
Analyses indicated that, for Rochester only, there was a significant increase in the
percentage of people reporting no giving to religious causes. However, Rochesterians gave
significantly more than the nation in the “less than $100” range. 2006 was a significantly less
giving year in the “$100 to less than $500” range across the nation.
17
Rochester Area Community Foundation
Cultural differences: Trust
Q: Generally speaking, would you say that most people can be trusted or that you can’t
be too careful in dealing with people?
2000 2006 2000 2006
Rochester National
Most people can be trusted
African-American 26.4% 17.5% 27.2% 28.2%
Latino 24.3% 35.5% 23.2% 25.7%
You can’t be too careful
African-American 70.4% 80.6% 65.2% 67.7%
Latino 66.6% 60.9% 67.4% 71%
Across the nation, there was a significant increase in trust on the part of the Latino
population. There was a notable trend towards a decrease in trust on the part of African-
Americans, and this trend was particularly notable in Rochester.
Q: How much can you trust the people who work in the stores where you shop?
2000 2006 2000 2006
Rochester National
Trust them a lot
African-Americans 10.2% 22.4% 16.1% 18.7%
Latinos 12.6% 12.2% 13.9% 12.9%
Trust them some
African-Americans 52.8% 39.0% 43.9% 46.2%
Latinos 40.4% 36% 37.5% 46.7%
Trust them only a little
African-Americans 25.1% 23.7% 25.3% 28.3%
Latinos 31% 45.4% 30.8% 28.4%
Trust them not at all
African-Americans 11.9% 14.9% 14.8% 6.8%
Latinos 16% 6.4% 17.9% 12%
Across the nation, more African-Americans are expressing trust in local merchants.
18
Rochester Area Community Foundation
Q: How much can you trust the police in your local community?
2000 2006 2000 2006
Rochester National
Trust them a lot
African-Americans 16.2% 28.9% 27.3% 30.9%
Latinos 32.3% 32.9% 38% 44.9%
Trust them some
African-Americans 44.6% 46.1% 38.4% 37.5%
Latinos 35.6% 26.2% 31.3% 27.2%
Trust them only a little
African-Americans 25.6% 13.4% 20.4% 19%
Latinos 21.9% 37.6% 19% 21.3%
Trust them not at all
African-Americans 13.6% 11.6% 13.8% 12.7%
Latinos 10.2% 3.3% 11.7% 6.6%
Nationally, Latinos were significantly more trusting of their local police in 2006.
There was evidence of a notable trend towards increased trust on the part of African-Americans
as well, although this trend did not reach the level of statistical significance.
Cultural differences: Political Engagement
Q: Are you currently registered to vote?
2000 2006 2000 2006
Rochester National
Yes
African-Americans 77.9% 76.9% 81% 86.9%
Latinos 64.6% 53.7% 47.9% 43.7%
No
African-Americans 22.1% 23.1% 19% 13.1%
Latinos 35.4% 46.3% 52.1% 56.3%
Despite an overall drop in voter registration among Latinos, Latinos in Rochester
remain significantly more likely to be registered voters when compared to Latinos nationally.
19
Rochester Area Community Foundation
Q: Have you signed a petition in the last 12 months?
2000 2006 2000 2006
Rochester National
Yes
African-Americans 36.3% 27.2% 21.1% 27.2%
Latinos 29.5% 25.7% 18.9% 17%
No
African-Americans 63.7% 72.8% 78.9% 72.8%
Latinos 70.5% 74.3% 81.1% 83%
In Rochester, there was a significant decrease in the number of African-Americans
reporting signing a petition, while these numbers increased significantly in the national sample.
The overall effect was to bring African-Americans in Rochester and the nation to similar levels
on this question. There was a notable trend for decreased petition signing by Latinos in
Rochester, while the reverse was true nationally. However, Latinos in Rochester remained
notably more likely to have signed a petition in the last 12 months.
Cultural differences: Community Engagement
Q: Have you worked on a community project in the last 12 months?
2000 2006 2000 2006
Rochester National
Yes
African-Americans 29.8% 39.6% 32.8% 32%
Latinos 30.5% 24.2% 26.2% 17.6%
No
African-Americans 70.2% 60.4% 67.2% 68%
Latinos 69.5% 75.8% 73.8% 82.4%
Nationally, there was a significant decline in the number of Latinos reporting having
worked on a community project. In Rochester, there was a notable trend towards increased
work on community projects by African-Americans.
20
Rochester Area Community Foundation
Q: Are you a member of a church/synagogue?
2000 2006 2000 2006
Rochester National
Yes
African-Americans 63.4% 77.4% 70.8% 67.6%
Latinos 62.7% 54% 46.2% 46.2%
No
African-Americans 36.6% 22.6% 29.2% 32.4%
Latinos 37.3% 46% 53.8% 53.8%
Between 2000 and 2006, there were significant changes in African-American
church/synagogue membership, but these changes were the opposite for Rochester and the
nation. In Rochester, significantly more African-Americans reported membership, while a
significant decrease was seen nationally. In Rochester, there was a notable trend for decreased
church/synagogue membership on the part of Latinos, although their membership rates
remained higher than those seen in the national sample.
Q: Do you participate in church activities other than attending services?
2000 2006 2000 2006
Rochester National
Yes
African-Americans 53.4% 49.8% 51.9% 45.3%
Latinos 45.4% 39.9% 33.5% 38.1%
No
African-Americans 46.6% 50.2% 51.9% 45.3%
Latinos 54.6% 60.1% 66.5% 61.9%
Across the nation, significantly fewer African-Americans were participating in church
activities in 2006. There was also a notable trend for decreased participation by Latinos in
Rochester, while there was a slight increase in participation by Latinos in the national sample.
21
Rochester Area Community Foundation
Q: Do you participate in a parent association or other school support group?
2000 2006 2000 2006
Rochester National
Yes
African-Americans 25.7% 17.6% 31.2% 28%
Latinos 34.8% 42% 17.3% 18.5%
No
African-Americans 74.3% 82.4% 68.8% 72%
Latinos 65.2% 58% 82.7% 81.5%
Nationally, significantly fewer African-Americans reported belonging to such groups,
and this was notably pronounced in Rochester, which could produce challenges for emerging
school initiatives in our area.
Latino Rochesterians, however, continued to show significantly higher involvement in
school groups when compared to their counterparts nationally. Further investigations of these
differences could produce important avenues for local school initiatives.
Q: Do you participate in a neighborhood association?
2000 2006 2000 2006
Rochester National
Yes
African-Americans 20.7% 23.1% 24.6% 28.3%
Latinos 18.8% 31.7% 13.6% 13.2%
No
African-Americans 79.3% 76.9% 75.4% 71.7%
Latinos 81.2% 68.3% 86.4% 86.8%
Latino Rochesterians were significantly and dramatically more likely than their national
counterparts to participate in neighborhood associations.
Q: Do you participate in charity or social welfare organizations?
2000 2006 2000 2006
Rochester National
Yes
African-Americans 29.3% 42.8% 29.6% 39.7%
Latinos 27% 38% 21.1% 25.4%
No
African-Americans 70.7% 57.2% 70.4% 60.3%
Latinos 73% 62% 78.9% 74.6%
Across the nation, African-Americans were significantly more likely to report
participating in social welfare and charity organizations in 2006. There was a notable trend for
increased participation in such organizations on the part of Latinos, and the trend was
particularly pronounced in Rochester.
22
Rochester Area Community Foundation
Q: Do you participate in a professional, trade, farm or business association?
2000 2006 2000 2006
Rochester National
Yes
African-Americans 13.3% 23.5% 17.9% 18.6%
Latinos 18.2% 29.3% 12% 7.8%
No
African-Americans 86.7% 76.5% 82.1% 81.4%
Latinos 81.8% 70.7% 88% 92.2%
There was a dramatic and significant increase in participation in these groups among
Latinos in Rochester, while there was a significant decline in participation for Latinos in the
national sample. There was also a notable trend for increased participation in these groups by
African-Americans, but only in Rochester.
Q: Do you participate in an ethnic, nationality, or civil rights organization?
2000 2006 2000 2006
Rochester National
Yes
African-Americans 9.4% 20.9% 17.3% 20%
Latinos 8.3% 6.5% 6.3% 7.9%
No
African-Americans 90.6% 79.1% 82.7% 80%
Latinos 91.7% 93.5% 93.7% 92.1%
Nationally, significantly more African-Americans were participating in such
organizations in 2006; between 2000 and 2006, the increase seen among African-Americans in
Rochester was dramatic and brought the Rochester community in line with national numbers.
Q: Do you belong to any group that has taken local action for reform?
2000 2006 2000 2006
Rochester National
Yes
African-Americans 17.2% 20.3% 14.6% 24.7%
Latinos 20.7% 19.5% 11.5% 10.7%
No
African-Americans 82.8% 79.7% 85.4% 75.3%
Latinos 79.3% 80.5% 88.5% 89.3%
Nationally, significantly more African-Americans were taking part in efforts seeking
local reforms in 2006. There was also a notable trend for Latinos in Rochester to be more
involved in such efforts than their national counterparts.
23
Rochester Area Community Foundation
Q: Have you served as an officer or on a committee?
2000 2006 2000 2006
Rochester National
Yes
African-Americans 10.4% 19.2% 15% 19.4%
Latinos 15.6% 17.8% 11.4% 9.4%
No
African-Americans 89.6% 80.8% 85% 80.6%
Latinos 84.4% 82.2% 88.6% 90.6%
There was a significant national increase in service by African-Americans; the increase
in Rochester was notable, and brought our community in line with national trends.
24
Rochester Area Community Foundation
Analytic Narrative
In 2000, thirty-nine communities participated in The Social Capital Benchmark Survey, designed
by Professor Robert Putnam, of Harvard University, which sought to measure key elements of
“social capital,” including civic engagement, trust in others, levels of social activity, and
tolerance for cultural differences. This original benchmarking survey was administered by
telephone using random digit dialing techniques. In addition to the discrete community samples
that were polled, information from a nationally representative sample was also collected. At the
time, this was the largest-ever survey of civic engagement performed in the United States.
In Rochester, the Rochester Area Community Foundation polled 988 residents living in the
Greater Rochester region, including those in Monroe, Wayne, Ontario, Livingston, Genesee and
Orleans counties. This sample included a purposive oversampling of African-American and
Latino residents. This oversampling was done in order to best represent the views of these
groups.
In 2006, 21 different communities agreed to participate in a follow-up survey to the original
benchmarking survey. The Rochester Area Community Foundation, feeling that follow-up data
could be extremely helpful to many interested parties in our community, decided to participate in
this follow-up. 700 residents of the same 6 counties were again polled by phone. The actual
survey used in 2006 did differ slightly from the original benchmarking survey. Certain questions
from the previous survey were dropped by Harvard, while others were added. The majority of
questions, however, remained the same. Again in 2006, Rochester chose to add a purposive
oversampling of African-American and Latinos in the Greater Rochester area. And again,
Harvard University collected data from a nationally representative sample to complement the
data collected by participating communities.
The data discussed in this Technical Report were derived from the combination of 4 discrete data
files: data from Rochester in 2000, data from Rochester in 2006, data from the nationally
representative sample in 2000, and data from the nationally representative sample in 2006. All
these data were merged so that the impact of time, sample (Rochester vs. National) and the
interaction of time with sample, could be studied. In approaching this analysis, the Rochester
Area Community Foundation sought analytic advice from our lead analytic volunteer consultant,
Dr. Steven M. LaLonde, of the John D. Hromi Center for Quality and Applied Statistics at the
Rochester Institute of Technology. We are extremely grateful to Dr. Lalonde for first suggesting
useful analytic strategies, and then reviewing the first set of analyses produced for accuracy and
appropriateness. Nominal regression, including Binomial and Multinomial subtypes, was chosen
as the best possible analytic strategy. These analyses are most appropriate when trying to
understand the role of multiple factors (like time and place) on survey questions that are made up
of discrete response categories. The statistical package SPSS 15.1 was utilized for all analyses,
as recommended by Harvard University.
All analyses conducted here, with the exception of those examining cultural differences (to be
discussed below), were conducted using representativeness weights assigned by Harvard. These
weights were assigned to each individual respondent in an effort to make the sample resemble as
closely as possible the residents of the Greater Rochester area and the nation (in the case of the
national sample). Representativeness was determined by an analytic process using Census data
as its base. This weighting was particularly necessary for Rochester, as we chose to purposely
oversample members of certain cultural groups. The weighting variable took this into account,
25
Rochester Area Community Foundation
and produced analyses that brought the percentages of members of the various groups surveyed
into line with the most recent Census data available for the Greater Rochester area.
The weighting variable was removed for analyses of cultural differences, so that the purposive
oversample, which increased beyond representativeness the numbers of ethnic minority
individuals, could be utilized to best portray the views of individuals from these communities.
Despite doing this, it is very important to note that the absolute number of Latino respondents
remained small; therefore it is essential to consider all analyses on the Latino population as
tentative at this time.
In this report, all statistically significant findings are shown in bold typeface, while findings that
verged on statistical significance and therefore also deserved attention are represented in italics.
Not all analyses conducted are represented in this report, for several reasons. First, to do so
would make this report extraordinarily lengthy, as the survey contained over 60 questions, and
took an average of 20-30 minutes to administer to each participant. Second, many of the
analyses did not produce any helpful information – in some case, there was no change from 2000
to 2006, nor any differences between Rochester and the nation. In other cases, the questions did
not appear to “read well” with respondents, and data emerging from analyses on these questions
was difficult to interpret. Finally, we made a selection of those analyses we thought would be
most helpful to community stakeholders. However, we can make additional analyses available
to interested parties upon request. We do plan to continue our work with this data, and should
additional important findings emerge, we will certainly report these to the community.
Questions on the data analytic strategy should be directed to Dr. Mark A. Biernbaum, Senior
Program Officer, Rochester Area Community Foundation.
26

Más contenido relacionado

La actualidad más candente

November 2021 Public Health Snapshot
November 2021 Public Health SnapshotNovember 2021 Public Health Snapshot
November 2021 Public Health Snapshotlaylabellows
 
2021 Proof Strategies CanTrust Index: Trust and the Pandemic - May Update
2021 Proof Strategies CanTrust Index: Trust and the Pandemic - May Update2021 Proof Strategies CanTrust Index: Trust and the Pandemic - May Update
2021 Proof Strategies CanTrust Index: Trust and the Pandemic - May UpdateProof
 
Live Attendance Report: US 2012
Live Attendance Report: US 2012Live Attendance Report: US 2012
Live Attendance Report: US 2012LiveAnalytics
 
The Civil Beat Poll Dec. 2017 — Statewide Lottery:
The Civil Beat Poll Dec. 2017 — Statewide Lottery:The Civil Beat Poll Dec. 2017 — Statewide Lottery:
The Civil Beat Poll Dec. 2017 — Statewide Lottery:Honolulu Civil Beat
 
Role Model
Role ModelRole Model
Role ModelAVICENNE
 
Proof Strategies CanTrust Index 2022
Proof Strategies CanTrust Index 2022Proof Strategies CanTrust Index 2022
Proof Strategies CanTrust Index 2022Proof
 

La actualidad más candente (6)

November 2021 Public Health Snapshot
November 2021 Public Health SnapshotNovember 2021 Public Health Snapshot
November 2021 Public Health Snapshot
 
2021 Proof Strategies CanTrust Index: Trust and the Pandemic - May Update
2021 Proof Strategies CanTrust Index: Trust and the Pandemic - May Update2021 Proof Strategies CanTrust Index: Trust and the Pandemic - May Update
2021 Proof Strategies CanTrust Index: Trust and the Pandemic - May Update
 
Live Attendance Report: US 2012
Live Attendance Report: US 2012Live Attendance Report: US 2012
Live Attendance Report: US 2012
 
The Civil Beat Poll Dec. 2017 — Statewide Lottery:
The Civil Beat Poll Dec. 2017 — Statewide Lottery:The Civil Beat Poll Dec. 2017 — Statewide Lottery:
The Civil Beat Poll Dec. 2017 — Statewide Lottery:
 
Role Model
Role ModelRole Model
Role Model
 
Proof Strategies CanTrust Index 2022
Proof Strategies CanTrust Index 2022Proof Strategies CanTrust Index 2022
Proof Strategies CanTrust Index 2022
 

Destacado (17)

Presentación1
Presentación1Presentación1
Presentación1
 
REKTOR-REKTOR SEMINARI ST. YUDAS THADEUS-LANGGUR
REKTOR-REKTOR SEMINARI ST. YUDAS THADEUS-LANGGURREKTOR-REKTOR SEMINARI ST. YUDAS THADEUS-LANGGUR
REKTOR-REKTOR SEMINARI ST. YUDAS THADEUS-LANGGUR
 
Presentation1
Presentation1Presentation1
Presentation1
 
la tecnologia
la tecnologiala tecnologia
la tecnologia
 
Biglietto
BigliettoBiglietto
Biglietto
 
RAN
RANRAN
RAN
 
Plan lector lombricultura
Plan  lector   lombriculturaPlan  lector   lombricultura
Plan lector lombricultura
 
Image001 jpg
Image001 jpgImage001 jpg
Image001 jpg
 
Língua portuguesa
Língua portuguesa Língua portuguesa
Língua portuguesa
 
Módulo12 parte1 aula2
Módulo12  parte1 aula2Módulo12  parte1 aula2
Módulo12 parte1 aula2
 
Униформа для персонала Штрих Ру
Униформа для персонала Штрих РуУниформа для персонала Штрих Ру
Униформа для персонала Штрих Ру
 
Cuento El lobo
Cuento El loboCuento El lobo
Cuento El lobo
 
Números reales
Números realesNúmeros reales
Números reales
 
Factura socio afiliado neurs
Factura socio afiliado neursFactura socio afiliado neurs
Factura socio afiliado neurs
 
Workshop de Mídias Sociais - Como usá-las a favor de sua empresa
Workshop de Mídias Sociais - Como usá-las a favor de sua empresaWorkshop de Mídias Sociais - Como usá-las a favor de sua empresa
Workshop de Mídias Sociais - Como usá-las a favor de sua empresa
 
FAKHRI CV UBDATED
FAKHRI CV UBDATEDFAKHRI CV UBDATED
FAKHRI CV UBDATED
 
2015新春イベント!次世代教育テクノロジー はが弘明資料
2015新春イベント!次世代教育テクノロジー はが弘明資料2015新春イベント!次世代教育テクノロジー はが弘明資料
2015新春イベント!次世代教育テクノロジー はが弘明資料
 

Similar a RACFSC_Technical_Report

Washington Co., WI Demographics 2022
Washington Co., WI Demographics 2022Washington Co., WI Demographics 2022
Washington Co., WI Demographics 2022Paul Roback
 
BBC Global Survey: A world divided?
BBC Global Survey: A world divided?BBC Global Survey: A world divided?
BBC Global Survey: A world divided?Ipsos UK
 
Changing Demographics: The Meaning for Advertising and Marketing
Changing Demographics: The Meaning for Advertising and MarketingChanging Demographics: The Meaning for Advertising and Marketing
Changing Demographics: The Meaning for Advertising and MarketingAAF Northern Illinois
 
Bbc global survey the world divided April 18
Bbc global survey   the world divided April 18Bbc global survey   the world divided April 18
Bbc global survey the world divided April 18Robert Grimm Ph.D
 
Fundraising Today and Tomorrow and the Next Generation of Canadian Giving
Fundraising Today and Tomorrow and the Next Generation of Canadian GivingFundraising Today and Tomorrow and the Next Generation of Canadian Giving
Fundraising Today and Tomorrow and the Next Generation of Canadian Givinghjc
 
San Diego DMA Demographics
San Diego DMA DemographicsSan Diego DMA Demographics
San Diego DMA DemographicsKristen Carney
 
Trends and Disparities in Children's Health Insurance: New Data and the Impli...
Trends and Disparities in Children's Health Insurance: New Data and the Impli...Trends and Disparities in Children's Health Insurance: New Data and the Impli...
Trends and Disparities in Children's Health Insurance: New Data and the Impli...soder145
 
Public Support For Half Price Fares
Public Support For Half Price FaresPublic Support For Half Price Fares
Public Support For Half Price FaresJeffrey Jones
 
Next Generation of Fundraising Today and Tomorrow
Next Generation of Fundraising Today and TomorrowNext Generation of Fundraising Today and Tomorrow
Next Generation of Fundraising Today and Tomorrowhjc
 
The Latino Vote in Virginia by Dr. Xavier Medina Vidal
The Latino Vote in Virginia by Dr. Xavier Medina VidalThe Latino Vote in Virginia by Dr. Xavier Medina Vidal
The Latino Vote in Virginia by Dr. Xavier Medina Vidalholaedgar
 
Sample study area report 1.5 mi. radius, US census data, demographics, commer...
Sample study area report 1.5 mi. radius, US census data, demographics, commer...Sample study area report 1.5 mi. radius, US census data, demographics, commer...
Sample study area report 1.5 mi. radius, US census data, demographics, commer...dbpdata
 
December 2021 Metro Atlanta Speaks Regional Snapshot
December 2021 Metro Atlanta Speaks Regional SnapshotDecember 2021 Metro Atlanta Speaks Regional Snapshot
December 2021 Metro Atlanta Speaks Regional Snapshotlaylabellows
 
The Social Benefits Of Stable Housing
The Social Benefits Of Stable HousingThe Social Benefits Of Stable Housing
The Social Benefits Of Stable HousingTom Cryer
 
Patron Growth Initiative - PGI 3
Patron Growth Initiative - PGI 3Patron Growth Initiative - PGI 3
Patron Growth Initiative - PGI 3Kim Williams-Shuker
 
Progress Through People Luncheon Georgia's Evolving Demographics
Progress Through People Luncheon Georgia's Evolving DemographicsProgress Through People Luncheon Georgia's Evolving Demographics
Progress Through People Luncheon Georgia's Evolving DemographicsLCpublicrelations
 
2019 State of the Rockies Voter Survey
2019 State of the Rockies Voter Survey2019 State of the Rockies Voter Survey
2019 State of the Rockies Voter SurveyManuel Rendon
 
Make A Wish conference presentation on Next Generation of Giving
Make A Wish conference presentation on Next Generation of GivingMake A Wish conference presentation on Next Generation of Giving
Make A Wish conference presentation on Next Generation of Givingdennis mccarthy
 
NCHLP Tax Reform Poll Summary
NCHLP Tax Reform Poll SummaryNCHLP Tax Reform Poll Summary
NCHLP Tax Reform Poll Summaryccpnc
 

Similar a RACFSC_Technical_Report (20)

Washington Co., WI Demographics 2022
Washington Co., WI Demographics 2022Washington Co., WI Demographics 2022
Washington Co., WI Demographics 2022
 
BBC Global Survey: A world divided?
BBC Global Survey: A world divided?BBC Global Survey: A world divided?
BBC Global Survey: A world divided?
 
Changing Demographics: The Meaning for Advertising and Marketing
Changing Demographics: The Meaning for Advertising and MarketingChanging Demographics: The Meaning for Advertising and Marketing
Changing Demographics: The Meaning for Advertising and Marketing
 
Bbc global survey the world divided April 18
Bbc global survey   the world divided April 18Bbc global survey   the world divided April 18
Bbc global survey the world divided April 18
 
3.7 Rodney Harrell
3.7 Rodney Harrell3.7 Rodney Harrell
3.7 Rodney Harrell
 
Fundraising Today and Tomorrow and the Next Generation of Canadian Giving
Fundraising Today and Tomorrow and the Next Generation of Canadian GivingFundraising Today and Tomorrow and the Next Generation of Canadian Giving
Fundraising Today and Tomorrow and the Next Generation of Canadian Giving
 
San Diego DMA Demographics
San Diego DMA DemographicsSan Diego DMA Demographics
San Diego DMA Demographics
 
Trends and Disparities in Children's Health Insurance: New Data and the Impli...
Trends and Disparities in Children's Health Insurance: New Data and the Impli...Trends and Disparities in Children's Health Insurance: New Data and the Impli...
Trends and Disparities in Children's Health Insurance: New Data and the Impli...
 
Public Support For Half Price Fares
Public Support For Half Price FaresPublic Support For Half Price Fares
Public Support For Half Price Fares
 
Next Generation of Fundraising Today and Tomorrow
Next Generation of Fundraising Today and TomorrowNext Generation of Fundraising Today and Tomorrow
Next Generation of Fundraising Today and Tomorrow
 
The Latino Vote in Virginia by Dr. Xavier Medina Vidal
The Latino Vote in Virginia by Dr. Xavier Medina VidalThe Latino Vote in Virginia by Dr. Xavier Medina Vidal
The Latino Vote in Virginia by Dr. Xavier Medina Vidal
 
Bond multi 2014 la jolla, ca_apr 2014
Bond multi 2014 la jolla, ca_apr 2014Bond multi 2014 la jolla, ca_apr 2014
Bond multi 2014 la jolla, ca_apr 2014
 
Sample study area report 1.5 mi. radius, US census data, demographics, commer...
Sample study area report 1.5 mi. radius, US census data, demographics, commer...Sample study area report 1.5 mi. radius, US census data, demographics, commer...
Sample study area report 1.5 mi. radius, US census data, demographics, commer...
 
December 2021 Metro Atlanta Speaks Regional Snapshot
December 2021 Metro Atlanta Speaks Regional SnapshotDecember 2021 Metro Atlanta Speaks Regional Snapshot
December 2021 Metro Atlanta Speaks Regional Snapshot
 
The Social Benefits Of Stable Housing
The Social Benefits Of Stable HousingThe Social Benefits Of Stable Housing
The Social Benefits Of Stable Housing
 
Patron Growth Initiative - PGI 3
Patron Growth Initiative - PGI 3Patron Growth Initiative - PGI 3
Patron Growth Initiative - PGI 3
 
Progress Through People Luncheon Georgia's Evolving Demographics
Progress Through People Luncheon Georgia's Evolving DemographicsProgress Through People Luncheon Georgia's Evolving Demographics
Progress Through People Luncheon Georgia's Evolving Demographics
 
2019 State of the Rockies Voter Survey
2019 State of the Rockies Voter Survey2019 State of the Rockies Voter Survey
2019 State of the Rockies Voter Survey
 
Make A Wish conference presentation on Next Generation of Giving
Make A Wish conference presentation on Next Generation of GivingMake A Wish conference presentation on Next Generation of Giving
Make A Wish conference presentation on Next Generation of Giving
 
NCHLP Tax Reform Poll Summary
NCHLP Tax Reform Poll SummaryNCHLP Tax Reform Poll Summary
NCHLP Tax Reform Poll Summary
 

Más de Mark Nevelson Khan PhD (12)

RACFIntroduction to Evaluation
RACFIntroduction to EvaluationRACFIntroduction to Evaluation
RACFIntroduction to Evaluation
 
ETCEvaluation 3.41.39 AM.PDF
ETCEvaluation 3.41.39 AM.PDFETCEvaluation 3.41.39 AM.PDF
ETCEvaluation 3.41.39 AM.PDF
 
BiernbaumSummerSchoolL
BiernbaumSummerSchoolLBiernbaumSummerSchoolL
BiernbaumSummerSchoolL
 
ImplementPIttsMedicaidStudy.PDF
ImplementPIttsMedicaidStudy.PDFImplementPIttsMedicaidStudy.PDF
ImplementPIttsMedicaidStudy.PDF
 
HSPOSTbw.PPT
HSPOSTbw.PPTHSPOSTbw.PPT
HSPOSTbw.PPT
 
TooLittleTooLatePDF
TooLittleTooLatePDFTooLittleTooLatePDF
TooLittleTooLatePDF
 
NEADProposalRCSD
NEADProposalRCSDNEADProposalRCSD
NEADProposalRCSD
 
ICAFSmetis.PDF
ICAFSmetis.PDFICAFSmetis.PDF
ICAFSmetis.PDF
 
HIVneedsassess.PDF
HIVneedsassess.PDFHIVneedsassess.PDF
HIVneedsassess.PDF
 
gaypres
gaypresgaypres
gaypres
 
BiernbaumMulticultural
BiernbaumMulticulturalBiernbaumMulticultural
BiernbaumMulticultural
 
GivingOppJuly07
GivingOppJuly07GivingOppJuly07
GivingOppJuly07
 

RACFSC_Technical_Report

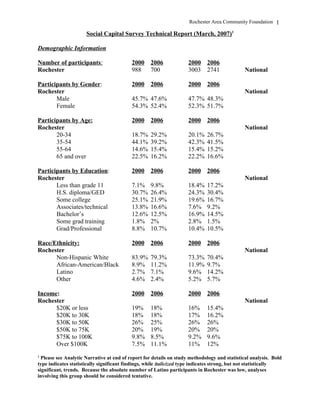
  • 1. Rochester Area Community Foundation Social Capital Survey Technical Report (March, 2007)1 Demographic Information Number of participants: 2000 2006 2000 2006 Rochester 988 700 3003 2741 National Participants by Gender: 2000 2006 2000 2006 Rochester National Male 45.7% 47.6% 47.7% 48.3% Female 54.3% 52.4% 52.3% 51.7% Participants by Age: 2000 2006 2000 2006 Rochester National 20-34 18.7% 29.2% 20.1% 26.7% 35-54 44.1% 39.2% 42.3% 41.5% 55-64 14.6% 15.4% 15.4% 15.2% 65 and over 22.5% 16.2% 22.2% 16.6% Participants by Education: 2000 2006 2000 2006 Rochester National Less than grade 11 7.1% 9.8% 18.4% 17.2% H.S. diploma/GED 30.7% 26.4% 24.3% 30.4% Some college 25.1% 21.9% 19.6% 16.7% Associates/technical 13.8% 16.6% 7.6% 9.2% Bachelor’s 12.6% 12.5% 16.9% 14.5% Some grad training 1.8% 2% 2.8% 1.5% Grad/Professional 8.8% 10.7% 10.4% 10.5% Race/Ethnicity: 2000 2006 2000 2006 Rochester National Non-Hispanic White 83.9% 79.3% 73.3% 70.4% African-American/Black 8.9% 11.2% 11.9% 9.7% Latino 2.7% 7.1% 9.6% 14.2% Other 4.6% 2.4% 5.2% 5.7% Income: 2000 2006 2000 2006 Rochester National $20K or less 19% 18% 16% 15.4% $20K to 30K 18% 18% 17% 16.2% $30K to 50K 26% 25% 26% 26% $50K to 75K 20% 19% 20% 20% $75K to 100K 9.8% 8.5% 9.2% 9.6% Over $100K 7.5% 11.1% 11% 12% 1 Please see Analytic Narrative at end of report for details on study methodology and statistical analysis. Bold type indicates statistically significant findings, while italicized type indicates strong, but not statistically significant, trends. Because the absolute number of Latino participants in Rochester was low, analyses involving this group should be considered tentative. 1
  • 2. Rochester Area Community Foundation Trust Analyses Q: Generally speaking, would you say that most people can be trusted or that you can’t be too careful in dealing with people? 2000 2006 2000 2006 Rochester National Most people can be trusted 52% 41.4% 47.1% 43.9% You can’t be too careful 42.5% 52.3% 45.9% 52.3% It depends 5.5% 6.3% 6.9% 3.8% Both Rochester and the nation suffered significant declines in overall trust between 2000 and 2006. Q: How much can you trust the people in your neighborhood? 2000 2006 2000 2006 Rochester National Trust them a lot 53.2% 48.1% 48.8% 45.9% Trust them some 33.8% 31% 33.6% 34.8% Trust them only a little 9.4% 15.5% 11.3% 13.6% Trust them not at all 3.6% 5.5% 6.3% 5.7% Again, both Rochester and the nation experienced significant drops in neighborhood trust. Analyses indicated that the decrease in neighborhood trust was significantly greater in Rochester than in the nation as a whole. Q: How much can you trust the people you work with? 2000 2006 2000 2006 Rochester National Trust them a lot 52.9% 47.7% 52.7% 49.7% Trust them some 34.5% 36.5% 31.3% 32.5% Trust them only a little 8.9% 12.7% 11.4% 12% Trust them not at all 3.8% 3.1% 4.6% 5.8% Again, both Rochester and the nation experienced significant declines in trust of co- workers. Again, the decline in Rochester was significantly greater than the decline in the national sample. 2
  • 3. Rochester Area Community Foundation Q: How much can you trust the people who work in the stores where you shop? 2000 2006 2000 2006 Rochester National Trust them a lot 31.8% 27.9% 29.2% 29.7% Trust them some 49.5% 51.1% 46.7% 48.5% Trust them only a little 13.8% 17.2% 16.9% 16.5% Trust them not at all 5% 3.7% 7.2% 5.3% Rochester suffered a significant, albeit small decrease in trust in this area, while the nation held predominately steady. Q: How much do you trust the police in your local community? 2000 2006 2000 2006 Rochester National Trust them a lot 55.6% 57% 50.6% 54.5% Trust them some 31.5% 29.5% 31.8% 28.5% Trust them only a little 8.6% 9.1% 10.8% 10% Trust them not at all 4.3% 4.5% 6.8% 7% Rochesterians have tended to trust the police slightly but significantly more than the nation across time. Analyses of Inter-racial Trust Q: How much do you trust white people? 2000 2006 2000 2006 Rochester National Trust them a lot 34.5% 31.5% 31.4% 32.5% Trust them some 57.6% 59.3% 55.8% 54.9% Trust them only a little 5.8% 7% 11% 9.5% Trust them not at all 2% 2.3% 1.8% 3.1% In Rochester, there was a significant, albeit small decrease in trust for white people, while the reverse trend was apparent in the national sample. 3
  • 4. Rochester Area Community Foundation Q: How much do you trust African-Americans? 2000 2006 2000 2006 Rochester National Trust them a lot 28.6% 25.6% 25.9% 27.1% Trust them some 61.3% 62.8% 58.3% 56.9% Trust them only a little 7.3% 10.2% 12.1% 10.9% Trust them not at all 2.8% 1.4% 3.7% 5/2% Despite small changes, Rochesterians remain significantly more trusting of African- Americans, when compared to the nation. Q: How much do you trust Asian people? 2000 2006 2000 2006 Rochester National Trust them a lot 29.5% 26.2% 25.4% 28.5% Trust them some 60.3% 61.8% 57.5% 55.7% Trust them only a little 7.7% 10.2% 12.9% 11.6% Trust them not at all 2.6% 1.8% 4.2% 4.2% Despite small changes, Rochesterians remain significantly more trusting of Asian- Americans when compared to the nation. Q: How much do you trust Latinos? 2000 2006 2000 2006 Rochester National Trust them a lot 26.8% 23.6% 23.5% 28% Trust them some 61.2% 64.3% 57.9% 55.2% Trust them only a little 8.9% 10.5% 14.9% 13% Trust them not at all 3.1% 1.5% 3.6% 3.7% Rochester experienced a significant dip in trust for Latinos, while the nation experienced a significant increase. However, overall, Rochesterians still appear more trusting. 4
  • 5. Rochester Area Community Foundation Tolerance Analyses Q: Would you like to see spending to tighten border security increased or decreased? (Asked only in 2006) 2006 2006 Rochester National Decreased 23.4% 23.4% Neither 6.9% 7.3% Increased 69.6% 69.3% In 2006, Rochesterians agreed strongly with the nation that border security should be tightened, with approximately 70% endorsing increases in spending in this area. Q: Would you like to see aid to Blacks increased or decreased? (Asked only in 2006) 2006 2006 Rochester National Decreased 29% 28.4% Neither 17.4% 20.9% Increased 53.6% 50.6% No significant differences between Rochester and the nation emerged on this variable. The variable is a proxy for racism, however, as there are no aid programs specific to African- Americans. Thus, nearly 30% of those surveyed, both in Rochester and across the nation, appear to believe there are such programs, and would like to see these non-existent programs cut. Q: Immigrants are getting too demanding in their push for equal rights. 2000 2006 2000 2006 Rochester National Agree strongly 12.5% 17.8% 20.7% 30.8% Agree somewhat 16.5% 21.9% 23.2% 23% Neither/Depends 4.4% 4.5% 4.4% 3.6% Disagree somewhat 35% 31.8% 27.9% 21.8% Disagree strongly 31.5% 24% 23.9% 20.7% Both Rochester and the nation evidenced significant declining support for immigrant rights between 2000 and 2006. However, it is notable that overall, Rochesterians remain more supportive of immigrant rights than the nation as a whole. 5
  • 6. Rochester Area Community Foundation Q: A book that most people disapprove of should be kept out of my public library. 2000 2006 2000 2006 Rochester National Agree strongly 8.4% 10.8% 14% 17.4% Agree somewhat 10% 10.9% 12.8% 10.3% Neither/Depends 3.4% 3.6% 3.5% 2.5% Disagree somewhat 23.2% 23.3% 20.9% 20.5% Disagree strongly 55% 51.3% 48.7% 49.3% Overall, 2006 proved a less tolerant year for both Rochester and the nation on this question; however Rochester remains more tolerant of controversial books when compared to the rest of the country. Q: Do you think the number of immigrants to America nowadays should be increased a lot, increased a little, remain the same as it is, reduced a little, or reduced a lot? (Only administered in 2006) 2006 2006 Rochester National Increased a lot 3.4% 3.9% Increased a little 9.7% 9.5% Remain the same 42% 36.4% Reduced a little 21.5% 22.1% Reduced a lot 17.9% 22.5% Can’t choose 5.5% 5.5% Overall, Rochester and the nation looked similar on this question, although there was a trend in the national sample for reducing the number of immigrants “a lot.” Q: Suppose a close friend or relative were marrying an Asian person. Would you very much favor it happening, somewhat favor, neither favor nor oppose, somewhat oppose, or very much oppose it happening? 2000 2006 2000 2006 Rochester National Very much favor 31.7% 25.4% 28.7% 22.4% Somewhat favor 12.2% 9.4% 13.3% 15% Neither favor nor oppose 50.2% 54% 47.8% 49% Somewhat oppose 4% 3.3% 5.6% 6.9% Very much oppose 1.9% 7.9% 4.6% 5.9% Both the nation and Rochester demonstrated significant decreases in tolerance on this question between 2000 and 2006, and the decrease in Rochester was particularly significant. 6
  • 7. Rochester Area Community Foundation Q: Suppose a close friend or relative were marrying a Black person. Would you… 2000 2006 2000 2006 Rochester National Very much favor 27.8% 26.2% 25.8% 22.2% Somewhat favor 10.7% 9.6% 12.6% 12.5% Neither favor nor oppose 47.3% 50.8% 42.6% 45.9% Somewhat oppose 7.7% 5.2% 8.8% 9% Very much oppose 6.5% 8.2% 10.2% 10.4% Analyses indicated that overall, Rochesterians view marrying a Black person significantly more favorably than the nation does. Q: Suppose a close friend or relative were marrying a White person. Would you… 2000 2006 2000 2006 Rochester National Very much favor 39.5% 39.7% 40.6% 36.6% Somewhat favor 9.9% 9.7% 13.4% 13.3% Neither favor nor oppose 46.9% 46.8% 42% 45.1% Somewhat oppose 2.2% 1.9% 1.9% 2.6% Very much oppose 1.6% 1.9% 2% 2.4% There were no significant changes to this question between 2000 and 2006, and there were also no significant differences between Rochester and the nation. Q: Suppose a close friend or relative were marrying a Latino person. Would you… 2000 2006 2000 2006 Rochester National Very much favor 30.1% 28% 26.8% 25.6% Somewhat favor 13.3% 8.5% 17.9% 14.6% Neither favor nor oppose 47.7% 52.6% 45.2% 47.3% Somewhat oppose 4.9% 4.8% 5.4% 6.6% Very much oppose 4.1% 6.1% 4.7% 5.8% There appeared to be a small but significant decrease between 2000 and 2006 in the perception of favorability of marriage to Latino people across the nation. Important to note about all 4 of these questions on inter-racial marriage – Rochesterians appeared more neutral that the nation overall, with higher endorsements of the “Neither favor nor oppose” option on each question, across both time periods. 7
  • 8. Rochester Area Community Foundation Q: Do you have a friend with a different religious orientation? 2000 2006 2000 2006 Rochester National Yes 82.3% 80% 76.5% 78% No 17.7% 20% 23.5% 22% Analyses indicated that although the difference is small, Rochesterians do tend to have more friends with different religious orientations than is seen nationally. Q: Do you have a friend who is Latino? 2000 2006 2000 2006 Rochester National Yes 46% 47.8% 49.4% 58.5% No 54% 52.2% 50.6% 41.5% Significantly more individuals in the national sample report having a Latino friend, and this trend increased significantly in the national sample between 2000 and 2006. Q: Do you have a friend who is African-American? 2000 2006 2000 2006 Rochester National Yes 65.2% 66.9% 60.7% 62.6% No 34.8% 33.1% 39.3% 37.4% Rochesterians are significantly more likely to report having an African-American friend, when compared to the national sample, and this finding is robust over time. 8
  • 9. Rochester Area Community Foundation Political Engagement Q: How interested are you in politics and national affairs? 2000 2006 2000 2006 Rochester National Very interested 11.6% 30.5% 13.2% 34.1% Somewhat interested 21.3% 38.5% 20.8% 35.5% Only slightly interested 40.1% 20.3% 36.1% 18.5% Not at all interested 26.9% 10.7% 29.9% 11.9% Analyses indicated strong increase in political interest between 2000 and 2006, with the nation slightly but significantly more interested than Rochester. Q: Are you currently registered to vote? 2000 2006 2000 2006 Rochester National Yes 84.9% 85.8% 80.1% 80.8% No 15.1% 14.2% 19.9% 19.2% Rochesterarians were significantly more likely to be registered to vote in 2000 when compared to the nation, and this trend continued in 2006. Q: Did you vote in the 1996/2004 presidential election? 2000 2006 2000 2006 Rochester National Yes 72.5% 79.4% 69.3% 73.9% No 27.5% 20.6% 30.7% 26.1% Reports of voting increased between 2000 and 2006 for both Rochester and the nation, and Rochesterians remained significantly more likely to have voted when compared to the nation. Q: How much of the time do you think you can trust the national government to do what is right? 2000 2006 2000 2006 Rochester National Just about always 2.3% 2.9% 3.3% 5.2% Most of the time 28% 30% 25.3% 25.6% Only some of the time 54.7% 48.2% 52% 45.6% Hardly ever 14.9% 19% 19.3% 19.6% Overall, trends on this question appeared to remain relatively stable over time, despite some movement within categories. 9
  • 10. Rochester Area Community Foundation Q: How much of the time do you think you can trust the local government to do what is right? 2000 2006 2000 2006 Rochester National Just about always 6.7% 6.4% 6% 5.9% Most of the time 41.1% 41.9% 37.3% 40.3% Only some of the time 43.3% 42.1% 45.7% 43.6% Hardly ever 8.9% 9.7% 11% 10.1% No significant differences emerged between 2000 and 2006, or between Rochester and the nation. Q: Have you signed a petition in the last 12 months? 2000 2006 2000 2006 Rochester National Yes 40.8% 38.6% 35.1% 35.3% No 59.2% 61.4% 64.9% 64.7% Rochesterians remained significantly more likely to report having recently signed a petition when compared to the nation. Q: Have you attended a political meeting or rally in the last 12 months? 2000 2006 2000 2006 Rochester National Yes 12% 21% 16.2% 17.8% No 88% 79% 83.8% 82.2% There was a significant increase in the country and in Rochester in participation in political meetings and rallies between 2000 and 2006, and this increase was particularly notable in Rochester. Q: Have you participated in demonstrations, boycotts, or marches in the past 12 months? 2000 2006 2000 2006 Rochester National Yes 4.3% 6.3% 7.1% 7.2% No 95.7% 93.7% 92.9% 92.8% Although there was a small, non-significant increase in demonstration participation in Rochester in 2006, the nation still significantly participates in more demonstrations, boycotts, and marches that do Rochesterians. 10
  • 11. Rochester Area Community Foundation Q: Do you participate in a political group? 2000 2006 2000 2006 Rochester National Yes 7.7% 9.8% 9.1% 9.8% No 92.3% 90.2% 90.9% 90.2% Analyses indicated no significant change on this question between 2000 and 2006, nor a significant difference between Rochester and the nation. Participation in political groups is roughly equal and stable. 11
  • 12. Rochester Area Community Foundation Community Engagement Q: Are you a member of a church or synagogue? 2000 2006 2000 2006 Rochester National Yes 68.5% 62.1% 65.4% 62.7% No 31.5% 37.9% 34.6% 37.3% Membership in religious institutions was significantly lower in 2006 than it was in 2000. Rochester and the nation did not differ from one another on this question. Q: Do you participate in church activities other than attending services? 2000 2006 2000 2006 Rochester National Yes 40.8% 44.5% 44.8% 45.2% No 59.2% 55.5% 55.2% 54.8% There were no changes on this question from 2000 to 2006, and no differences between Rochester and the nation. Q: Do you participate in an organization that is affiliated with religion? 2000 2006 2000 2006 Rochester National Yes 11.9% 16.2% 16.2% 17.2% No 88.1% 83.8% 83.8% 82.8% Although there was an increase in participation in such groups in Rochester between 2000 and 2006, the nation remains significantly more likely to participate in groups like Knights of Columbus, B’nai B’rith, or bible study groups. Q: Do you participate in a sports club, league, or outdoor activity club? 2000 2006 2000 2006 Rochester National Yes 23% 23.9% 20.5% 21.2% No 77% 76.1% 79.5% 78.8% There were no changes in participation in these groups between 2000 and 2006, nor were there any significant differences between Rochester and the nation. 12
  • 13. Rochester Area Community Foundation Q: Do you participate in a youth organization? 2000 2006 2000 2006 Rochester National Yes 22.4% 18.8% 22.3% 24.1% No 77.6% 81.2% 77.7% 75.9% There were no changes in participation in these groups between 2000 and 2006, nor were there any significant differences between Rochester and the nation. Q: Do you participate in a parent organization or other school support group? 2000 2006 2000 2006 Rochester National Yes 17.4% 19.2% 22.3% 20.8% No 82.6% 80.8% 77.7% 79.2% Rochesterians are significantly less likely to report participation in a parent organization or other school-affiliated group when compared to the national sample. Q: Do you participate in a veterans group? 2000 2006 2000 2006 Rochester National Yes 7.9% 13.2% 9.2% 10% No 92.1% 86.8% 90.8% 90% Participation in veterans groups showed a significant increase between 2000 and 2006. Q: Do you participate in a neighborhood association? 2000 2006 2000 2006 Rochester National Yes 15.4% 18.4% 20.4% 20.5% No 84.6% 81.6% 79.6% 79.5% Although more Rochesterians participated in neighborhood groups in 2006, this increase was not statistically significant; the nation still has significantly higher participation in neighborhood associations when compared to Rochester. 13
  • 14. Rochester Area Community Foundation Q: Do you participate in a seniors group? 2000 2006 2000 2006 Rochester National Yes 13.3% 16% 14.3% 14.6% No 86.7% 84% 85.7% 85.4% There were no changes in participation in these groups between 2000 and 2006, nor were there any significant differences between Rochester and the nation. Q: Do you participate in a charity or social welfare organization? 2000 2006 2000 2006 Rochester National Yes 29.7% 31.2% 31.9% 34% No 70.3% 68.8% 68.1% 66% Analyses indicated a significant increase in participation in such organizations between 2000 and 2006. Q: Do you participate in a labor union? 2000 2006 2000 2006 Rochester National Yes 10.1% 11.7% 11.6% 10.3% No 89.9% 88.3% 88.4% 89.7% There were no changes in participation in labor unions reported between 2000 and 2006, nor were there any significant differences between Rochester and the nation. Q: Do you participate in a professional, trade, farm, or business association? 2000 2006 2000 2006 Rochester National Yes 22.4% 23.8% 24.9% 22.2% No 77.6% 76.2% 75.1% 77.8% There were no changes in participation in these groups between 2000 and 2006, nor were there any significant differences between Rochester and the nation. Q: Do you participate in a service or fraternal organization? 2000 2006 2000 2006 Rochester National Yes 13.4% 12.4% 14.1% 13.9% No 86.6% 87.6% 85.9% 86.1% There were no changes in participation in these groups between 2000 and 2006, nor were there any significant differences between Rochester and the nation. 14
  • 15. Rochester Area Community Foundation Q: Do you participate in an ethnic, nationality, civil rights organization? 2000 2006 2000 2006 Rochester National Yes 4.4% 5.4% 6.5% 5.9% No 95.6% 94.6% 93.5% 94.1% Participants in the national sample reported significantly higher participation in such groups when compared to Rochesterians. Q: Do you participate in a literary, art, or musical group? 2000 2006 2000 2006 Rochester National Yes 17% 20.7% 17.4% 19.4% No 83% 79.3% 82.6% 80.6% Across the country, including Rochester, participation in arts and cultural groups increased significantly between 2000 and 2006. Q: Do you participate in a hobby, investment, or garden club? 2000 2006 2000 2006 Rochester National Yes 26.7% 29.1% 24.7% 23.8% No 73.3% 70.9% 75.3% 76.2% Rochesterians are significantly more likely to report participating in a hobby, investment, or garden club, when compared to the nation. Q: Do you participate in a self-help program? 2000 2006 2000 2006 Rochester National Yes 18.8% 20% 17% 20.3% No 81.2% 80% 83% 79.7% Across the nation, more individuals report participating in self-help programs in 2006 than did in 2000. 15
  • 16. Rochester Area Community Foundation Q: Did any of the groups that you were involved with take any local action for social or political reform in the past 12 months? 2000 2006 2000 2006 Rochester National Yes 16.9% 22.8% 17.5% 20.1% No 83.1% 77.2% 82.5% 79.9% Nationwide, significantly more people reported taking local social or political action for reform as part of a group in 2006. Q: In the past 12 months, have you served as an officer or served on a committee of any local club or organization? 2000 2006 2000 2006 Rochester National Yes 18.6% 22.4% 17.9% 17.6% No 81.4% 77.6% 82.1% 82.4% Significantly more Rochesterians reported taking a leadership role in a local committee, club, or organization during the last year when compared to the nation. Q: In the last 12 months, how many times have you volunteered? 2000 2006 2000 2006 Rochester National Zero times 47.4% 35.2% 45.3% 41.1% 1-4 times 16.1% 19.5% 17.8% 20% 5-11 times 14.5% 14.1% 14.8% 16% 12-23 times 8.2% 13.1% 8.3% 8.7% 24 or more times 13.9% 18% 13.9% 14.2% There was a significant decrease nationwide in the number of people reporting volunteering “zero times” during the past 12 months, and this decrease was notable in Rochester. This indicates that the nation is volunteering more, and this trend is clearly marked in Rochester. 16
  • 17. Rochester Area Community Foundation Q: During the past 12 months, approximately how much money did you and the other members of your household contribute to non-religious charities? 2000 2006 2000 2006 Rochester National None 28.1% 25.6% 35.6% 33.4% Less than $100 21.8% 20.8% 20.6% 18.3% $100 to less than $500 31.1% 27.7% 25.8% 28.5% $500 to less than $1000 9.7% 12.6% 9% 9% $1000 to less than $5000 8.6% 12.2% 7.3% 9.5% More than $5000 0.8% 1% 1.6% 1.4% Analyses indicated that Rochesterians gave significantly more to non-religious charities overall. Q: During the past 12 months, approximately how much money did you and the other members of your household contribute to all religious causes, including your congregation? 2000 2006 2000 2006 Rochester National None 32.7% 37.8% 29.6% 30.1% Less than $100 12.8% 14.2% 13.1% 12.8% $100 to less than $500 28% 19.4% 23.3% 22.5% $500 to less than $1000 9.7% 9.8% 10.5% 11.1% $1000 to less than $5000 14.1% 15.3% 18.7% 17.7% More than $5000 2.6% 3.5% 4.9% 5.7% Analyses indicated that, for Rochester only, there was a significant increase in the percentage of people reporting no giving to religious causes. However, Rochesterians gave significantly more than the nation in the “less than $100” range. 2006 was a significantly less giving year in the “$100 to less than $500” range across the nation. 17
  • 18. Rochester Area Community Foundation Cultural differences: Trust Q: Generally speaking, would you say that most people can be trusted or that you can’t be too careful in dealing with people? 2000 2006 2000 2006 Rochester National Most people can be trusted African-American 26.4% 17.5% 27.2% 28.2% Latino 24.3% 35.5% 23.2% 25.7% You can’t be too careful African-American 70.4% 80.6% 65.2% 67.7% Latino 66.6% 60.9% 67.4% 71% Across the nation, there was a significant increase in trust on the part of the Latino population. There was a notable trend towards a decrease in trust on the part of African- Americans, and this trend was particularly notable in Rochester. Q: How much can you trust the people who work in the stores where you shop? 2000 2006 2000 2006 Rochester National Trust them a lot African-Americans 10.2% 22.4% 16.1% 18.7% Latinos 12.6% 12.2% 13.9% 12.9% Trust them some African-Americans 52.8% 39.0% 43.9% 46.2% Latinos 40.4% 36% 37.5% 46.7% Trust them only a little African-Americans 25.1% 23.7% 25.3% 28.3% Latinos 31% 45.4% 30.8% 28.4% Trust them not at all African-Americans 11.9% 14.9% 14.8% 6.8% Latinos 16% 6.4% 17.9% 12% Across the nation, more African-Americans are expressing trust in local merchants. 18
  • 19. Rochester Area Community Foundation Q: How much can you trust the police in your local community? 2000 2006 2000 2006 Rochester National Trust them a lot African-Americans 16.2% 28.9% 27.3% 30.9% Latinos 32.3% 32.9% 38% 44.9% Trust them some African-Americans 44.6% 46.1% 38.4% 37.5% Latinos 35.6% 26.2% 31.3% 27.2% Trust them only a little African-Americans 25.6% 13.4% 20.4% 19% Latinos 21.9% 37.6% 19% 21.3% Trust them not at all African-Americans 13.6% 11.6% 13.8% 12.7% Latinos 10.2% 3.3% 11.7% 6.6% Nationally, Latinos were significantly more trusting of their local police in 2006. There was evidence of a notable trend towards increased trust on the part of African-Americans as well, although this trend did not reach the level of statistical significance. Cultural differences: Political Engagement Q: Are you currently registered to vote? 2000 2006 2000 2006 Rochester National Yes African-Americans 77.9% 76.9% 81% 86.9% Latinos 64.6% 53.7% 47.9% 43.7% No African-Americans 22.1% 23.1% 19% 13.1% Latinos 35.4% 46.3% 52.1% 56.3% Despite an overall drop in voter registration among Latinos, Latinos in Rochester remain significantly more likely to be registered voters when compared to Latinos nationally. 19
  • 20. Rochester Area Community Foundation Q: Have you signed a petition in the last 12 months? 2000 2006 2000 2006 Rochester National Yes African-Americans 36.3% 27.2% 21.1% 27.2% Latinos 29.5% 25.7% 18.9% 17% No African-Americans 63.7% 72.8% 78.9% 72.8% Latinos 70.5% 74.3% 81.1% 83% In Rochester, there was a significant decrease in the number of African-Americans reporting signing a petition, while these numbers increased significantly in the national sample. The overall effect was to bring African-Americans in Rochester and the nation to similar levels on this question. There was a notable trend for decreased petition signing by Latinos in Rochester, while the reverse was true nationally. However, Latinos in Rochester remained notably more likely to have signed a petition in the last 12 months. Cultural differences: Community Engagement Q: Have you worked on a community project in the last 12 months? 2000 2006 2000 2006 Rochester National Yes African-Americans 29.8% 39.6% 32.8% 32% Latinos 30.5% 24.2% 26.2% 17.6% No African-Americans 70.2% 60.4% 67.2% 68% Latinos 69.5% 75.8% 73.8% 82.4% Nationally, there was a significant decline in the number of Latinos reporting having worked on a community project. In Rochester, there was a notable trend towards increased work on community projects by African-Americans. 20
  • 21. Rochester Area Community Foundation Q: Are you a member of a church/synagogue? 2000 2006 2000 2006 Rochester National Yes African-Americans 63.4% 77.4% 70.8% 67.6% Latinos 62.7% 54% 46.2% 46.2% No African-Americans 36.6% 22.6% 29.2% 32.4% Latinos 37.3% 46% 53.8% 53.8% Between 2000 and 2006, there were significant changes in African-American church/synagogue membership, but these changes were the opposite for Rochester and the nation. In Rochester, significantly more African-Americans reported membership, while a significant decrease was seen nationally. In Rochester, there was a notable trend for decreased church/synagogue membership on the part of Latinos, although their membership rates remained higher than those seen in the national sample. Q: Do you participate in church activities other than attending services? 2000 2006 2000 2006 Rochester National Yes African-Americans 53.4% 49.8% 51.9% 45.3% Latinos 45.4% 39.9% 33.5% 38.1% No African-Americans 46.6% 50.2% 51.9% 45.3% Latinos 54.6% 60.1% 66.5% 61.9% Across the nation, significantly fewer African-Americans were participating in church activities in 2006. There was also a notable trend for decreased participation by Latinos in Rochester, while there was a slight increase in participation by Latinos in the national sample. 21
  • 22. Rochester Area Community Foundation Q: Do you participate in a parent association or other school support group? 2000 2006 2000 2006 Rochester National Yes African-Americans 25.7% 17.6% 31.2% 28% Latinos 34.8% 42% 17.3% 18.5% No African-Americans 74.3% 82.4% 68.8% 72% Latinos 65.2% 58% 82.7% 81.5% Nationally, significantly fewer African-Americans reported belonging to such groups, and this was notably pronounced in Rochester, which could produce challenges for emerging school initiatives in our area. Latino Rochesterians, however, continued to show significantly higher involvement in school groups when compared to their counterparts nationally. Further investigations of these differences could produce important avenues for local school initiatives. Q: Do you participate in a neighborhood association? 2000 2006 2000 2006 Rochester National Yes African-Americans 20.7% 23.1% 24.6% 28.3% Latinos 18.8% 31.7% 13.6% 13.2% No African-Americans 79.3% 76.9% 75.4% 71.7% Latinos 81.2% 68.3% 86.4% 86.8% Latino Rochesterians were significantly and dramatically more likely than their national counterparts to participate in neighborhood associations. Q: Do you participate in charity or social welfare organizations? 2000 2006 2000 2006 Rochester National Yes African-Americans 29.3% 42.8% 29.6% 39.7% Latinos 27% 38% 21.1% 25.4% No African-Americans 70.7% 57.2% 70.4% 60.3% Latinos 73% 62% 78.9% 74.6% Across the nation, African-Americans were significantly more likely to report participating in social welfare and charity organizations in 2006. There was a notable trend for increased participation in such organizations on the part of Latinos, and the trend was particularly pronounced in Rochester. 22
  • 23. Rochester Area Community Foundation Q: Do you participate in a professional, trade, farm or business association? 2000 2006 2000 2006 Rochester National Yes African-Americans 13.3% 23.5% 17.9% 18.6% Latinos 18.2% 29.3% 12% 7.8% No African-Americans 86.7% 76.5% 82.1% 81.4% Latinos 81.8% 70.7% 88% 92.2% There was a dramatic and significant increase in participation in these groups among Latinos in Rochester, while there was a significant decline in participation for Latinos in the national sample. There was also a notable trend for increased participation in these groups by African-Americans, but only in Rochester. Q: Do you participate in an ethnic, nationality, or civil rights organization? 2000 2006 2000 2006 Rochester National Yes African-Americans 9.4% 20.9% 17.3% 20% Latinos 8.3% 6.5% 6.3% 7.9% No African-Americans 90.6% 79.1% 82.7% 80% Latinos 91.7% 93.5% 93.7% 92.1% Nationally, significantly more African-Americans were participating in such organizations in 2006; between 2000 and 2006, the increase seen among African-Americans in Rochester was dramatic and brought the Rochester community in line with national numbers. Q: Do you belong to any group that has taken local action for reform? 2000 2006 2000 2006 Rochester National Yes African-Americans 17.2% 20.3% 14.6% 24.7% Latinos 20.7% 19.5% 11.5% 10.7% No African-Americans 82.8% 79.7% 85.4% 75.3% Latinos 79.3% 80.5% 88.5% 89.3% Nationally, significantly more African-Americans were taking part in efforts seeking local reforms in 2006. There was also a notable trend for Latinos in Rochester to be more involved in such efforts than their national counterparts. 23
  • 24. Rochester Area Community Foundation Q: Have you served as an officer or on a committee? 2000 2006 2000 2006 Rochester National Yes African-Americans 10.4% 19.2% 15% 19.4% Latinos 15.6% 17.8% 11.4% 9.4% No African-Americans 89.6% 80.8% 85% 80.6% Latinos 84.4% 82.2% 88.6% 90.6% There was a significant national increase in service by African-Americans; the increase in Rochester was notable, and brought our community in line with national trends. 24
  • 25. Rochester Area Community Foundation Analytic Narrative In 2000, thirty-nine communities participated in The Social Capital Benchmark Survey, designed by Professor Robert Putnam, of Harvard University, which sought to measure key elements of “social capital,” including civic engagement, trust in others, levels of social activity, and tolerance for cultural differences. This original benchmarking survey was administered by telephone using random digit dialing techniques. In addition to the discrete community samples that were polled, information from a nationally representative sample was also collected. At the time, this was the largest-ever survey of civic engagement performed in the United States. In Rochester, the Rochester Area Community Foundation polled 988 residents living in the Greater Rochester region, including those in Monroe, Wayne, Ontario, Livingston, Genesee and Orleans counties. This sample included a purposive oversampling of African-American and Latino residents. This oversampling was done in order to best represent the views of these groups. In 2006, 21 different communities agreed to participate in a follow-up survey to the original benchmarking survey. The Rochester Area Community Foundation, feeling that follow-up data could be extremely helpful to many interested parties in our community, decided to participate in this follow-up. 700 residents of the same 6 counties were again polled by phone. The actual survey used in 2006 did differ slightly from the original benchmarking survey. Certain questions from the previous survey were dropped by Harvard, while others were added. The majority of questions, however, remained the same. Again in 2006, Rochester chose to add a purposive oversampling of African-American and Latinos in the Greater Rochester area. And again, Harvard University collected data from a nationally representative sample to complement the data collected by participating communities. The data discussed in this Technical Report were derived from the combination of 4 discrete data files: data from Rochester in 2000, data from Rochester in 2006, data from the nationally representative sample in 2000, and data from the nationally representative sample in 2006. All these data were merged so that the impact of time, sample (Rochester vs. National) and the interaction of time with sample, could be studied. In approaching this analysis, the Rochester Area Community Foundation sought analytic advice from our lead analytic volunteer consultant, Dr. Steven M. LaLonde, of the John D. Hromi Center for Quality and Applied Statistics at the Rochester Institute of Technology. We are extremely grateful to Dr. Lalonde for first suggesting useful analytic strategies, and then reviewing the first set of analyses produced for accuracy and appropriateness. Nominal regression, including Binomial and Multinomial subtypes, was chosen as the best possible analytic strategy. These analyses are most appropriate when trying to understand the role of multiple factors (like time and place) on survey questions that are made up of discrete response categories. The statistical package SPSS 15.1 was utilized for all analyses, as recommended by Harvard University. All analyses conducted here, with the exception of those examining cultural differences (to be discussed below), were conducted using representativeness weights assigned by Harvard. These weights were assigned to each individual respondent in an effort to make the sample resemble as closely as possible the residents of the Greater Rochester area and the nation (in the case of the national sample). Representativeness was determined by an analytic process using Census data as its base. This weighting was particularly necessary for Rochester, as we chose to purposely oversample members of certain cultural groups. The weighting variable took this into account, 25
  • 26. Rochester Area Community Foundation and produced analyses that brought the percentages of members of the various groups surveyed into line with the most recent Census data available for the Greater Rochester area. The weighting variable was removed for analyses of cultural differences, so that the purposive oversample, which increased beyond representativeness the numbers of ethnic minority individuals, could be utilized to best portray the views of individuals from these communities. Despite doing this, it is very important to note that the absolute number of Latino respondents remained small; therefore it is essential to consider all analyses on the Latino population as tentative at this time. In this report, all statistically significant findings are shown in bold typeface, while findings that verged on statistical significance and therefore also deserved attention are represented in italics. Not all analyses conducted are represented in this report, for several reasons. First, to do so would make this report extraordinarily lengthy, as the survey contained over 60 questions, and took an average of 20-30 minutes to administer to each participant. Second, many of the analyses did not produce any helpful information – in some case, there was no change from 2000 to 2006, nor any differences between Rochester and the nation. In other cases, the questions did not appear to “read well” with respondents, and data emerging from analyses on these questions was difficult to interpret. Finally, we made a selection of those analyses we thought would be most helpful to community stakeholders. However, we can make additional analyses available to interested parties upon request. We do plan to continue our work with this data, and should additional important findings emerge, we will certainly report these to the community. Questions on the data analytic strategy should be directed to Dr. Mark A. Biernbaum, Senior Program Officer, Rochester Area Community Foundation. 26