SlideShare una empresa de Scribd logo
1 de 13
BUSINESS STATISTICS - WHAT AND WHY?


Definition of Statistics-

Statistics is the study of how to collect, organize, analyze, and interpret numerical information
from data.

Types of Statistics

Descriptive statistics involves methods of organizing, picturing and summarizing information
from data. Inferential statistics involves methods of using information from a sample to draw
conclusions about the population.

Steps in Statistical Investigation-

Five stages of statistical investigation


                                      Collection of Data

                                               ↓

                                  Organization of data

                                              ↓

                                  Presentation of data

                                              ↓

                                           Analysis

                                              ↓

                                Interpretation of Results

a) Collection of Data
        A structure of statistical investigation is based on a systematic collection of data. The
data is classified into two groups

        i) Internal data and

        ii) External data
Internal data are obtained from internal records related to operations of business
organisation such as production, source of income and expenditure, inventory, purchases and
accounts.

        The external data are collected and purchased by external agencies. The external data
could be either primary data or secondary data. The primary data are collected for first time and
original, while secondary data are collected by published by some agencies.

b) Organisations of data
       The collected data is a large mass of figures that needs to be organised. The collected
data must be edited to rectify for any omissions, irrelevant answers, and wrong computations.
The edited data must be classified and tabulated to suit further analysis.

c) Presentation of data
       The large data that are collected cannot be understand and analysis easily and quickly.
Therefore, collected data needs to be presented in tabular or graphic form. This systematic order
and graphical presentation helps for further analysis.

d) Analysis of data
       The analysis requires establishing the relationship between one or more variables.
Analysis of data includes condensation, abstracting, summarization, conclusion etc. With the
help of statistical tools and techniques like measures of dispersion central tendency, correlation,
variance analysis etc analysis can be done.

e) Interpretation of data
        The interpretation requires deep insight of the subject. Interpretation involves drawing
the valid conclusions on the bases of the analysis of data. This work requires good experience
and skill. This process is very important as conclusions of results are done based on
interpretation.

FUNCTIONS OF STATISTICS

Statistics as a discipline is considered indispensable in almost all spheres of human knowledge.
There is hardly any branch of study which does not use statistics. Scientific, social and economic
studies use statistics in one form or another. These disciplines make-use of observations, facts
and figures, enquiries and experiments etc. using statistics and statistical methods. Statistics
studies almost all aspects in an enquiry. It mainly aims at simplifying the complexity of
information collected in an enquiry. It presents data in a simplified form as to make them
intelligible. It analyses data and facilitates drawal of conclusions. Now let us briefly discuss
some of the important functions of statistics.
1. Presents facts in. simple form:
Statistics presents facts and figures in a definite form. That makes the statement logical and
convincing than mere description. It condenses the whole mass of figures into a single figure.
This makes the problem intelligible.
2. Reduces the Complexity of data:

Statistics simplifies the complexity of data. The raw data are unintelligible. We make them
simple and intelligible by using different statistical measures. Some such commonly used
measures are graphs, averages, dispersions, skewness, kurtosis, correlation and regression etc.
These measures help in interpretation and drawing inferences. Therefore, statistics enables to
enlarge the horizon of one's knowledge.

3. Facilitates comparison:

Comparison between different sets of observation is an important function of statistics.
Comparison is necessary to draw conclusions as Professor Boddington rightly points out.” the
object of statistics is to enable comparison between past and present results to ascertain the
reasons for changes, which have taken place and the effect of such changes in future. So to
determine the efficiency of any measure comparison is necessary. Statistical devices like
averages, ratios, coefficients etc. are used for the purpose of comparison.

4. Testing hypothesis:

Formulating and testing of hypothesis is an important function of statistics. This helps in
developing new theories. So statistics examines the truth and helps in innovating new ideas.

5. Formulation of Policies :

Statistics helps in formulating plans and policies in different fields. Statistical analysis of data
forms the beginning of policy formulations. Hence, statistics is essential for planners,
economists, scientists and administrators to prepare different plans and programmes.

6. Forecasting :

The future is uncertain. Statistics helps in forecasting the trend and tendencies. Statistical
techniques are used for predicting the future values of a variable. For example a producer
forecasts his future production on the basis of the present demand conditions and his past
experiences. Similarly, the planners can forecast the future population etc. considering the
present population trends.

7. Derives valid inferences :
Statistical methods mainly aim at deriving inferences from an enquiry. Statistical techniques are
often used by scholars planners and scientists to evaluate different projects. These techniques are
also used to draw inferences regarding population parameters on the basis of sample information.

Limitations of statistics:

Statistics with all its wide application in every sphere of human activity has its own limitations.
Some of them are given below.

1. Statistics is not suitable to the study of qualitative phenomenon: Since statistics is basically a
science and deals with a set of numerical data, it is applicable to the study of only these subjects
of enquiry, which can be expressed in terms of quantitative measurements. As a matter of fact,
qualitative phenomenon like honesty, poverty, beauty,intelligence etc, cannot be expressed
numerically and any statistical analysis cannot be directly applied on these qualitative
phenomenons. Nevertheless, statistical techniques may be applied indirectly by first reducing the
qualitative expressions to accurate quantitative terms. For example, the intelligence of a group of
students can be studied on the basis of their marks in a particular examination.

2. Statistics does not study individuals: Statistics does not give any specific importance to the
individual items, in fact it deals with an aggregate of objects. Individual items, when they are
taken individually do not constitute any statistical data and do not serve any purpose for any
statistical enquiry.

3. Statistical laws are not exact: It is well known that mathematical and physical sciences are
exact. But statistical laws are not exact and statistical laws are only approximations. Statistical
conclusions are not universally true. They are true only on an average.

4. Statistics table may be misused: Statistics must be used only by experts; otherwise, statistical
methods are the most dangerous tools on the hands of the inexpert. The use of statistical tools by
the inexperienced and untraced persons might lead to wrong conclusions. Statistics can be easily
misused by quoting wrong figures of data. As King says9aptly ‘ statistics are like clay of which
one can make a God or Devil as one pleases’ .

5. Statistics is only, one of the methods of studying a problem:

Statistical method do not provide complete solution of the problems because problems are to be
studied taking the background of the countries culture, philosophy or religion into consideration.
Thus the statistical study should be supplemented by other evidences.

Statistics can analyze only aggregated observation or data:

Any statistics is a collection of data.Individual observation does not belong to statisticshence,
statistics analyses a collection of data andenlighten the overall estimated result. For-example the
average income of the laborers of abusiness can be estimated by observing their percapital
income. Average income does notparticularize anybody or neglect anybodiesincome. In this
respect, statistics gives an over allidea.

•Statistics describes only numeral information:

Statistics is anexposure of the numerical data .If it is not possibleto express in a, statistics fail to
make acomparative study between rich and poor, soundand ill etc .

•Statistics given only overall measures:

 statics gives us only anaverage or overall estimation. It is almostimpossible to achieve a
particular result. After aprolonged observation as it is found in otherbranches of knowledge. As
the data are influencedby different factors, the some result is notavailable every time.

•Statistics rules are mutable:

In some brunches of science some unchangeableprinciples and data are available .but in
statisticsthey are not found. The principles of statistics arevariable and changeable, approximate
etc.

•Statistics is simply amethod:

 The practical solution of anyproblem can be done in many ways. Statistics isone of the methods
of solving the problem. Itsevidences give the ideas of any matterbeforehand. Its evidences are to
be relativelysupported by other observation or data.

•Statistics incapable indecision making:

It is not alwayspossible for statistics to take proper decision.proper decision always depends on
proper data.But the data is statistics are often collected byunskilled persons.

•Statistics cannot expressthe entire data set:

 Statisticsmethod dose not express the topic or incidentfully. It simplifies the complicated data
andpresents them.

•Using inappropriateinformation:

Unskilled, idle andinexperienced person often collect data. As aresult, erroneous, puzzling and
partial informationis collected. As a result, very often improperdecision is taken.

•Purposive misuses:

 The most totallimitation of statistics is that its purposive misuse.Very often erroneous
information may becollected. But sometimes some institutions usestatistics for self interest and
puzzling otherorganizations.
COLLECTION OF DATA

Everybody collects, interprets and uses information, much of it in a numerical or statistical forms
in day-to-day life. It is a common practice that people receive large quantities of information
everyday through conversations, televisions, computers, the radios, newspapers, posters, notices
and instructions. It is just because there is so much information available that people need to be
able to absorb, select and reject it. In everyday life, in business and industry, certain statistical
information is necessary and it is independent to know where to find it how to collect it. As
consequences, everybody has to compare prices and quality before making any decision about
what goods to buy. As employees of any firm, people want to compare their salaries and
working conditions, promotion opportunities and so on. In time the firms on their part want to
control costs and expand their profits.

One of the main functions of statistics is to provide information which will help on making
decisions. Statistics provides the type of information by providing a description of the present, a
profile of the past and an estimate of the future. The following are some of the objectives of
collecting statistical information.

1. To describe the methods of collecting primary statistical information.

2. To consider the status involved in carrying out a survey.

3. To analyse the process involved in observation and interpreting.

4. To define and describe sampling.

5. To analyse the basis of sampling.

6. To describe a variety of sampling methods.

Categories of data:

Any statistical data can be classified under two categories depending upon the sources
utilized.These categories are,

1. Primary data                                                                       2. Se condary
data

Statistical Data
Statistical investigation is a long and comprehensive process and requires systematic
collection of data in large size. The validity and accuracy of the conclusion or results of the
study depends upon how well the data were gathered. The quality of data will greatly influence
the conclusions of the study and hence importance is to be given to the data collection process.

       Statistical data may be classified as Primary Data and Secondary Data based on the
sources of data collection.


   Primary data
         Primary data are those which are collected for the first time by the investigator /
researchers and are thus original in character. Thus, data collected by investigator may be for the
specific purpose / study at hand. Primary data are usually in the shape of raw materials to which
statistical methods are applied for the purpose of analysis and interpretation.


   Secondary data
        Secondary have been already collected for the purpose other than the problem at hand.
These data are those which have already been collected by some other persons and which have
passed through the statistical analysis at least once. Secondary data are usually in the shape of
finished products since they have been already treated statistically in one or the other form.
After statistical treatment the primary data lose their original shape and becomes secondary data.
Secondary data of one organisation become the primary data of other organisation who first
collect and publish them.


Primary Vs Secondary Data

    Researcher originates primary data for specific purpose / study at hand while secondary
     data have already been collected for purpose other than research work at hand.
    Primary data collection requires considerably more time, relatively expensive. While the
     secondary data are easily accessible, inexpensive and quickly obtained.
                     Table – A compression of Primary and Secondary Data

                                    Primary data                 Secondary data
Collection purpose           For the problem at hand       For other problems
Collection process           Very involved                 Rapid and easy
Collection cost              High                          Relatively low
Collection time              Long                          Short
Suitability                  Its suitability is positive   It may or may not suit the
                                                           object of survey
Originality                  It is original                It is not original
Precautions                  No extra precautions          It should be used with
                             required to use the data      extra case


Limitations of secondary data

   a) Since secondary data is collected for ‘some other purpose, its usefulness to current
      problem may be limited in several important ways, including relevancies and accuracy.
   b) The objectives, nature and methods used to collect secondary data may not be appropriate
      to present situation.
   c) The secondary data may not be accurate, or they may not be completely current or
      dependable.


Criteria for evaluating secondary data

       Before using the secondary data it is important to evaluate them on following factors

   a) Specification and methodology used to collect the data
   b) Error and accuracy of data.
   c) The currency
   d) The objective – The purpose for which data were collected
   e) The nature – content of data
   f) The dependability


Sources of data

       Primary source – The methods of collecting primary data.
When data is neither internally available nor exists as a secondary source, then the
primary sources of data would be approximate.

          The various method of collection of primary data are as follows

       a) Direct personal investigation
                -   Interview
                -   Observation
       b) Indirect or oral investigation
       c) Information from local agents and correspondents
       d) Mailed questionnaires and schedules
       e) Through enumerations
Secondary source – The methods of collecting secondary data

i)        Published Statistics
          a) Official publications of Central Government
          Ex: Central Statistical Organisation (CSO) – Ministry of planning

                -   National Sample Survey Organisation (NSSO)
                -   Office of the Registrar General and Census Committee – GOI
                -   Director of Statistics and Economics – Ministry of Agriculture
                -   Labour Bureau – Ministry of Labour etc.
ii)       Publications of Semi-government organisation
          Ex:

                -   The institute of foreign trade, New Delhi
                -   The institute of economic growth, New Delhi.
iii)      Publication of research institutes
          Ex:

                -   Indian Statistical Institute
                -   Indian Agriculture Statistical Institute
                -   NCRET Publications
                -   Indian Standards Institute etc.
iv)         Publication of Business and Financial Institutions
          Ex:
-   Trade Association Publications like Sugar factory, Textile mill, Indian chamber of
                 Industry and Commerce.
             -   Stock exchange reports, Co-operative society reports etc.
v)     News papers and periodicals
       Ex:

             -   The Financial Express, Eastern Economics, Economic Times, Indian Finance, etc.
vi)    Reports of various committees and commissions
       Ex:

             -   Kothari commission report on education
             -   Pay commission reports
             -   Land perform committee reports etc.
vii)   Unpublished statistics
             -   Internal and administrative data like Periodical Loss, Profit, Sales, Production
                 Rate, Balance Sheet, Labour Turnover, Budges, etc.


Primary data:

Primary data is the one, which is collected by the investigator himself for the purpose of a
specific inquiry or study. Such data is original in character and is generated by survey conducted
by individuals or research institution or any organisation.

The primary data can be collected by the following five methods.

1. Direct personal interviews.

2. Indirect Oral interviews.

3. Information from correspondents.

4. Mailed questionnaire method.

5. Schedules sent through enumerators

1. Direct personal interviews:

The persons from whom informations are collected are known as informants. The investigator
personally meets them and asks questions to gather the necessary informations. It is the suitable
method for intensive rather than extensive field surveys. It suits best for intensive study of the
limited field.
2. Indirect Oral Interviews:

 Under this method the investigator contacts witnesses or neighbours or friends or some other
third parties who are capable of supplying the necessary information. This method is preferred if
the required information is on addiction or cause of fire or theft or murder etc., If a fire has
broken out a certain place, the persons living in neighbourhood and witnesses are likely to give
information on the cause of fire. In some cases, police interrogated third parties who are
supposed to have knowledge of a theft or a murder and get some clues. Enquiry committees
appointed by governments generally adopt this method and get people’ s views and all possible
details of facts relating to the enquiry. This method is suitable whenever direct sources do not
exists or cannot be relied upon or would be unwilling to part with the information.

3. Information from correspondents:

The investigator appoints local agents or correspondents in different places and compiles the
information sent by them. Informations to Newspapers and some departments of Government
come by this method. The advantage of this method is that it is cheap and appropriate for
extensive investigations. But it may not ensure accurate results because the correspondents are
likely to be negligent, prejudiced and biased. This method is adopted in those cases where
informations are to be collected periodically from a wide area for a long time.

4. Mailed questionnaire method:

Under this method a list of questions is prepared and is sent to all the informants by post. The
list of questions is technically called questionnaire. A covering letter accompanying the
questionnaire explains the purpose of the investigation and the importance of correct
informations and request the informants to fill in the blank spaces provided and to return the
form within a specified time. This method is appropriate in those cases where the informants are
literates and are spread over a wide area.

5. Schedules sent through Enumerators:

Under this method enumerators or interviewers take the schedules, meet the informants and
filling their replies. Often distinction is made between the schedule and a questionnaire. A
schedule is filled by the interviewers in a face-to-face situation with the informant. A
questionnaire is filled by the informant which he receives and returns by post. It is suitable for
extensive surveys.

Secondary Data:

Secondary data are those data which have been already collected and analysed by some earlier
agency for its own use; and later the same data are used by a different agency.
According to W.A.Neiswanger, ‘ A primary source is a publication in which the data are
published by the same authority which gathered and analysed them. A secondary source is a
publication, reporting the data which have been gathered by other authorities and for which
others are responsible’ .

Sources of Secondary data:

In most of the studies the investigator finds it impracticable to collect first-hand information on
all related issues and as such he makes use of the data collected by others. There is a vast
amount of published information from which statistical studies may be made and fresh statistics
are constantly in a state of production.

The sources of secondary data can broadly be classified under two heads:

1. Published sources, and

2. Unpublished sources.

1. Published Sources:

The various sources of published data are:

1. Reports and official publications of

(i) International bodies such as the International Monetary Fund, International Finance
Corporation and United Nations Organisation.

(ii) Central and State Governments such as the Report of the Tandon Committee and Pay
Commission.

2. Semi-official publication of various local bodies such as Municipal Corporations and District
Boards.

3. Private publications-such as the publications of –

(i) Trade and professional bodies such as the Federation ofIndian Chambers of Commerce and
Institute of Chartered Accountants.

(ii) Financial and economic journals such as ‘ Commerce’ , ‘ Capital’ and ‘ Indian Finance’ .

(iii) Annual reports of joint stock companies.

(iv) Publications brought out by research agencies, research scholars, etc.

2. Unpublished Sources
All statistical material is not always published. There are various sources of unpublished data
such as records maintained by various Government and private offices, studies made by research
institutions, scholars, etc. Such sources can also be used where necessary

Precautions in the use of Secondary data

The following are some of the points that are to be considered in the use of secondary data

1. How the data has been collected and processed

2. The accuracy of the data

3. How far the data has been summarized

4. How comparable the data is with other tabulations

5. How to interpret the data, especially when figures collected for one purpose is used for another

Generally speaking, with secondary data, people have to compromise between what they want
and what they are able to find.

Merits and Demerits of Secondary Data:

1. Secondary data is cheap to obtain. Many government publications are relatively cheap and
libraries stock quantities of secondary data produced by the government, by companies and other
organisations.

2. Large quantities of secondary data can be got through internet.

3. Much of the secondary data available has been collected for many years and therefore it can be
used to plot trends.

4. Secondary data is of value to:

- The government – help in making decisions and planning future policy.

- Business and industry – in areas such as marketing, and sales in order to appreciate the general
economic and social conditions and to provide information on competitors.

- Research organisations – by providing social,economical and industrial information.

Más contenido relacionado

La actualidad más candente

Application of Statistics in Business
Application of Statistics in BusinessApplication of Statistics in Business
Application of Statistics in Businesshasan faroqui
 
Introduction to Statistics - Basic concepts
Introduction to Statistics - Basic conceptsIntroduction to Statistics - Basic concepts
Introduction to Statistics - Basic conceptsDocIbrahimAbdelmonaem
 
Introduction to Statistics (Part -I)
Introduction to Statistics (Part -I)Introduction to Statistics (Part -I)
Introduction to Statistics (Part -I)YesAnalytics
 
Nature, Scope, Functions and Limitations of Statistics
Nature, Scope, Functions and Limitations of StatisticsNature, Scope, Functions and Limitations of Statistics
Nature, Scope, Functions and Limitations of StatisticsAsha Dhilip
 
Business statistics what and why
Business statistics what and whyBusiness statistics what and why
Business statistics what and whydibasharmin
 
Basics stat ppt-types of data
Basics stat ppt-types of dataBasics stat ppt-types of data
Basics stat ppt-types of dataFarhana Shaheen
 
Introduction to business statistics
Introduction to business statisticsIntroduction to business statistics
Introduction to business statisticsAakash Kulkarni
 
Time Series
Time SeriesTime Series
Time Seriesyush313
 
Applications of statistics
Applications of statisticsApplications of statistics
Applications of statisticsVinit Suchak
 
Meaning of statistics
Meaning of statisticsMeaning of statistics
Meaning of statisticsSarfraz Ahmad
 
Quantitative Techniques: Introduction
Quantitative Techniques: IntroductionQuantitative Techniques: Introduction
Quantitative Techniques: IntroductionDayanand Huded
 
Statistics: Chapter One
Statistics: Chapter OneStatistics: Chapter One
Statistics: Chapter OneSaed Jama
 
Meaning and Importance of Statistics
Meaning and Importance of StatisticsMeaning and Importance of Statistics
Meaning and Importance of StatisticsFlipped Channel
 
Trend analysis and time Series Analysis
Trend analysis and time Series Analysis Trend analysis and time Series Analysis
Trend analysis and time Series Analysis Amna Kouser
 

La actualidad más candente (20)

Business statistics
Business statisticsBusiness statistics
Business statistics
 
Statistics
StatisticsStatistics
Statistics
 
Application of Statistics in Business
Application of Statistics in BusinessApplication of Statistics in Business
Application of Statistics in Business
 
Introduction to Statistics - Basic concepts
Introduction to Statistics - Basic conceptsIntroduction to Statistics - Basic concepts
Introduction to Statistics - Basic concepts
 
Introduction to Statistics (Part -I)
Introduction to Statistics (Part -I)Introduction to Statistics (Part -I)
Introduction to Statistics (Part -I)
 
Nature, Scope, Functions and Limitations of Statistics
Nature, Scope, Functions and Limitations of StatisticsNature, Scope, Functions and Limitations of Statistics
Nature, Scope, Functions and Limitations of Statistics
 
Business statistics what and why
Business statistics what and whyBusiness statistics what and why
Business statistics what and why
 
Basics stat ppt-types of data
Basics stat ppt-types of dataBasics stat ppt-types of data
Basics stat ppt-types of data
 
Introduction to business statistics
Introduction to business statisticsIntroduction to business statistics
Introduction to business statistics
 
Time Series
Time SeriesTime Series
Time Series
 
time series analysis
time series analysistime series analysis
time series analysis
 
Applications of statistics
Applications of statisticsApplications of statistics
Applications of statistics
 
Index number
Index numberIndex number
Index number
 
Meaning of statistics
Meaning of statisticsMeaning of statistics
Meaning of statistics
 
Time series
Time seriesTime series
Time series
 
Quantitative Techniques: Introduction
Quantitative Techniques: IntroductionQuantitative Techniques: Introduction
Quantitative Techniques: Introduction
 
Statistics: Chapter One
Statistics: Chapter OneStatistics: Chapter One
Statistics: Chapter One
 
Meaning and Importance of Statistics
Meaning and Importance of StatisticsMeaning and Importance of Statistics
Meaning and Importance of Statistics
 
Trend analysis and time Series Analysis
Trend analysis and time Series Analysis Trend analysis and time Series Analysis
Trend analysis and time Series Analysis
 
1634 time series and trend analysis
1634 time series and trend analysis1634 time series and trend analysis
1634 time series and trend analysis
 

Destacado

Business Statistics
Business StatisticsBusiness Statistics
Business Statisticsshorab
 
Parts and Function of Computer
Parts and Function of ComputerParts and Function of Computer
Parts and Function of ComputerRhenan Belisario
 
Business Statistics
Business StatisticsBusiness Statistics
Business StatisticsTim Walters
 
Statistics for management
Statistics for managementStatistics for management
Statistics for managementVinay Aradhya
 
Research paper powerpoint presentation for public viewing
Research paper powerpoint presentation for public viewingResearch paper powerpoint presentation for public viewing
Research paper powerpoint presentation for public viewingKnuckles McGuire
 
Research project power point
Research project power pointResearch project power point
Research project power pointafonderwhite
 
Research Presentation Format
Research Presentation FormatResearch Presentation Format
Research Presentation FormatLifelong Learning
 
Research report ppt
Research report pptResearch report ppt
Research report pptVikas Dalmia
 
Research project ppt
Research project pptResearch project ppt
Research project pptJohn McKeown
 
Sample Methodology
Sample MethodologySample Methodology
Sample MethodologyAiden Yeh
 
Introduction To Statistics
Introduction To StatisticsIntroduction To Statistics
Introduction To Statisticsalbertlaporte
 

Destacado (12)

Business Statistics
Business StatisticsBusiness Statistics
Business Statistics
 
Parts and Function of Computer
Parts and Function of ComputerParts and Function of Computer
Parts and Function of Computer
 
Business Statistics
Business StatisticsBusiness Statistics
Business Statistics
 
Statistics for management
Statistics for managementStatistics for management
Statistics for management
 
Research paper powerpoint presentation for public viewing
Research paper powerpoint presentation for public viewingResearch paper powerpoint presentation for public viewing
Research paper powerpoint presentation for public viewing
 
Research project power point
Research project power pointResearch project power point
Research project power point
 
Presentation Of Research Work
Presentation Of Research WorkPresentation Of Research Work
Presentation Of Research Work
 
Research Presentation Format
Research Presentation FormatResearch Presentation Format
Research Presentation Format
 
Research report ppt
Research report pptResearch report ppt
Research report ppt
 
Research project ppt
Research project pptResearch project ppt
Research project ppt
 
Sample Methodology
Sample MethodologySample Methodology
Sample Methodology
 
Introduction To Statistics
Introduction To StatisticsIntroduction To Statistics
Introduction To Statistics
 

Similar a Introduction to Business Statistics

probability and statistics-4.pdf
probability and statistics-4.pdfprobability and statistics-4.pdf
probability and statistics-4.pdfhabtamu292245
 
Bahir dar institute of technology.pdf
Bahir dar institute of technology.pdfBahir dar institute of technology.pdf
Bahir dar institute of technology.pdfHailsh
 
Lecture 1 PPT.ppt
Lecture 1 PPT.pptLecture 1 PPT.ppt
Lecture 1 PPT.pptRAJKAMAL282
 
Lecture 1 PPT.pdf
Lecture 1 PPT.pdfLecture 1 PPT.pdf
Lecture 1 PPT.pdfRAJKAMAL282
 
Introduction of Statistics
Introduction of StatisticsIntroduction of Statistics
Introduction of StatisticsRaja Ram Sharma
 
Statistics / Quantitative Techniques Study Material
Statistics / Quantitative Techniques Study MaterialStatistics / Quantitative Techniques Study Material
Statistics / Quantitative Techniques Study MaterialPrabal Chakraborty
 
BBA 2ND SEM STATISTIC.pdf
BBA 2ND SEM STATISTIC.pdfBBA 2ND SEM STATISTIC.pdf
BBA 2ND SEM STATISTIC.pdfRam Krishna
 
Statistical analysis and Statistical process in 2023 .pptx
Statistical analysis and Statistical process in 2023 .pptxStatistical analysis and Statistical process in 2023 .pptx
Statistical analysis and Statistical process in 2023 .pptxFayaz Ahmad
 
Meaning and uses of statistics
Meaning and uses of statisticsMeaning and uses of statistics
Meaning and uses of statisticsRekhaChoudhary24
 
Inroduction to statistics
Inroduction to statisticsInroduction to statistics
Inroduction to statisticsAmbarish Bapat
 
Introduction to statistics
Introduction to statisticsIntroduction to statistics
Introduction to statisticsdvy92010
 
Introduction to statistics
Introduction to statisticsIntroduction to statistics
Introduction to statisticsakbhanj
 
Introduction statistical techinique in business and eonomics by douglas a lind
Introduction statistical techinique in business and eonomics by douglas a lindIntroduction statistical techinique in business and eonomics by douglas a lind
Introduction statistical techinique in business and eonomics by douglas a lindRubel Islam
 
Fundamentals of statistics
Fundamentals of statistics   Fundamentals of statistics
Fundamentals of statistics VNRacademy
 

Similar a Introduction to Business Statistics (20)

S4 pn
S4 pnS4 pn
S4 pn
 
probability and statistics-4.pdf
probability and statistics-4.pdfprobability and statistics-4.pdf
probability and statistics-4.pdf
 
Statistics.pptx
Statistics.pptxStatistics.pptx
Statistics.pptx
 
Bahir dar institute of technology.pdf
Bahir dar institute of technology.pdfBahir dar institute of technology.pdf
Bahir dar institute of technology.pdf
 
Lecture 1 PPT.ppt
Lecture 1 PPT.pptLecture 1 PPT.ppt
Lecture 1 PPT.ppt
 
Lecture 1 PPT.pdf
Lecture 1 PPT.pdfLecture 1 PPT.pdf
Lecture 1 PPT.pdf
 
Stats notes
Stats notesStats notes
Stats notes
 
Introduction of Statistics
Introduction of StatisticsIntroduction of Statistics
Introduction of Statistics
 
Statistics / Quantitative Techniques Study Material
Statistics / Quantitative Techniques Study MaterialStatistics / Quantitative Techniques Study Material
Statistics / Quantitative Techniques Study Material
 
BBA 2ND SEM STATISTIC.pdf
BBA 2ND SEM STATISTIC.pdfBBA 2ND SEM STATISTIC.pdf
BBA 2ND SEM STATISTIC.pdf
 
Statistical analysis and Statistical process in 2023 .pptx
Statistical analysis and Statistical process in 2023 .pptxStatistical analysis and Statistical process in 2023 .pptx
Statistical analysis and Statistical process in 2023 .pptx
 
Statistics assignment
Statistics assignmentStatistics assignment
Statistics assignment
 
Meaning and uses of statistics
Meaning and uses of statisticsMeaning and uses of statistics
Meaning and uses of statistics
 
Inroduction to statistics
Inroduction to statisticsInroduction to statistics
Inroduction to statistics
 
Introduction to statistics
Introduction to statisticsIntroduction to statistics
Introduction to statistics
 
Introduction to statistics
Introduction to statisticsIntroduction to statistics
Introduction to statistics
 
Basic stat
Basic statBasic stat
Basic stat
 
Statistics an introduction (1)
Statistics  an introduction (1)Statistics  an introduction (1)
Statistics an introduction (1)
 
Introduction statistical techinique in business and eonomics by douglas a lind
Introduction statistical techinique in business and eonomics by douglas a lindIntroduction statistical techinique in business and eonomics by douglas a lind
Introduction statistical techinique in business and eonomics by douglas a lind
 
Fundamentals of statistics
Fundamentals of statistics   Fundamentals of statistics
Fundamentals of statistics
 

Último

Call Girls Hebbal Just Call 👗 7737669865 👗 Top Class Call Girl Service Bangalore
Call Girls Hebbal Just Call 👗 7737669865 👗 Top Class Call Girl Service BangaloreCall Girls Hebbal Just Call 👗 7737669865 👗 Top Class Call Girl Service Bangalore
Call Girls Hebbal Just Call 👗 7737669865 👗 Top Class Call Girl Service Bangaloreamitlee9823
 
FULL ENJOY Call Girls In Majnu Ka Tilla, Delhi Contact Us 8377877756
FULL ENJOY Call Girls In Majnu Ka Tilla, Delhi Contact Us 8377877756FULL ENJOY Call Girls In Majnu Ka Tilla, Delhi Contact Us 8377877756
FULL ENJOY Call Girls In Majnu Ka Tilla, Delhi Contact Us 8377877756dollysharma2066
 
Ensure the security of your HCL environment by applying the Zero Trust princi...
Ensure the security of your HCL environment by applying the Zero Trust princi...Ensure the security of your HCL environment by applying the Zero Trust princi...
Ensure the security of your HCL environment by applying the Zero Trust princi...Roland Driesen
 
Boost the utilization of your HCL environment by reevaluating use cases and f...
Boost the utilization of your HCL environment by reevaluating use cases and f...Boost the utilization of your HCL environment by reevaluating use cases and f...
Boost the utilization of your HCL environment by reevaluating use cases and f...Roland Driesen
 
Famous Olympic Siblings from the 21st Century
Famous Olympic Siblings from the 21st CenturyFamous Olympic Siblings from the 21st Century
Famous Olympic Siblings from the 21st Centuryrwgiffor
 
FULL ENJOY Call Girls In Mahipalpur Delhi Contact Us 8377877756
FULL ENJOY Call Girls In Mahipalpur Delhi Contact Us 8377877756FULL ENJOY Call Girls In Mahipalpur Delhi Contact Us 8377877756
FULL ENJOY Call Girls In Mahipalpur Delhi Contact Us 8377877756dollysharma2066
 
Yaroslav Rozhankivskyy: Три складові і три передумови максимальної продуктивн...
Yaroslav Rozhankivskyy: Три складові і три передумови максимальної продуктивн...Yaroslav Rozhankivskyy: Три складові і три передумови максимальної продуктивн...
Yaroslav Rozhankivskyy: Три складові і три передумови максимальної продуктивн...Lviv Startup Club
 
Call Girls In DLf Gurgaon ➥99902@11544 ( Best price)100% Genuine Escort In 24...
Call Girls In DLf Gurgaon ➥99902@11544 ( Best price)100% Genuine Escort In 24...Call Girls In DLf Gurgaon ➥99902@11544 ( Best price)100% Genuine Escort In 24...
Call Girls In DLf Gurgaon ➥99902@11544 ( Best price)100% Genuine Escort In 24...lizamodels9
 
Enhancing and Restoring Safety & Quality Cultures - Dave Litwiller - May 2024...
Enhancing and Restoring Safety & Quality Cultures - Dave Litwiller - May 2024...Enhancing and Restoring Safety & Quality Cultures - Dave Litwiller - May 2024...
Enhancing and Restoring Safety & Quality Cultures - Dave Litwiller - May 2024...Dave Litwiller
 
Call Girls Pune Just Call 9907093804 Top Class Call Girl Service Available
Call Girls Pune Just Call 9907093804 Top Class Call Girl Service AvailableCall Girls Pune Just Call 9907093804 Top Class Call Girl Service Available
Call Girls Pune Just Call 9907093804 Top Class Call Girl Service AvailableDipal Arora
 
Grateful 7 speech thanking everyone that has helped.pdf
Grateful 7 speech thanking everyone that has helped.pdfGrateful 7 speech thanking everyone that has helped.pdf
Grateful 7 speech thanking everyone that has helped.pdfPaul Menig
 
0183760ssssssssssssssssssssssssssss00101011 (27).pdf
0183760ssssssssssssssssssssssssssss00101011 (27).pdf0183760ssssssssssssssssssssssssssss00101011 (27).pdf
0183760ssssssssssssssssssssssssssss00101011 (27).pdfRenandantas16
 
Regression analysis: Simple Linear Regression Multiple Linear Regression
Regression analysis:  Simple Linear Regression Multiple Linear RegressionRegression analysis:  Simple Linear Regression Multiple Linear Regression
Regression analysis: Simple Linear Regression Multiple Linear RegressionRavindra Nath Shukla
 
Call Girls Jp Nagar Just Call 👗 7737669865 👗 Top Class Call Girl Service Bang...
Call Girls Jp Nagar Just Call 👗 7737669865 👗 Top Class Call Girl Service Bang...Call Girls Jp Nagar Just Call 👗 7737669865 👗 Top Class Call Girl Service Bang...
Call Girls Jp Nagar Just Call 👗 7737669865 👗 Top Class Call Girl Service Bang...amitlee9823
 
RSA Conference Exhibitor List 2024 - Exhibitors Data
RSA Conference Exhibitor List 2024 - Exhibitors DataRSA Conference Exhibitor List 2024 - Exhibitors Data
RSA Conference Exhibitor List 2024 - Exhibitors DataExhibitors Data
 
B.COM Unit – 4 ( CORPORATE SOCIAL RESPONSIBILITY ( CSR ).pptx
B.COM Unit – 4 ( CORPORATE SOCIAL RESPONSIBILITY ( CSR ).pptxB.COM Unit – 4 ( CORPORATE SOCIAL RESPONSIBILITY ( CSR ).pptx
B.COM Unit – 4 ( CORPORATE SOCIAL RESPONSIBILITY ( CSR ).pptxpriyanshujha201
 
Pharma Works Profile of Karan Communications
Pharma Works Profile of Karan CommunicationsPharma Works Profile of Karan Communications
Pharma Works Profile of Karan Communicationskarancommunications
 
Lucknow 💋 Escorts in Lucknow - 450+ Call Girl Cash Payment 8923113531 Neha Th...
Lucknow 💋 Escorts in Lucknow - 450+ Call Girl Cash Payment 8923113531 Neha Th...Lucknow 💋 Escorts in Lucknow - 450+ Call Girl Cash Payment 8923113531 Neha Th...
Lucknow 💋 Escorts in Lucknow - 450+ Call Girl Cash Payment 8923113531 Neha Th...anilsa9823
 

Último (20)

Call Girls Hebbal Just Call 👗 7737669865 👗 Top Class Call Girl Service Bangalore
Call Girls Hebbal Just Call 👗 7737669865 👗 Top Class Call Girl Service BangaloreCall Girls Hebbal Just Call 👗 7737669865 👗 Top Class Call Girl Service Bangalore
Call Girls Hebbal Just Call 👗 7737669865 👗 Top Class Call Girl Service Bangalore
 
FULL ENJOY Call Girls In Majnu Ka Tilla, Delhi Contact Us 8377877756
FULL ENJOY Call Girls In Majnu Ka Tilla, Delhi Contact Us 8377877756FULL ENJOY Call Girls In Majnu Ka Tilla, Delhi Contact Us 8377877756
FULL ENJOY Call Girls In Majnu Ka Tilla, Delhi Contact Us 8377877756
 
Ensure the security of your HCL environment by applying the Zero Trust princi...
Ensure the security of your HCL environment by applying the Zero Trust princi...Ensure the security of your HCL environment by applying the Zero Trust princi...
Ensure the security of your HCL environment by applying the Zero Trust princi...
 
Boost the utilization of your HCL environment by reevaluating use cases and f...
Boost the utilization of your HCL environment by reevaluating use cases and f...Boost the utilization of your HCL environment by reevaluating use cases and f...
Boost the utilization of your HCL environment by reevaluating use cases and f...
 
Famous Olympic Siblings from the 21st Century
Famous Olympic Siblings from the 21st CenturyFamous Olympic Siblings from the 21st Century
Famous Olympic Siblings from the 21st Century
 
FULL ENJOY Call Girls In Mahipalpur Delhi Contact Us 8377877756
FULL ENJOY Call Girls In Mahipalpur Delhi Contact Us 8377877756FULL ENJOY Call Girls In Mahipalpur Delhi Contact Us 8377877756
FULL ENJOY Call Girls In Mahipalpur Delhi Contact Us 8377877756
 
Yaroslav Rozhankivskyy: Три складові і три передумови максимальної продуктивн...
Yaroslav Rozhankivskyy: Три складові і три передумови максимальної продуктивн...Yaroslav Rozhankivskyy: Три складові і три передумови максимальної продуктивн...
Yaroslav Rozhankivskyy: Три складові і три передумови максимальної продуктивн...
 
Call Girls In DLf Gurgaon ➥99902@11544 ( Best price)100% Genuine Escort In 24...
Call Girls In DLf Gurgaon ➥99902@11544 ( Best price)100% Genuine Escort In 24...Call Girls In DLf Gurgaon ➥99902@11544 ( Best price)100% Genuine Escort In 24...
Call Girls In DLf Gurgaon ➥99902@11544 ( Best price)100% Genuine Escort In 24...
 
Enhancing and Restoring Safety & Quality Cultures - Dave Litwiller - May 2024...
Enhancing and Restoring Safety & Quality Cultures - Dave Litwiller - May 2024...Enhancing and Restoring Safety & Quality Cultures - Dave Litwiller - May 2024...
Enhancing and Restoring Safety & Quality Cultures - Dave Litwiller - May 2024...
 
Call Girls Pune Just Call 9907093804 Top Class Call Girl Service Available
Call Girls Pune Just Call 9907093804 Top Class Call Girl Service AvailableCall Girls Pune Just Call 9907093804 Top Class Call Girl Service Available
Call Girls Pune Just Call 9907093804 Top Class Call Girl Service Available
 
Grateful 7 speech thanking everyone that has helped.pdf
Grateful 7 speech thanking everyone that has helped.pdfGrateful 7 speech thanking everyone that has helped.pdf
Grateful 7 speech thanking everyone that has helped.pdf
 
0183760ssssssssssssssssssssssssssss00101011 (27).pdf
0183760ssssssssssssssssssssssssssss00101011 (27).pdf0183760ssssssssssssssssssssssssssss00101011 (27).pdf
0183760ssssssssssssssssssssssssssss00101011 (27).pdf
 
Regression analysis: Simple Linear Regression Multiple Linear Regression
Regression analysis:  Simple Linear Regression Multiple Linear RegressionRegression analysis:  Simple Linear Regression Multiple Linear Regression
Regression analysis: Simple Linear Regression Multiple Linear Regression
 
Call Girls Jp Nagar Just Call 👗 7737669865 👗 Top Class Call Girl Service Bang...
Call Girls Jp Nagar Just Call 👗 7737669865 👗 Top Class Call Girl Service Bang...Call Girls Jp Nagar Just Call 👗 7737669865 👗 Top Class Call Girl Service Bang...
Call Girls Jp Nagar Just Call 👗 7737669865 👗 Top Class Call Girl Service Bang...
 
RSA Conference Exhibitor List 2024 - Exhibitors Data
RSA Conference Exhibitor List 2024 - Exhibitors DataRSA Conference Exhibitor List 2024 - Exhibitors Data
RSA Conference Exhibitor List 2024 - Exhibitors Data
 
B.COM Unit – 4 ( CORPORATE SOCIAL RESPONSIBILITY ( CSR ).pptx
B.COM Unit – 4 ( CORPORATE SOCIAL RESPONSIBILITY ( CSR ).pptxB.COM Unit – 4 ( CORPORATE SOCIAL RESPONSIBILITY ( CSR ).pptx
B.COM Unit – 4 ( CORPORATE SOCIAL RESPONSIBILITY ( CSR ).pptx
 
Forklift Operations: Safety through Cartoons
Forklift Operations: Safety through CartoonsForklift Operations: Safety through Cartoons
Forklift Operations: Safety through Cartoons
 
Mifty kit IN Salmiya (+918133066128) Abortion pills IN Salmiyah Cytotec pills
Mifty kit IN Salmiya (+918133066128) Abortion pills IN Salmiyah Cytotec pillsMifty kit IN Salmiya (+918133066128) Abortion pills IN Salmiyah Cytotec pills
Mifty kit IN Salmiya (+918133066128) Abortion pills IN Salmiyah Cytotec pills
 
Pharma Works Profile of Karan Communications
Pharma Works Profile of Karan CommunicationsPharma Works Profile of Karan Communications
Pharma Works Profile of Karan Communications
 
Lucknow 💋 Escorts in Lucknow - 450+ Call Girl Cash Payment 8923113531 Neha Th...
Lucknow 💋 Escorts in Lucknow - 450+ Call Girl Cash Payment 8923113531 Neha Th...Lucknow 💋 Escorts in Lucknow - 450+ Call Girl Cash Payment 8923113531 Neha Th...
Lucknow 💋 Escorts in Lucknow - 450+ Call Girl Cash Payment 8923113531 Neha Th...
 

Introduction to Business Statistics

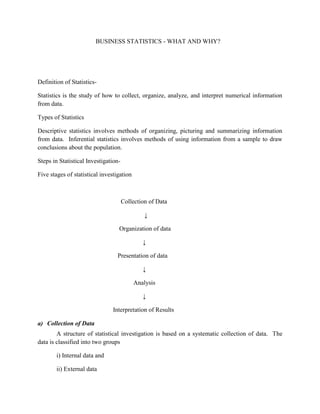
  • 1. BUSINESS STATISTICS - WHAT AND WHY? Definition of Statistics- Statistics is the study of how to collect, organize, analyze, and interpret numerical information from data. Types of Statistics Descriptive statistics involves methods of organizing, picturing and summarizing information from data. Inferential statistics involves methods of using information from a sample to draw conclusions about the population. Steps in Statistical Investigation- Five stages of statistical investigation Collection of Data ↓ Organization of data ↓ Presentation of data ↓ Analysis ↓ Interpretation of Results a) Collection of Data A structure of statistical investigation is based on a systematic collection of data. The data is classified into two groups i) Internal data and ii) External data
  • 2. Internal data are obtained from internal records related to operations of business organisation such as production, source of income and expenditure, inventory, purchases and accounts. The external data are collected and purchased by external agencies. The external data could be either primary data or secondary data. The primary data are collected for first time and original, while secondary data are collected by published by some agencies. b) Organisations of data The collected data is a large mass of figures that needs to be organised. The collected data must be edited to rectify for any omissions, irrelevant answers, and wrong computations. The edited data must be classified and tabulated to suit further analysis. c) Presentation of data The large data that are collected cannot be understand and analysis easily and quickly. Therefore, collected data needs to be presented in tabular or graphic form. This systematic order and graphical presentation helps for further analysis. d) Analysis of data The analysis requires establishing the relationship between one or more variables. Analysis of data includes condensation, abstracting, summarization, conclusion etc. With the help of statistical tools and techniques like measures of dispersion central tendency, correlation, variance analysis etc analysis can be done. e) Interpretation of data The interpretation requires deep insight of the subject. Interpretation involves drawing the valid conclusions on the bases of the analysis of data. This work requires good experience and skill. This process is very important as conclusions of results are done based on interpretation. FUNCTIONS OF STATISTICS Statistics as a discipline is considered indispensable in almost all spheres of human knowledge. There is hardly any branch of study which does not use statistics. Scientific, social and economic studies use statistics in one form or another. These disciplines make-use of observations, facts and figures, enquiries and experiments etc. using statistics and statistical methods. Statistics studies almost all aspects in an enquiry. It mainly aims at simplifying the complexity of information collected in an enquiry. It presents data in a simplified form as to make them intelligible. It analyses data and facilitates drawal of conclusions. Now let us briefly discuss some of the important functions of statistics.
  • 3. 1. Presents facts in. simple form: Statistics presents facts and figures in a definite form. That makes the statement logical and convincing than mere description. It condenses the whole mass of figures into a single figure. This makes the problem intelligible. 2. Reduces the Complexity of data: Statistics simplifies the complexity of data. The raw data are unintelligible. We make them simple and intelligible by using different statistical measures. Some such commonly used measures are graphs, averages, dispersions, skewness, kurtosis, correlation and regression etc. These measures help in interpretation and drawing inferences. Therefore, statistics enables to enlarge the horizon of one's knowledge. 3. Facilitates comparison: Comparison between different sets of observation is an important function of statistics. Comparison is necessary to draw conclusions as Professor Boddington rightly points out.” the object of statistics is to enable comparison between past and present results to ascertain the reasons for changes, which have taken place and the effect of such changes in future. So to determine the efficiency of any measure comparison is necessary. Statistical devices like averages, ratios, coefficients etc. are used for the purpose of comparison. 4. Testing hypothesis: Formulating and testing of hypothesis is an important function of statistics. This helps in developing new theories. So statistics examines the truth and helps in innovating new ideas. 5. Formulation of Policies : Statistics helps in formulating plans and policies in different fields. Statistical analysis of data forms the beginning of policy formulations. Hence, statistics is essential for planners, economists, scientists and administrators to prepare different plans and programmes. 6. Forecasting : The future is uncertain. Statistics helps in forecasting the trend and tendencies. Statistical techniques are used for predicting the future values of a variable. For example a producer forecasts his future production on the basis of the present demand conditions and his past experiences. Similarly, the planners can forecast the future population etc. considering the present population trends. 7. Derives valid inferences :
  • 4. Statistical methods mainly aim at deriving inferences from an enquiry. Statistical techniques are often used by scholars planners and scientists to evaluate different projects. These techniques are also used to draw inferences regarding population parameters on the basis of sample information. Limitations of statistics: Statistics with all its wide application in every sphere of human activity has its own limitations. Some of them are given below. 1. Statistics is not suitable to the study of qualitative phenomenon: Since statistics is basically a science and deals with a set of numerical data, it is applicable to the study of only these subjects of enquiry, which can be expressed in terms of quantitative measurements. As a matter of fact, qualitative phenomenon like honesty, poverty, beauty,intelligence etc, cannot be expressed numerically and any statistical analysis cannot be directly applied on these qualitative phenomenons. Nevertheless, statistical techniques may be applied indirectly by first reducing the qualitative expressions to accurate quantitative terms. For example, the intelligence of a group of students can be studied on the basis of their marks in a particular examination. 2. Statistics does not study individuals: Statistics does not give any specific importance to the individual items, in fact it deals with an aggregate of objects. Individual items, when they are taken individually do not constitute any statistical data and do not serve any purpose for any statistical enquiry. 3. Statistical laws are not exact: It is well known that mathematical and physical sciences are exact. But statistical laws are not exact and statistical laws are only approximations. Statistical conclusions are not universally true. They are true only on an average. 4. Statistics table may be misused: Statistics must be used only by experts; otherwise, statistical methods are the most dangerous tools on the hands of the inexpert. The use of statistical tools by the inexperienced and untraced persons might lead to wrong conclusions. Statistics can be easily misused by quoting wrong figures of data. As King says9aptly ‘ statistics are like clay of which one can make a God or Devil as one pleases’ . 5. Statistics is only, one of the methods of studying a problem: Statistical method do not provide complete solution of the problems because problems are to be studied taking the background of the countries culture, philosophy or religion into consideration. Thus the statistical study should be supplemented by other evidences. Statistics can analyze only aggregated observation or data: Any statistics is a collection of data.Individual observation does not belong to statisticshence, statistics analyses a collection of data andenlighten the overall estimated result. For-example the average income of the laborers of abusiness can be estimated by observing their percapital
  • 5. income. Average income does notparticularize anybody or neglect anybodiesincome. In this respect, statistics gives an over allidea. •Statistics describes only numeral information: Statistics is anexposure of the numerical data .If it is not possibleto express in a, statistics fail to make acomparative study between rich and poor, soundand ill etc . •Statistics given only overall measures: statics gives us only anaverage or overall estimation. It is almostimpossible to achieve a particular result. After aprolonged observation as it is found in otherbranches of knowledge. As the data are influencedby different factors, the some result is notavailable every time. •Statistics rules are mutable: In some brunches of science some unchangeableprinciples and data are available .but in statisticsthey are not found. The principles of statistics arevariable and changeable, approximate etc. •Statistics is simply amethod: The practical solution of anyproblem can be done in many ways. Statistics isone of the methods of solving the problem. Itsevidences give the ideas of any matterbeforehand. Its evidences are to be relativelysupported by other observation or data. •Statistics incapable indecision making: It is not alwayspossible for statistics to take proper decision.proper decision always depends on proper data.But the data is statistics are often collected byunskilled persons. •Statistics cannot expressthe entire data set: Statisticsmethod dose not express the topic or incidentfully. It simplifies the complicated data andpresents them. •Using inappropriateinformation: Unskilled, idle andinexperienced person often collect data. As aresult, erroneous, puzzling and partial informationis collected. As a result, very often improperdecision is taken. •Purposive misuses: The most totallimitation of statistics is that its purposive misuse.Very often erroneous information may becollected. But sometimes some institutions usestatistics for self interest and puzzling otherorganizations.
  • 6. COLLECTION OF DATA Everybody collects, interprets and uses information, much of it in a numerical or statistical forms in day-to-day life. It is a common practice that people receive large quantities of information everyday through conversations, televisions, computers, the radios, newspapers, posters, notices and instructions. It is just because there is so much information available that people need to be able to absorb, select and reject it. In everyday life, in business and industry, certain statistical information is necessary and it is independent to know where to find it how to collect it. As consequences, everybody has to compare prices and quality before making any decision about what goods to buy. As employees of any firm, people want to compare their salaries and working conditions, promotion opportunities and so on. In time the firms on their part want to control costs and expand their profits. One of the main functions of statistics is to provide information which will help on making decisions. Statistics provides the type of information by providing a description of the present, a profile of the past and an estimate of the future. The following are some of the objectives of collecting statistical information. 1. To describe the methods of collecting primary statistical information. 2. To consider the status involved in carrying out a survey. 3. To analyse the process involved in observation and interpreting. 4. To define and describe sampling. 5. To analyse the basis of sampling. 6. To describe a variety of sampling methods. Categories of data: Any statistical data can be classified under two categories depending upon the sources utilized.These categories are, 1. Primary data 2. Se condary data Statistical Data
  • 7. Statistical investigation is a long and comprehensive process and requires systematic collection of data in large size. The validity and accuracy of the conclusion or results of the study depends upon how well the data were gathered. The quality of data will greatly influence the conclusions of the study and hence importance is to be given to the data collection process. Statistical data may be classified as Primary Data and Secondary Data based on the sources of data collection. Primary data Primary data are those which are collected for the first time by the investigator / researchers and are thus original in character. Thus, data collected by investigator may be for the specific purpose / study at hand. Primary data are usually in the shape of raw materials to which statistical methods are applied for the purpose of analysis and interpretation. Secondary data Secondary have been already collected for the purpose other than the problem at hand. These data are those which have already been collected by some other persons and which have passed through the statistical analysis at least once. Secondary data are usually in the shape of finished products since they have been already treated statistically in one or the other form. After statistical treatment the primary data lose their original shape and becomes secondary data. Secondary data of one organisation become the primary data of other organisation who first collect and publish them. Primary Vs Secondary Data  Researcher originates primary data for specific purpose / study at hand while secondary data have already been collected for purpose other than research work at hand.  Primary data collection requires considerably more time, relatively expensive. While the secondary data are easily accessible, inexpensive and quickly obtained. Table – A compression of Primary and Secondary Data Primary data Secondary data
  • 8. Collection purpose For the problem at hand For other problems Collection process Very involved Rapid and easy Collection cost High Relatively low Collection time Long Short Suitability Its suitability is positive It may or may not suit the object of survey Originality It is original It is not original Precautions No extra precautions It should be used with required to use the data extra case Limitations of secondary data a) Since secondary data is collected for ‘some other purpose, its usefulness to current problem may be limited in several important ways, including relevancies and accuracy. b) The objectives, nature and methods used to collect secondary data may not be appropriate to present situation. c) The secondary data may not be accurate, or they may not be completely current or dependable. Criteria for evaluating secondary data Before using the secondary data it is important to evaluate them on following factors a) Specification and methodology used to collect the data b) Error and accuracy of data. c) The currency d) The objective – The purpose for which data were collected e) The nature – content of data f) The dependability Sources of data Primary source – The methods of collecting primary data.
  • 9. When data is neither internally available nor exists as a secondary source, then the primary sources of data would be approximate. The various method of collection of primary data are as follows a) Direct personal investigation - Interview - Observation b) Indirect or oral investigation c) Information from local agents and correspondents d) Mailed questionnaires and schedules e) Through enumerations Secondary source – The methods of collecting secondary data i) Published Statistics a) Official publications of Central Government Ex: Central Statistical Organisation (CSO) – Ministry of planning - National Sample Survey Organisation (NSSO) - Office of the Registrar General and Census Committee – GOI - Director of Statistics and Economics – Ministry of Agriculture - Labour Bureau – Ministry of Labour etc. ii) Publications of Semi-government organisation Ex: - The institute of foreign trade, New Delhi - The institute of economic growth, New Delhi. iii) Publication of research institutes Ex: - Indian Statistical Institute - Indian Agriculture Statistical Institute - NCRET Publications - Indian Standards Institute etc. iv) Publication of Business and Financial Institutions Ex:
  • 10. - Trade Association Publications like Sugar factory, Textile mill, Indian chamber of Industry and Commerce. - Stock exchange reports, Co-operative society reports etc. v) News papers and periodicals Ex: - The Financial Express, Eastern Economics, Economic Times, Indian Finance, etc. vi) Reports of various committees and commissions Ex: - Kothari commission report on education - Pay commission reports - Land perform committee reports etc. vii) Unpublished statistics - Internal and administrative data like Periodical Loss, Profit, Sales, Production Rate, Balance Sheet, Labour Turnover, Budges, etc. Primary data: Primary data is the one, which is collected by the investigator himself for the purpose of a specific inquiry or study. Such data is original in character and is generated by survey conducted by individuals or research institution or any organisation. The primary data can be collected by the following five methods. 1. Direct personal interviews. 2. Indirect Oral interviews. 3. Information from correspondents. 4. Mailed questionnaire method. 5. Schedules sent through enumerators 1. Direct personal interviews: The persons from whom informations are collected are known as informants. The investigator personally meets them and asks questions to gather the necessary informations. It is the suitable method for intensive rather than extensive field surveys. It suits best for intensive study of the limited field.
  • 11. 2. Indirect Oral Interviews: Under this method the investigator contacts witnesses or neighbours or friends or some other third parties who are capable of supplying the necessary information. This method is preferred if the required information is on addiction or cause of fire or theft or murder etc., If a fire has broken out a certain place, the persons living in neighbourhood and witnesses are likely to give information on the cause of fire. In some cases, police interrogated third parties who are supposed to have knowledge of a theft or a murder and get some clues. Enquiry committees appointed by governments generally adopt this method and get people’ s views and all possible details of facts relating to the enquiry. This method is suitable whenever direct sources do not exists or cannot be relied upon or would be unwilling to part with the information. 3. Information from correspondents: The investigator appoints local agents or correspondents in different places and compiles the information sent by them. Informations to Newspapers and some departments of Government come by this method. The advantage of this method is that it is cheap and appropriate for extensive investigations. But it may not ensure accurate results because the correspondents are likely to be negligent, prejudiced and biased. This method is adopted in those cases where informations are to be collected periodically from a wide area for a long time. 4. Mailed questionnaire method: Under this method a list of questions is prepared and is sent to all the informants by post. The list of questions is technically called questionnaire. A covering letter accompanying the questionnaire explains the purpose of the investigation and the importance of correct informations and request the informants to fill in the blank spaces provided and to return the form within a specified time. This method is appropriate in those cases where the informants are literates and are spread over a wide area. 5. Schedules sent through Enumerators: Under this method enumerators or interviewers take the schedules, meet the informants and filling their replies. Often distinction is made between the schedule and a questionnaire. A schedule is filled by the interviewers in a face-to-face situation with the informant. A questionnaire is filled by the informant which he receives and returns by post. It is suitable for extensive surveys. Secondary Data: Secondary data are those data which have been already collected and analysed by some earlier agency for its own use; and later the same data are used by a different agency.
  • 12. According to W.A.Neiswanger, ‘ A primary source is a publication in which the data are published by the same authority which gathered and analysed them. A secondary source is a publication, reporting the data which have been gathered by other authorities and for which others are responsible’ . Sources of Secondary data: In most of the studies the investigator finds it impracticable to collect first-hand information on all related issues and as such he makes use of the data collected by others. There is a vast amount of published information from which statistical studies may be made and fresh statistics are constantly in a state of production. The sources of secondary data can broadly be classified under two heads: 1. Published sources, and 2. Unpublished sources. 1. Published Sources: The various sources of published data are: 1. Reports and official publications of (i) International bodies such as the International Monetary Fund, International Finance Corporation and United Nations Organisation. (ii) Central and State Governments such as the Report of the Tandon Committee and Pay Commission. 2. Semi-official publication of various local bodies such as Municipal Corporations and District Boards. 3. Private publications-such as the publications of – (i) Trade and professional bodies such as the Federation ofIndian Chambers of Commerce and Institute of Chartered Accountants. (ii) Financial and economic journals such as ‘ Commerce’ , ‘ Capital’ and ‘ Indian Finance’ . (iii) Annual reports of joint stock companies. (iv) Publications brought out by research agencies, research scholars, etc. 2. Unpublished Sources
  • 13. All statistical material is not always published. There are various sources of unpublished data such as records maintained by various Government and private offices, studies made by research institutions, scholars, etc. Such sources can also be used where necessary Precautions in the use of Secondary data The following are some of the points that are to be considered in the use of secondary data 1. How the data has been collected and processed 2. The accuracy of the data 3. How far the data has been summarized 4. How comparable the data is with other tabulations 5. How to interpret the data, especially when figures collected for one purpose is used for another Generally speaking, with secondary data, people have to compromise between what they want and what they are able to find. Merits and Demerits of Secondary Data: 1. Secondary data is cheap to obtain. Many government publications are relatively cheap and libraries stock quantities of secondary data produced by the government, by companies and other organisations. 2. Large quantities of secondary data can be got through internet. 3. Much of the secondary data available has been collected for many years and therefore it can be used to plot trends. 4. Secondary data is of value to: - The government – help in making decisions and planning future policy. - Business and industry – in areas such as marketing, and sales in order to appreciate the general economic and social conditions and to provide information on competitors. - Research organisations – by providing social,economical and industrial information.