SlideShare una empresa de Scribd logo
1 de 28
Descargar para leer sin conexión
US. Patent
105
Q QQ
Q Q01
QNin
Q(10Q
Q(A)(Ti
QQQ
QQin
Apr. 1, 2014 Sheet 1 0f 11
Store Revenue Data
V
Access Revenue Data
V
Provide User Interface
V
Receive Selection of Product
Line
Identify Revenue Transactions
V
identify Customers
V
Analyze Customers
V
Receive Selection of
Characteristic
V
Segment Set of Customers
V
Display information
FIG. 1
US 8,688,502 B2
K100
US. Patent Apr. 1, 2014 Sheet 2 0f 11 US 8,688,502 B2
Assign Ranks to Customers
205
V
Define Segmentation Scheme
210
V
Calculate Attributable Revenue
215
V
Display Attributable Revenue
220
 200
FIG. 2
US. Patent Apr. 1, 2014 Sheet 3 0f 11 US 8,688,502 B2
Identify Pluratity of Product Lines
305
V
Assign Ranks to Product Lines
310
V
Display Information about
Product Lines
315
K 300
FIG. 3
US. Patent Apr. 1, 2014 Sheet 4 0f 11 US 8,688,502 B2
Store Revenue Data
405
V
Access Revenue Data
410
V
Provide User Interface
415
V
Receive User Input
420
V
Define Geographical Hierarchy
425
V
Categorize Data
430
V
Translate Dimension(s)
435
V
Analyze Data
440
V
Define Ranking Scheme
445
V
Define Coloration Scheme
450
V
Generate Map Display
455
K 400FIG. 4
US. Patent Apr. 1, 2014 Sheet 5 0f 11 US 8,688,502 B2
Access Data
505
V
Categorize Data
510
V
Receive User Input
V
Analyze Data
520
V
Define Ranking Scheme
525
V
Define Colorization Scheme
530
V
Correlate with Revenue Data
535
V
Display Correlated Data
540
K 500FIG. 5
US 8,688,502 B2Sheet 7 0f 11Apr. 1, 2014US. Patent
..OE
88/
88.88.8888.88.88;88.8.8888.8?8888...88.88.88.838.288588.8888886.38888.808.888888.88.8829.6__<88.8.188.88.8@8888@88888.8.88.883588..882m.-.N.1
88:88$888.8.@8888@881288.888888.87/08891-8.1/},8188.888888.8.8888.88888.888.8.8838.8.0891-N.1$888.8888.88.8888.08.02888.28.888588.8.885-v.1.33881.3%.881.81881.81881.80%.881.518...:...<QB
QEK
mQN
E82838888838.83
88888885288222.0__<
88.8...8m8.8888-.0821-.N.1
E882Ewt8@870882m.-8.EA
8285Q88:NE88.0891-N.1
8888.88Q888w..0821-F.1
.33881.3%.881.81881.81881.31881.518...=...<QB
US 8,688,502 B2Sheet 8 0f 11Apr. 1, 2014US. Patent
cow
1wow
w.GE
mooodoow
comcom
cow
DHODUOHQo625E
UwEEszwéozwloEwQEoo
IQmEanu$053500
33vw=9w59653800E20w$0365
wLmEBwso$053500
US 8,688,502 B2Sheet 9 0f 11Apr. 1, 2014US. Patent
000
j
a.GE
Sm.
2.333
mom
El
QEUE
0ququ
@2652
N818I@8ch5%l@8chIvi:
ommdr
I
MNWE.
1N22
wwwdm
22500
I-:23
H
U
____06:35
“5282:@892“62655:96659m6:56521umcwzd
52:00"coammbzmanmm“Emgmmw5%an
mg
Etmsd=82".
US. Patent Apr. 1, 2014 Sheet 10 0f 11 US 8,688,502 B2
1005
Processor(s) working
K Memory
1010
K Storage Device(s) Ogisr’i?rgg
1025
1040’// ~1>351045
K Input Device(s) K
1015 ' '
Apphcatton(s)
K Output Device(s)
1020
Communications
f Subsystem
1030
f1000 FIG. 10
US. Patent Apr. 1, 2014 Sheet 11 0111 US 8,688,502 B2
User Computer User Computer User Computer
Network
DEIEIII ._||_|u EIEIEIII uu
DDIIIEJ nun uuuu 1:11:11:
1115a DEIEIEI nun EIEIEIEI nun 1115b
DUDE! mum |:||:u:||:1 mum
uncn: nun EIDEIEI nun
DEIDEI nun nucn: nun
01:11:": nun nucn: mum
L__—_-_____J l______.l
Database Database
1120a 1120b
K1100
FIG. 11
US 8,688,502 B2
1
BUSINESS INTELLIGENCE DASHBOARDS
FOR PERFORMANCE ANALYSIS
CROSS-REFERENCES TO RELATED
APPLICATIONS
This application is related to co-pending US. patent appli
cation Ser. No. 12/711,623, ?led Feb. 24, 2010 by Hartley et
al. and entitled “Mapping Data in EnterpriseApplications for
Operational Visibility”, which is hereby incorporated by ref
erence, as ifset forth in full in this document, for all purposes.
COPYRIGHT STATEMENT
A portion of the disclosure of this patent document con
tains material that is subject to copyright protection. The
copyright owner has no objection to the facsimile reproduc
tionby anyone ofthe patent document or the patent disclosure
as it appears in the Patent and Trademark Of?ce patent ?le or
records, but otherwise reserves all copyright rights whatso
ever.
FIELD
The present disclosure relates, in general, to business intel
ligence systems, and more particularly, to tools and tech
niques for displaying revenue data.
BACKGROUND
Commercial enterprises typically seekto improve ?nancial
performance as time goes on. One way to gain insight into
possible performance improvements is by analyzing past per
formance. Business intelligence systems can facilitate this
process by synthesizing mountains of data (such as revenue
data, cost data, and the like) to allow enterprises to see pat
terns and gain insights that are not readily apparent from the
raw data (often because ofthe sheer volume ofthe data to be
analyzed).
Inparticular, data on revenue from sales ofproducts (which
can include any of a variety of difference goods and/or ser
vices) can be used to drive decisions on which products
should be emphasized in marketing campaigns, which prod
ucts should be developed further, and/or which products
should be dropped from an enterprise’s product line alto
gether, to name a few examples. More speci?cally, past rev
enue data can provide insight into products that might have a
symbiotic relationship (such that they should be marketed
together and/or to the same potential customers), as well as
insight into geographical trends (which can inform decisions
about deployment of sales force resources, marketing
resources, and/or the like).
Similarly, an enterprise often will engage in a merger or
acquisition ofanother enterprise with a goal ofintegrating the
product lines ofthe two enterprises; it is often hoped that this
integration will result in a symbiotic relationship between the
respective product lines. Merely by way of example, a cor
poration selling a primary product might acquire another
corporation selling a complementary product withthe goal of
expanding the market of the complementary product and/or
with the hope that sales of the complementary product will
drive further sales of the primary product. To evaluate the
ef?cacy of such an acquisition retrospectively (and, corre
spondingly, to learn from that experience in order to inform
future acquisition strategies), it would be helpful to be able to
analyze the revenue performance of the primary and/or
complementary product. Ideally, such analysis could be nor
20
25
30
35
40
45
50
55
60
65
2
malized (to account for other product lines which might also
affect revenue performance, etc.).
There are, however, obstacles to the use ofrevenue data in
this fashion. The ?rst obstacle is in identifying patterns in the
data. In the past, identi?cation of such patterns has been a
difficult and labor-intensiveprocess, requiring personnel with
both the data processing expertise to manipulate the data and
the business expertise to understand how the data should be
manipulated and/or understood. Business intelligence sys
tems have remedied this problem somewhat, but the use of
such systems typically still requires signi?cant data process
ing expertise, often placing them out ofreach ofthe business
people who can understand the meaning of identi?ed trends
and make business decisions thereupon.
Another obstacle to the employment of revenue data for
decision support purposes is that, even if the data can be
analyzed and trends identi?ed, it is difficult to convey these
trends in a meaningful manner. Research shows that most
humans intuitively can grasp information more readily which
it is provided in a graphical format than when the information
is provided numerically or textually. In some cases, the
graphical presentation of data is a trivial matterifor
example, a chronological series of numbers can easily be
displayed as a line plot or a bar chart, with the horizontal axis
representing a time scale. But when such data is multidimen
sional, it becomes more dif?cult to convey that data graphi
cally in a meaningful way.
This problem is especially true when the display ofthe data
is meant to provide geographical insight. For example, while
applications such as Google EarthTM can be used to map
relatively simple, one dimensional data onto a geographical
display (such as a worldmap), this taskbecomes signi?cantly
more complex when the data has no explicit geographical
dimension, or when attempting to map multiple data sets with
disparate geographical dimensions.
Hence, there is a need for improved tools and techniques
for analyzing data (in particular revenue data), and providing
the results of that analysis in a meaningful way.
BRIEF SUMMARY
A set of embodiments provides tools and techniques for
providing decision support to enterprises. Certain of these
tools analyze and/or display information, including, in a par
ticular aspect, revenue and/or other ?nancial information, in
novel ways. These features can provide users with enhanced
insight into the performance ofvarious product lines and/or
into opportunities to enhance such performance, including
(but not limited to) insight into the performance of two or
more product lines in conjunction with one another. In
another aspect, certain tools provide heretofore unavailable
facilities for evaluating the success of an acquisition, for
example, by providing insight into the market compatibility
of an acquired product line with an existing product line.
Yet other embodiments provide tools and techniques for
generating map displays to graphically illustrate ?nancial
performance. In one aspect, a map display might employ a
coloration scheme that distinguishes among various ranked
regions to illustrate, for example, revenue performance
(which can be measured by any of a number of metrics), to
allow a userto quickly understand the relative performance of
a product line across a number of regions. In another aspect,
a map display might correlate a ?rst set of revenue informa
tion (or other ?nancial information) with other data sets, such
as sales force data, competitive sales data, and/or the like, to
allow a user to quickly identify correlative patterns in the two
data sets. Such map displays might feature two maps side
US 8,688,502 B2
3
by-side, or might superimpose a map of one data set over a
map ofanother data set, to assist in the user’s visual analysis.
The tools provided by various embodiments include, with
out limitation, methods, systems, and/or software products.
Merely by way of example, a method might comprise one or
more procedures, any or all ofwhich are executed by a com
puter system. Correspondingly, an embodiment might pro
vide a computer system con?gured with instructions to per
form one or more procedures in accordance with methods
provided by various other embodiments. Similarly, a com
puter program might comprise a set of instructions that are
executable by a computer system (and/or a processor therein)
to perform such operations. In many cases, such software
programs are encoded on physical and/or tangible computer
readable media (such as, to name but a few examples, optical
media, magnetic media, and/or the like).
Merely by way of example, a method in accordance with
one set of embodiments comprises accessing revenue data,
stored in a database, about a plurality ofrevenue transactions.
In one aspect ofcertain embodiments, the revenue data might
be created by an enterprise application, and/or the revenue
data about each revenue transaction might identify an amount
ofrevenue generated by a sale of one or more products by an
enterprise. The method might further comprise providing a
user interface for a user to interact with a data presentation
system in communication with the database. In some cases,
the method also comprises de?ning a geographical hierarchy
for the revenue data, which might de?ne a plurality ofregions
organizedhierarchically, and/or categorizing the revenue data
according to the geographical hierarchy.
In some embodiments, the method further comprises de?n
ing a ranking scheme for the revenue data; in an aspect, the
ranking scheme might comprise a plurality ofthresholds for
segmenting the plurality of regions into a plurality of ranks,
according to a revenue characteristic for each region. The
method might further comprise de?ning a coloration scheme
for the revenue data. The coloration scheme, in an aspect,
de?nes a coloration pattern corresponding to each of the
plurality of ranks. The method, then, may further include
generating a map display in the user interface. In an aspect,
the map display shows at least a subset of the plurality of
regions de?ned by the geographical hierarchy for the revenue
data, and each displayed region might a rank de?ned by the
ranking scheme and a corresponding coloration pattern
de?ned by the coloration scheme.
A method in accordance with another set of embodiments
comprises accessing revenue data, stored in a database, about
a plurality ofrevenue transactions, providing a user interface
for a user to interact with a data presentation system in com
munication with the database, and receiving, via the user
interface, selection ofa product line for analysis. The method
might further comprise identifying a set of revenue transac
tions corresponding to the selected product line, each of the
revenue transactions in the set ofrevenue transactions having
an associated customer, and/or identifying a set of customers
associated with the set of revenue transactions.
In some embodiments, the method further comprises ana
lyzing each ofthe customers inthe set ofcustomers to identify
an amount ofrevenue attributable to each customer, receiving
a selection of a revenue characteristic of interest, and/or seg
menting the set of customers into a plurality of subsets of
customers, according to the selected customer characteristic
ofinterest. The method might further comprise displaying, in
the user interface, revenue information about at least one of
the subsets of customers.
Another set ofembodiments provides computer systems. A
computer system in accordance with one embodiment com
20
25
30
35
40
45
50
55
60
65
4
prises one or more processors, along with a computer read
able medium in communication with the one or more proces
sors. The computer readable medium might have encoded
thereon a set of instructions executable by the computer sys
tem to perform one ormore operations. The set ofinstructions
might include instructions to perform operations in accor
dance with the methods described above. Similarly, an appa
ratus might comprise a computer readable medium having
encoded thereon a set of instructions executable by one or
more computers to perform one ormore operations, including
without limitation operations in accordance with the methods
above.
BRIEF DESCRIPTION OF THE DRAWINGS
A further understanding of the nature and advantages of
particular embodiments may be realized by reference to the
remaining portions of the speci?cation and the drawings, in
which like reference numerals are used to refer to similar
components. In some instances, a sub-label is associated with
a reference numeral to denote one of multiple similar com
ponents. When reference is made to a reference numeral
without speci?cation to an existing sub-label, it is intended to
refer to all such multiple similar components.
FIGS. 1-3 are process ?ow diagrams illustrating various
methods ofanalyzing and/or displaying revenue information,
in accordance with various embodiments.
FIGS. 4 and 5 are process ?ow diagrams illustrating vari
ous methods of mapping revenue data, in accordance with
various embodiments.
FIGS. 6-8 are exemplary screen displays depicting a user
interface for displaying revenue information for a user, in
accordance with various embodiments.
FIG. 9 is an exemplary screen display depicting a user
interface for displaying mapped revenue data for a user, in
accordance with various embodiments.
FIG. 10 is a generalized schematic diagram illustrating a
computer system, in accordance with various embodiments.
FIG. 11 is a block diagram illustrating a networked system
of computers, which can be used in accordance with various
embodiments.
DETAILED DESCRIPTION OF CERTAIN
EMBODIMENTS
While various aspects and features ofcertain embodiments
have been summarized above, the following detailed descrip
tion illustrates a few exemplary embodiments in further detail
to enable one of skill in the art to practice such embodiments.
In the following description, for the purposes ofexplanation,
numerous speci?c details are set forth in order to provide a
thorough understanding of the described embodiments. It
will be apparent to one skilled in the art, however, that other
embodiments of the present may be practiced without some
ofthese speci?c details. In other instances, certain structures
and devices are shown in block diagram form. Several
embodiments are described herein, andwhile various features
are ascribed to different embodiments, it should be appreci
ated that the features described with respect to one embodi
ment may be incorporated with other embodiments as well.
By the same token, however, no single feature or features of
any described embodiment should be considered essential to
every embodiment ofthe invention, as other embodiments of
the invention may omit such features.
In an aspect, certain embodiments provide a decision
maker (or other user) with analysis of revenue performance
for various products (or product lines). A product can be any
US 8,688,502 B2
5
good or service that produces revenue for an operating entity
(such as a corporation, etc.), such as through sales of a good,
performance of a service, licensing of a software program or
intellectual property, etc. In an aspect, a product line might
comprise a group of (possibly related) products, and in
another aspect, a product line might comprise a single prod
uct. Hence, unless the context clearly indicates otherwise, the
terms “product” and “product line” should be interpreted
broadly and interchangeably when used herein.
A set of embodiments provides tools and techniques for
providing decision support to enterprises. Certain of these
tools analyze and/or display information, including, in a par
ticular aspect, revenue and/or other ?nancial information, in
novel ways. These features can provide users with enhanced
insight into the performance of various product lines and/or
into opportunities to enhance such performance, including
(but not limited to) insight into the performance of two or
more product lines in conjunction with one another. In
another aspect, certain tools provide heretofore unavailable
facilities for evaluating the success of an acquisition, for
example, by providing insight into the market compatibility
of an acquired product line with an existing product line.
Yet other embodiments provide tools and techniques that
generate map displays to graphically illustrate ?nancial per
formance. In an aspect, a map display might employ a col
oration scheme that distinguishes among various ranked
regions to illustrate, for example, revenue performance
(which can be measured by any of a number of metrics), to
allow a user to quickly understandthe relative performance of
a product line across a number of regions. In another aspect,
a map display might correlate a ?rst set of revenue informa
tion (or other ?nancial information) with other data sets, such
as sales force data, competitive sales data, and/or the like, to
allow a user to quickly identify correlative patterns in the two
data sets. Such map displays might feature two maps side
by-side, or might superimpose a map of one data set over a
map ofanother data set, to assist in the user’s visual analysis.
FIGS. 1-6 illustrate various methods that can be used to
map ?nancial information to geographic areas, analyze ?nan
cial information, and/or display such mapped and/or ana
lyzed ?nancial information. While the methods of FIGS. 1-6
are illustrated, for ease ofdescription, as different methods, it
should be appreciated that the various techniques and proce
dures of these methods can be combined in any suitable
fashion, and that, in some embodiments, the methods
depicted by FIGS. 1-6 can be considered interoperable and/or
as portions ofa single method. Similarly, while the techniques
and procedures are depicted and/or described in a certain
order for purposes ofillustration, it should be appreciated that
certain procedures may be reordered and/or omitted within
the scope ofvarious embodiments. Moreover, these methods
(and/or portions thereof) may also be implemented using any
suitable hardware implementation, including without limita
tion as software programs installed (and/or installable) on the
computer systems described in detail below.
FIGS. 1-3 are process ?ow diagrams illustrating various
methods ofanalyzing and/or displaying revenue information,
in accordance with various embodiments. For example, FIG.
1 illustrates a method 100 of displaying information about
revenue produced by an analysis ofrevenue from one or more
product lines, in accordance with one set of embodiments.
In the illustrated embodiment, method 100 comprises stor
ing (e.g., in a database) data about a plurality of transactions
(block 105). In a particular aspect of some embodiments, this
data might be revenue data that pertains to revenue transac
tions. A “revenue transaction” can be any transaction that
produces revenue for an entity, such as a corporation.
20
25
30
35
40
45
50
55
60
65
6
Examples of revenue transactions can include sales transac
tions in which goods and/or services are transferred in return
for some form ofpayment, license transactions (e.g., sales of
software licenses, licenses to intellectual property, etc.), and/
or the like. In one aspect, the revenue data may be created by
an enterprise application, and/or the revenue data about each
revenue transaction identifying an amount of revenue gener
ated by a sale of one or more products (e.g., goods, services,
licenses, etc.) by an enterprise. Revenue data about a particu
lar transaction can include, without limitation, identi?cation
of a selling entity (and/or licensor), identi?cation of a pur
chasing entity (and/or licensee), identi?cation of a product
and/or product line purchased (and/or licensed), identi?ca
tion of a quantity of the product purchased, a unit price, a
gross sales amount, and/or a revenue amount (if different
from the gross sales amount). In some cases, the database
might include revenue transactions pertaining to sales of a
product as well as revenue transactions related to services
provided in connection with that product. In one aspect, these
two data sets might both be treated as being associated with
that product.
In many cases, data used by various embodiments (includ
ing without limitation revenue data) may be stored in a data
base and/or a data warehouse. Merely by way of example, in
a typical embodiment, a business application (also referred to
herein as an “enterprise application”), which may be respon
sible for tracking and/or accounting for many types of busi
ness transactions, including without limitation revenue trans
actions, may store data about one or more revenue
transactions in a database. (Examples of enterprise applica
tions can include, without limitation, one or more applica
tions such as those available in Oracle e-Business SuiteTM,
Oracle Fusion ApplicationsTM, PeopleSoft EnterpriseTM, JD
Edwards EnterpriseOneTM, and Siebel CRMApplicationsTM,
all of which are commercially available from Oracle Corp.)
An automated process, such as an extract-transform-load
(“ETL”) process may loadthis data into a data warehouse. For
purposes of this disclosure, a data warehouse can be consid
ered to be to be a specialized database for storing and/or
analyzing data about large numbers oftransactions. Embodi
ments may be used with transaction data stored in either a
database and/or a warehouse, as well as other data storage
mechanisms. Hence, as used herein, the term “database”
means any appropriate data structure for storing data used by
various embodiments; such data structures can include, with
out limitation, relational databases, non-relational databases,
?le systems, data warehouses, and/or the like.
At block 110, the method 100 comprises accessing data
(e.g., revenue data) stored in the database. Often, the proce
dures for accessing the data may vary according to the nature
ofthe database in which the data is stored; merely by way of
example, many relational database management systems and
data warehouse management systems provide mechanisms,
such as SQL calls, stored procedures, etc., to provide access
to data stored in databases managed by those systems, and
such mechanisms may be used as appropriate. While the
revenue data may be stored merely as a series of transaction
records each pertaining to a particular revenue transaction
(each transaction having associated details, such as customer
identity, revenue amount, product/product line sold, etc.), it
should be appreciated that the revenue data can be catego
rized in many ways; for example, the revenue data might be
categorized as multiple sets ofrevenue data, each associated
with a particular customer; as another example, the revenue
data might be categorized as multiple sets of revenue data,
each pertaining to revenue generated by sales of a set of one
or more products in a particular product line.
US 8,688,502 B2
7
The method 100 further comprises, in some embodiments,
providing a user interface (block 115). In an aspect, this user
interface can provide the user with the ability to interact with
a data presentation system. (This data presentation system,
which may be in communication with the database and/or
may be responsible for accessing the data in the database,
may also perform many ofthe analysis and/or display func
tions described herein.)
For example, the user interface can be used to output infor
mation for a user, e.g., by displaying the information on a
display device, printing information with a printer, playing
audio through a speaker, etc.; the user interface can also
function to receive input from a user, e.g., using standard
input devices such as mice and other pointing devices, key
boards (both numeric and alphanumeric), microphones, etc.
The procedures undertaken to provide a user interface, there
fore, can vary depending on the nature ofthe implementation;
in some cases, providing a user interface can comprise dis
playing the user interface on a display device; in other cases,
however, where the user interface is displayed on a device
remote from the computer system (such as on a client com
puter, wireless device, etc.), providing the user interface
might comprise formatting data for transmission to such a
device and/or transmitting, receiving and/or interpreting data
that is used to create the user interface on the remote device.
Alternatively and/or additionally, the user interface on a client
computer (or any other appropriate user device) might be a
web interface, in which the user interface is provided through
one or more web pages that are served from a computer
system (and/or a web server in communication with the com
puter system), and are received and displayed by a web
browser onthe client computer (or other capable user device).
The web pages can display output from the computer system
and receive input from the user (e.g., by using Web-based
forms, via hyperlinks, electronic buttons, etc.). A variety of
techniques can be used to create these Web pages and/or
display/receive information, such as JavaScript, Java appli
cations or applets, dynamic HTML and/or AJAX technolo
gies.
In many cases, providing a user interface will comprise
providing one or more display screens (a few examples of
which are described below), each of which includes one or
more user interface elements. As used herein, the term “user
interface element” (also described as a “user interface mecha
nism” or a “user interface device”) means any text, image or
device that can be displayed on a display screen for providing
information to a user and/or for receiving user input. Some
such elements are commonly referred to as “widgets,” and
can include, without limitation, text, text boxes, text ?elds,
tables and/or grids, charts, hyperlinks, buttons, lists, combo
boxes, checkboxes, radio buttons, and/or the like. While the
exemplary display screens described herein employ speci?c
user interface elements appropriate for the type of informa
tion to be conveyed/received by computer system in accor
dance with the described embodiments, it should be appreci
ated that the choice ofuser interface element for a particular
purpose is typically implementation-dependent and/or dis
cretionary. Hence, the illustrated user interface elements
employed by the display screens described herein should be
considered exemplary in nature, and the reader should appre
ciate that other user interface elements could be substituted
within the scope of various embodiments.
As noted above, in an aspect of certain embodiments, the
user interface provides interaction between a user and a com
puter system. Hence, when this document describes proce
dures for displaying (or otherwise providing) information to
20
25
30
35
40
45
50
55
60
65
8
a user, orto receiving input from a user, the user interface may
be the vehicle for the exchange of such input/output.
Inthe illustrated embodiment, the method 100 further com
prises receiving a selection of one or more product lines for
analysis (block 120). In many embodiments, the selection is
received as user input via the user interface. Merely by way of
example, in some embodiments, the user may be provided
with a list of product lines (e.g., in a drop box or other
appropriate interface element), may be provided with a text
input ?eld to specify a product line, and/or the like. As noted
above, some cases, a product line might simply identify a
single product, while in other cases, a product line might
identify multiple products (e.g., a family ofrelated products).
In particular embodiments, a usermight select multiple prod
uct lines to be analyzed against one another, as described in
further detail below.
At block 125, the method 100 comprises identifying a set
ofrevenue transactions corresponding to the selected product
line. Merely by way of example, in a set of embodiments,
identifying a set of revenue transactions might comprise
searching the database in which the revenue data is stored,
using an identi?er of the selected product line as a search
criteria. As noted above, in many cases, the database will
comprise data (e.g., a series of records) about revenue trans
actions; each ofthese records might have a ?eld for identify
ing a product and/or product line, such that the database can
be searched for records in which the value of that ?eld
matches a search criterion provided by the user when select
ing a product line for analysis. (In some embodiments, the
procedures for identifying the set ofrevenue transactions and
for accessing revenue data might be consolidated into the
same set of operations.)
In certain embodiments, the method 100 further comprises
identifying a set of customers associated with the identi?ed
set of revenue transactions (block 130). Merely by way of
example, in some embodiments, the search results might be a
set ofrecords in the database that all have a product or prod
uct-line identi?er that matches the product line speci?ed by
the user. Each of these records might also have a customer
identi?er ?eld, and the records thus can be analyzed to iden
tify the customer from the value in this ?eld. From this analy
sis, a set of customers can be identi?ed from the set oftrans
actions pertaining to the product line of interest.
The method 100 might further comprise analyzing some or
all of the customers in the identi?ed set of customers (block
135). In an aspect, this analysis might include identifying an
amount of revenue attributable to each customer (either on a
per-transaction basis or as a collective amount), for example,
by analyzing a revenue ?eld in each record for each customer,
and optionally consolidating the revenue values across mul
tiple records (representing multiple revenue transactions) for
a single customer.
At block 140, the method 100 comprises receiving a selec
tion ofone or more revenue characteristics ofinterest. As used
herein, the term “revenue characteristic” means any charac
teristic of a revenue transaction that can be used to differen
tiate, sort, categorize, and/or distinguish between individual
revenue transactions and/or between sets or groups ofrevenue
transactions. These characteristics ofinterest, as described in
further detail below, can be used to segment and/or analyze
the data for the identi?ed customers. In some aspects, the
selection of characteristic(s) of interest is received from the
user, via the user interface, in a manner similar to the way in
which the product lines ofinterest are selected. In accordance
with different embodiments, a wide variety of revenue char
acteristics may be available for the user to select, and/or the
US 8,688,502 B2
analysis and/or segmentation ofthe data may vary according
to the selected revenue characteristic(s).
Some revenue characteristics may pertain primarily to
products and/orproduct lines. Merely by way ofexample, one
possible revenue characteristic is revenue earned on sales ofa
product line (e.g., over a speci?ed period). Using this revenue
characteristic, product lines may be sorted, ranked, differen
tiated, etc. according to the revenue generated from those
product lines (as calculated from some or all ofthe identi?ed
revenue transactions that pertain to each product line). Other
examples of such revenue characteristics are described in
further detail below.
Another type of revenue characteristic that can be sup
ported by various embodiments is a revenue characteristic
that pertains primarily to customers. For example, customer
size is a revenue characteristic that might be selected by a user
that wanted to analyze the revenue data according to the size
ofthe customers (e.g., companies, etc.) thatparticipated inthe
identi?ed revenue transactions. Using this characteristic, a
user could view results of analysis of revenue by customer
size (e.g., to determine how much ofthe revenue was gener
ated from customers falling within various size categories
determinedby thresholds speci?edby the user, precon?gured
by the system, etc.). Similarly, customer identity is a revenue
characteristic that can be used to generate, for example, a list
of customers ranked by revenue. Other revenue characteris
tics can include, without limitation, customer industry seg
ment, whether the customer has purchased a competing prod
uct from another vendor, and customer region (which can be
used with the mapping tools provided by other embodiments,
as described below), to name a few examples.
In some cases, multiple revenue characteristics might be
selected. For example, the user might select product line and
customer identity characteristics, which could be used to
generate a plurality of lists of customers ranked by revenue,
with each list pertaining only to revenue generated by one (or
more) ofthe product lines. From these examples, one skilled
in the art should appreciate that various embodiments can
provide users with a variety ofdimensions by which revenue
data can be analyzed, through the selection of different rev
enue characteristics for analysis.
In an aspect ofcertain embodiments, the method 100 might
include segmenting the set of customers into two or more
subsets (block 145). Merely by way of example, in some
embodiments, the set ofcustomers is segmented according to
the characteristic ofinterest speci?edby the user. In an aspect,
this segmenting may comprise classifying each customer into
one oftwo or more groups, according to the characteristic of
interest. So, for example, if the characteristic of interest is
revenue earned over the course of a year, the customers might
be divided into quartiles (or any other appropriate division,
which might be speci?ed by user input, by default business
rules, and/or the like).
As illustrated by FIG. 1, the operations of receiving a
selection ofa characteristic ofinterest and segmenting the set
of customers may be performed iteratively. For example, the
set of customers may be segmented into two subgroups
according to a ?rst characteristic ofinterest, and one (or both
ofthose subgroups) might be further segmented by a second
characteristic of interest. Thus, for example, the set of cus
tomers might be segmented into quartiles according to an
amount ofrevenue earned from sales of a particular product,
and the top quartile (or all of the quartiles) might be further
segmented into quintiles by customer size.
To further illustrate how a group of customers may be
segmented in accordance with one embodiment, FIG. 2 illus
trates a method 200 that may be employed to segment a group
20
25
30
35
40
45
50
55
60
65
10
ofcustomers according to a revenue characteristic ofinterest.
At block 205, the method comprises assigning ranks to each
ofthe customers in the set of customers. In an aspect, assign
ing a rank to a customer might comprise sorting the set of
customers (e.g., from high to low, etc.) according to the value
of the characteristic of interest for that customer. So, for
example, ifthe characteristic ofinterest is revenue earned, the
method might comprise ?nding each transaction (during the
period of interest) that involved that customer and summing
the revenue values of each of those transactions to obtain an
overall revenue amount for that customer. After these proce
dures have been performed for every customer in the set, the
set can then be sorted by the overall revenue amount for each
customer, from high to low. After being sorted, the customers
can then be ranked according to the sort order.
The method 200 may further comprise de?ning a segmen
tation scheme for the set of customers (block 210). In an
aspect, the segmentation scheme might divide the set of cus
tomers in to a speci?ed number of subsets of customers,
according to the rank assigned to each customer. Merely by
way ofexample, if segmentation into quartiles is desired, the
segmentation scheme might divide the set of customers into
four equally-sized subsets, with the ?rst subset comprising
the customers generating the largest revenue for the company
(i.e., the “largest” customers), and so forth. In some cases, the
segmentation scheme may be speci?ed by application
defaults, by business rules, and/or the like. In other cases, the
user might be provided with the ability (using appropriate
user interface elements) to specify a desired segmentation
scheme.
In some cases, it is useful for decision makers to under
stand how overall revenue breaks down among the customers.
For instance, if a majority of revenue is generated from a
select few customers, it may be to the company’s advantage to
focus particularly on attracting additional revenue from those
customers. Conversely, the company might wish to focus on
“smaller customers” in an attempt to diversity its revenue
base. In either case, it may be bene?cial for a decision maker
to see how the revenue from a particular product line (or
overall revenue, if desired) is distributed among different
classes of customers.
Accordingly, in an embodiment, the method 200 further
comprises calculating an amount of revenue attributable to
each subset of customers (block 215), as de?ned by the seg
mentation scheme. For instance, once the set ofcustomers has
been segmented into quartiles (or any other breakdown), the
revenue from all of the customers in each quartile can be
summed to produce a consolidated revenue amount for that
quartile. The method 200, then, may further comprise dis
playing the amount of revenue attributable to each subset of
customers (block 220), e.g., using the display techniques
described in further detail below.
Returning to FIG. 1, the method 100 further comprises
displaying, for a user, (block 150) information about revenue
attributable to at least one of the subsets of customers. In an
aspect, this information may be displayed in a user interface,
and/or it might employ one or more graphical and/or textual
user interface elements to display the information. The nature
of the display will depend, on many cases, on the type of
information being displayed, and a number ofdifferent types
of information might be displayed, depending on the type of
analysis requested by the user. In some cases, the displayed
information might include revenue amounts attributable to
one or more customers (or one or more subsets of customers,
as described above).
In other cases, however, the revenue amounts might not be
displayed. Merely by way ofexample, in a particularembodi
US 8,688,502 B2
11
ment, a user might seek to understand af?nity between two
product lines, and the display might comprise a representa
tion (either graphical, textual, or both) that provides a ranked
list of one or more products with the highest af?nity to the
selected target product, without regard to the amount of rev
enue generated from each of the products. In other cases,
however, the representation might also include revenue
amountsifor instance, in the af?nity example, the list of
products might be ordered by revenue amount but might also
be accompanied by an indication of the amount of revenue
generated from sales of each product made in conjunction
with sales of the selected target product.
Further, in some embodiments, whether or not actual rev
enue amounts are displayed, the user interface may provide
users with the ability to drill into the displayed information to
produce additional information. Different embodiments may
support a widevariety of“drill-down” capabilities. Merely by
way of example, as indicated below, certain embodiments
provide the ability for a user to drill from a map display into
various data (whichtypically will be, but neednot necessarily
be, related to information, such as products, sales force,
regions, etc. corresponding to the map display itself). Like
wise, certain embodiments can provide the ability for user to
use any of the displays described herein to drill into further
information (which may be, but need not necessarily be)
relatively more focused, detailed, and/or speci?c. This drill
down feature may be implemented recursively, allowing a
user to journey further into progressively more detailed and/
or focused information, as the user drills from display screen
to display screen. Correspondingly, however, various
embodiments may provide the user with the ability to “drill
up” into more summary information, and/or traverse between
different types ofdata (e.g., progressively from general sales
data, to data about a speci?c product, to data about a sales
force responsible forthatproduct, to general sales force data),
by selecting appropriate user interface elements to drill into
the desired information.
For instance, continuing with the af?nity example, the user
interface may provide a user interface element (which may be
a portion ofthe displayed information itself, which may serve
as a hyperlink, etc., and/or may be a corresponding element,
such as a button, etc.) that allows the user to request the
display ofmore detailed information about a particular prod
uct in the af?nity list. In some cases, an additional user inter
face element might be provided to allow the user to provide
input on what type of information the user would like to drill
into.
To illustrate, ifthe display provides a graphical illustration
of ten products with af?nities to the selected target product,
the usermight be given the ability to select one ofthe products
(e.g., by clicking on that product in the display) to drill into
further information about that product. Such further informa
tion might include overall revenue information for that prod
uct (without regard to whether the revenue was generated in
conjunction with a sale of the target product), historical rev
enue information, largest customers for that product, etc. A
separate user interface element might allow the user to select
which of these areas (or others), the user would like to drill
into. In fact, certain embodiments may be considered recur
sive, in that selecting some portion ofthe displayed informa
tion might restart the method 100, with the selected informa
tion acting as the target for a new set of analysis.
A user interface in accordance with one set of embodi
ments might be con?gured to display a dashboard display,
one example ofwhich is depicted by FIG. 6 and described in
further detail below. In an exemplary embodiment the dash
board display might comprise a plurality of panels, each
20
25
30
35
40
45
50
55
60
65
12
displaying information about revenue attributable to one or
more subsets ofcustomers; some ofthe panels might present
information graphically (e.g., using charts, images, and/or
other graphical devices), while others might present informa
tion textually (e.g., using lists, tables, and/or the like).
In accordance with various embodiments, many different
types of information may be displayed by the user interface
(e.g., using dashboard panels). Merely by way ofexample, in
many embodiments, the user interface might display sorted
lists of customers (e.g., customers that have been segmented
into a particular subgroup). In other embodiments, the user
interface might display revenue ?gures for one or more
groups of customers. Such revenue ?gures can include, inter
alia, revenue earned on one or more particular product line,
revenue earned over one or more particular period, in one or
more particular regions. In particular various embodiments
can be used to provide deep analysis ofrevenue patterns based
on customer characteristics, including without limitation rev
enue earned on sales to customers ofa certain size, customers
in certain industry segments, a competitor’s customers, and/
or the like. In particular, embodiments allow revenue to be
broken out according to these characteristics to allow com
parative analysis.
In some cases, the user may be given the option to view
revenue data about multiple product lines (e.g., a comparative
analysis of revenue across multiple product lines). Hence,
FIG. 3 illustrates a method 300 of displaying revenue infor
mation about multiple product lines. In a particular embodi
ment, the method 300 may be integrated with the method 100
described above. Merely by way of example, in some cases,
the revenue characteristic of interest might be an amount of
revenue earned onthe sales ofone ormore products otherthan
one or more selected (target) product(s) or product line(s).
The method 300, then, might comprise, at block 305, identi
fying a plurality of product lines, other than the selected
product line(s), that each also have generated revenue attrib
utable to a set of customers who also purchased the selected
product line (e.g., customers identi?ed as being associated
with revenue transactions that correspond to the selected
product line). The method 300 might furthercomprise assign
ing a rank to each ofthese identi?edproduct lines (block 310).
In different embodiments, different criteria might be used to
rankthe identi?ed product lines. By way ofexample, product
lines might be ranked based on the amount of revenue gen
erated by each respective product line and attributable to the
identi?ed set of customers, by a number ofproducts sold (to
the identi?ed set ofcustomers) in eachproduct line, and/orby
an amount ofcustomers purchasing each product line. In this
situation, displaying information about the attributable rev
enue might comprise displaying information about at least
some of these identi?ed product lines (block 315). This dis
play might be based on the rank assigned to each of the
identi?ed product lines.
To illustrate, if the system identi?es one hundred custom
ers as purchasing the target product (i.e., as being associated
with one or more revenue transactions corresponding to the
target product), it might then identify twenty-?ve other prod
ucts also purchased by one or more of those one hundred
customers, and then rank those twenty-?ve products accord
ing to the collective amount of revenue each generated from
the one hundred customers. The system might then display
information about the top ?ve ranked products (other than the
target product); such information might include, merely by
way of example, an identi?cation of each displayed product,
a collective amount of revenue generated from sales of each
product to the customer set, and/or the like. As noted above,
such a display might be textual and/or graphical in nature. In
US 8,688,502 B2
13
this way, the system can enable a decision maker to quickly
?nd af?nities between a target product and other products.
As noted above, certain embodiments can provide insight
into geographical revenue trends, e.g., by mapping and dis
playing revenue data. FIGS. 4 and 5 are process ?ow dia
grams illustrating various methods 400 and 500, respectively,
ofmapping revenue data, in accordance with various embodi
ments. In many cases, the mapping of data (including in
particular revenue data) is useful to show relative perfor
mance of various regions (e.g., sales territories countries,
states, etc.) in generating revenue. Accordingly, in an aspect,
the ?rst method 400 can be employed to generate a map with
a ranked display of the relative performance of various
regions, while the second method 500 can be used to correlate
two data sets and/or to map the correlated data sets.
In an aspect, the methods 400 and/or 500 can operate on
similar data to that used by the methods 100, 200, and 300 of
FIGS. 1-3 and, in fact, can often be combined with those
methods (e.g., to display a map ofrevenue data as one panel
on a dashboard). Accordingly, the method 400 comprises
several operations that are similar to those ofthe method 100,
including without limitation storing revenue data (e.g., data
about a plurality ofrevenue transactions) in a database (block
405), accessing the revenue data (block 410) and providing a
user interface for user to interact with a data presentation
system in communication with the database (block 415). In
some embodiments, the revenue data might pertain to a speci
?ed of revenue transactions (including, for example, a set of
revenue transactions that correspond to a particular product
line, customer, customer set, etc.). Merelybyway ofexample,
the methods 100-300, and/or various portions thereof, might
be used to identify the set ofrevenue transactions about which
revenue data should be retrieved from the database and/or
analyzed. For instance, in a particular embodiment, a user
might select a product line in the manner described above, and
the revenue data associated with transactions corresponding
to that product line might be used in the method 400 of FIG.
4.
The method 400 further comprises receiving user input via
the user interface (block 420). A variety of different types of
user inputs might be used to specify how mapped data should
be displayed, as described in further detail below. Merely by
way of example, a user may provide input to specify a par
ticular set ofrevenue data to be analyzed and/or mapped (e.g.,
to identify a product for analysis, to identify a time period for
analysis, etc.), to specify a type of analysis to perform, to
indicate a desired geographical hierarchy (and/or a level of a
given geographical hierarchy to display on a map), to specify
one or more thresholds to de?ne a ranking scheme, to indicate
one or more desired colors to be used on a map display, and/or
to select a region of a map display, to name a few examples.
Depending on the type of input that the user is to provide,
various embodiments may provide a variety of different user
interface elements to receive such input. Merely by way of
example, a color palette may be provided to allow a user to
select colors, while a list of threshold values and/or a text
input box might be provided to allow a user to specify thresh
old values. In some embodiments, user input to select a
mapped region may be received as a mouse click on the
selectedregion in a map ofa larger area (e.g., a mouse click on
a continent in a world map). Based on these examples, one of
skill in the art should appreciate that a wide variety of user
interface elements may be used by various embodiments, and
that these examples should not be considered limiting.
At block 425, the method 400 comprises de?ning a geo
graphical hierarchy by which the revenue data should be
categorized. In an aspect, a geographical hierarchy de?nes a
20
25
30
35
40
45
50
55
60
65
14
plurality of regions that may be organized hierarchically.
Merely by way of example, a geographical hierarchy might
comprise a ?rst hierarchical level that includes the entire
world. That geographical hierarchy might include a second
hierarchical level that comprises several regions (e.g., North
America; Latin American and the Caribbean; Europe, the
Middle East, andAfrica (“EMEA”); andAsia Paci?c. A third
hierarchical level might include individual countries, and a
fourthhierarchical level might includes intra-national regions
or subdivisions where appropriate (e.g., states in the US,
cantons in Switzerland, provinces in Canada, etc.). In another
example, a geographical hierarchy might include a ?rst level
comprising the United States, a second level including
regions within the United States (e.g., Paci?c, Rocky Moun
tain, North, South, and East), a third region including indi
vidual states, and a fourth level including individual counties
(or, in some cases, metropolitan areas, etc.). In an aspect, the
regions de?ned at one level ofthe geographical hierarchy can
be considered sub-regions of a region at a higher level ofthe
hierarchy. For example, a geographical might de?ne the
United States as a region at a top level of the hierarchy and
de?ne each individual state as a region at a second level ofthe
hierarchy; in this example, the states can be considered to be
sub-regions of the United States.
In some cases, a geographical hierarchy might be de?ned
based, at least inpart, onuser input. For example, a user might
select a desired geographical hierarchy in the user interface.
In other cases, a geographical hierarchy might be de?ned
without user input at all, based, for instance, on a set of stored
business rules that specify how a geographical hierarchy
should be de?ned, and/or based on a geographical hierarchy
speci?ed by the ?nancial data itself (e.g., in cases in which
eachtransactionrecordhas a geographical dimension, such as
a sale location, customer location, etc.).
At block 430, the method 400 comprises categorizing the
data according to the geographical hierarchy. In many cases,
each data element (e.g., transaction record, etc.) in the set of
?nancial data might have either a geographical dimension or
another dimension from which a geographical dimension can
be derived. For example, some companies might track their
revenue data according to, inter alia, sales region. This dimen
sion can be considered a geographical dimension and can be
used to categorize the data according to the geographical
hierarchy.
In some cases, the geographical dimension of the data
elements might correspond to a different (second) geographi
cal hierarchy than the hierarchy de?ned for categorizing the
data (the ?rst geographical hierarchy, in this example).
Merely by way of example, the de?ned geographical hierar
chy might be the ?rst hierarchy described above (with the
world at the ?rst level, various intercontinental regions at the
second level, and individual countries at the third level), while
the ?nancial data might include a geographical dimension
that is non-hierarchical (i.e., organized by a geographical
hierarchy that has only one level, such as the country ofsale).
As another example, some ofthe data might be organized by
the ?rst geographical hierarchy, while other data is organized
according to a second hierarchy. This situation is common,
for example, in the case of an acquisition, in which the sales
territories of the acquisition do not align precisely with the
sales territories of the acquirer. In the past, such situations
made an integrated analysis ofthe inconsistent data dif?cult,
if not impossible.
In such cases, the method 400 (and/or more precisely, the
categorization ofthe data according to the geographical hier
archy) might include translating the geographical dimension
of each ?nancial data element from the second geographical
US 8,688,502 B2
15
hierarchy to the ?rst geographical hierarchy (block 435). This
can allow for the analysis and/or mapping of data from dis
parate sources and/or of legacy data that was collected using
a different geographical hierarchy than the hierarchy that
should be used to map the data. In one aspect, this translation
can be facilitated by the use ofa translation table, which maps
locations in one hierarchy to locations in another hierarchy. A
number oftranslation tables may be employed in accordance
with different embodiments, and these translation tables may
be created programmatically and/or manually. In a set of
embodiments, translation tables, once created, can be reused
as needed. In some cases, the transaction records may be
updated with new hierarchy-speci?c location information,
such that the translation need only be performed once for a
given data element. In other cases, the translation may be
performed at run time, recognizing that different geographi
cal hierarchies may be used for different types ofanalyses. In
still other embodiments, a hybrid procedure may be used, in
which data elements are normalized to a standard hierarchy,
and then that standard hierarchy can be translated to a use
speci?c hierarchy as needed.
It should be noted that this translation procedure may be
used iteratively. if necessary. For example, a given dataset
might include a ?rst set of data elements with a geographical
dimension that corresponds to a ?rst geographical hierarchy
and a second set ofdata elements with a geographical dimen
sion that corresponds to a second geographical hierarchy.
However, the desired analysis might require the use ofa third
geographical hierarchy. In this case, the ?rst set of data ele
ments might be translatedwith a ?rst translation table, and the
second set ofdata elements might be translated with a second
translation table.
In other cases, the data might not have a geographical
dimension per se, but it might include another, non-geo
graphical dimension from which a geographical dimension
can be derived. Merely by way of example, a sales record
might not have any explicit geographical information, but it
might include a sales department code for the department to
which the sale was attributed. In this case, a translation table
might translate department codes into a geographical dimen
sion (e.g., by translating each sales department code into a
location value corresponding to the sales territory for that
respective sales department). In either case, the method 400
can include categorizing each data element (e.g., transaction
record) into its appropriate location in the geographical hier
archy, according to whatever geographical information is
available in the data and/or whatever geographical informa
tion can be derived from the data.
At block 440, the system analyzes the data. In one aspect,
analyzing the data might comprise calculating a collective
value of the categorized data for each region to be mapped,
according to the de?ned geographical hierarchy. The nature
ofthis calculation typically will depend on the type ofmetric
the user would like to have mapped (which also determines
which revenue data is selected at block 410, above). Merely
by way of example, if the user would like to see a map of
year-over-year revenue growth for each country (as illus
trated in FIG. 9, for instance), the analysis typically would
involve, foreach country to be displayed, calculating the prior
year’s revenue (e.g., by summing the revenue values in all of
the transaction records corresponding to that country for the
prior ?scal year), calculating the current year’s revenue (in
similar fashion), and subtracting the ?rst value from the sec
ond. Different calculations could be used to analyze different
metrics (e.g., overall revenue earned over a given period,
number ofsales over a given period, average revenue per sale,
etc.).
20
25
30
35
40
45
50
55
60
65
16
In some embodiments, the data are analyzed at the level of
the geographical hierarchy that is to be displayed (which
might be speci?ed by the user, set by default, etc.). In other
cases, however, the data are analyzed at the lowest level
possible, and then the results of the analysis are “rolled up”
the geographical hierarchy to the level at which the map will
be displayed. This technique canbeuseful, forexample, when
a user desires to “drill into” the map to obtain detail at a lower
level of the hierarchy (as described further below), as the
lower-level analysis will have been performed already. (Of
course, there are alternatives that would still allow a user to
“drill into” a speci?ed region without using roll-up analysis;
merely by way of example, the data could be re-analyzed at
the newly-selected level ofthe hierarchy ifnecessary.)
As noted above, the mapping techniques disclosed herein
are particularly useful to analyze the respective performance
of (or in) various geographical regions. Accordingly, in one
set of embodiments, the method 400 comprises de?ning a
ranking scheme for the data to be mapped (block 445). In an
aspect, the ranking scheme comprises one or more thresholds
for segmenting the regions in the geographical hierarchy into
a plurality of ranks, according to a revenue characteristic of
each region. In another aspect, this revenue characteristic
comprises the metric by which the data is analyzed, as
described above. In some cases, the thresholds are absolute
thresholds (e.g., speci?c revenue ?gures, speci?c amounts of
growth, etc.), while in other cases, the thresholds are relative
thresholds (e.g., percentile thresholds, quartile thresholds,
etc.).
In certain embodiments, the thresholds are set based on
user input (e.g., user input specifying that the regions should
be divided into quartiles; user input specifying that a ?rst
threshold should correspond to a ?rst revenue amount, that a
second threshold should correspond to a second revenue
amount, etc.; and/or the like). In other embodiments, the
thresholds may be determined without user input (e.g., based
on an analysis of the data and/or business rules). Merely by
way ofexample, ifoverall revenue per region is to be mapped,
and ifthe analysis ofthe data indicates that every region had
earned revenue between $0 and $500 million during the rel
evant period, with the majority of regions earning between
$10 million and $100 million, the system might determine
that the appropriate thresholds should be <$10 million, $10
million-$25 million, $25 million-$50 million, $50 million
$100 million, $100 million-$200 million, and >$200 million.
At block 450, the method 400 comprises de?ning a colora
tion scheme for the data. In an aspect, the coloration scheme
de?nes a coloration pattern for each rank de?ned by the
ranking scheme. In accordance with various embodiments, a
colorationpatternmight comprise any color, a pattern, and/or
any other display characteristic that visually distinguishes
regions ofone rank from regions ofanother rank. As with the
thresholds, the coloration scheme (and/or the individual col
oration patterns thereof) may be de?ned either based on user
input and/or automatically (e.g., based on system defaults,
etc.). Merely by way of example, a user might select two or
more colors, patterns, etc. (e.g., from a color palette provided
by the user interface) and assign each of those colors, etc. to
one ofthe ranks de?ned by the ranking scheme. In a particular
embodiment, a coloration scheme might employ the same
base color, in different shades, to illustrate different ranks
de?ned by the ranking scheme, for example with the highest
rank being the darkest color and the lowest rank being white
(or blank), with progressive gradations of shading indicating
intermediate ranks.
The method 400 further comprises generating a map dis
play in the user interface (block 455). In an aspect, the map
US 8,688,502 B2
17
display shows at least a subset of the regions de?ned by the
geographical hierarchy (and, in many cases, it will display all
ofthe regions at a particular level ofthe geographical hierar
chy). Each ofthe displayed regions, ofcourse, typically will
have a rank de?ned by the ranking scheme and a correspond
ing coloration pattern de?ned by the coloration scheme. FIG.
9, described in detail below, illustrates a user interface with a
map display generated in accordance with the method 400.
In some cases, the method 400 (and/or portions thereof)
may be used iteratively. Merely by way of example, in one
embodiment, the user interface might receive user input
selecting a displayed region (e.g., a “click” on one of the
regions, a selection of a region from a menu, etc.), which
might cause the system to implement any portions of the
method 400 necessary to redraw the map (i.e., generate a new
map display in the user interface) with a different scope; in
other words, ifthe user selects a particular region, the system
might generate a second map to display each of the sub
regions (as de?ned by the geographical hierarchy) of the
selected region. For instance, if a user selects the United
States on a displayed map of the world, the system might
generate a map display showing only the United States, with
each of the states displayed according to a ranking scheme
and/or coloration scheme. In some cases, the new map might
be generated with the same ranking scheme and/or coloration
scheme (in which case the operations for de?ning those
schemes might be omitted), while in other cases it may be
appropriate to rede?ne ranking and/or coloration schemes for
the more speci?c map display (for example, when showing
overall revenue, the ranking scheme for a world map might
not provide an effective display for a map of the US only, in
which each the revenue scale might be signi?cantly lower).
Hence, certain embodiments provide a userwith the ability
to drill into a speci?c region to see data at a lower level ofthe
geographical hierarchy. Other options may be available as
well. Merely by way of example, in some cases, rather than
displaying a lower-level map, the system might, upon receiv
ing a selection of a region, display ?nancial data (e.g., using
the techniques discussedwith respect to FIGS. 1-3) speci?c to
that region. Hence, the use of map displays allows users to
obtain ?nancial performance information (and otherinforma
tion) quickly and easily, particularly with respect to a region
(at any desired level ofthe geographical hierarchy) in which
the user is interested.
For instance, a user could drill from a displayed region in a
geographical map into ?nancial performance for that region
(either overall, for a speci?c product line, etc.), to drill in to
sales force information for that region (e.g., identities and/or
performance metrics of sales representative(s) for that
region), to drill into pipeline/sales channel information for
that region, and/or the like. Moreover, as noted above, certain
embodiments provide the user with the ability (e.g., using
appropriate user interface elements) to drill down into more
speci?c/focused/detailed information (either along a geo
graphical dimension, such as into a lower level in a geo
graphical hierarchy, or along another dimension, such as divi
sion, product line, speci?c performance metrics, etc.), to drill
up into more general information (again, along any appropri
ate dimension), or traverse across different dimensions of
data (e.g., from revenue totals, to sales force information, to
pipeline information).
In some cases, it is useful to be able to map correlated data.
For example, it might be useful to view revenue performance
for two different products in the same geographical hierarchy,
or to view revenue performance correlated with sales force
data (e.g., number of sales people assigned to a particular
region, changes in that number, etc.). Accordingly, FIG. 5
20
25
30
35
40
45
50
55
60
65
18
illustrates a method 500 that can be used to map correlated
data. In one aspect, the method 500 of FIG. 5 can be imple
mented with the method 400 ofFIG. 4 to display a ?rst set of
data (e.g., revenue data) along with another, second set ofdata
that is correlated the ?rst set of data.
The method 500 comprises accessing the second set data in
a database (block 505), which may be (but need not be) the
same database as the database in which the ?rst set of data is
stored; categorizing the second set of data (block 510), e.g.,
according to the same geographical hierarchy used to catego
rize the ?rst set of data, receiving user input (block 515);
analyzing the second set ofdata (block 520); de?ning a rank
ing scheme for the second set of data (block 525); and de?n
ing a coloration scheme for the second set ofdata (block 530).
In an aspect, these procedures are similar to those described
above with respect to FIG. 4, although they are performed
with respect to the second set of data, rather than the ?rst set
of data.
In some cases, the ranking and/or coloration schemes
might be the same for both sets ofdata (e.g., in cases in which
two maps are to be displayed side-by-side, in which case
similar ranking and/or coloration schemes might facilitate
visual correlationbetween patterns inboth sets ofdata), while
in other cases, the ranking scheme might be different (e.g.,
when a different metric is analyzed for each data set) and/or
the coloration scheme might be different (e.g., when both sets
of data are to be displayed on the same map display, as
described below, for example).
At block 535, the method 500 comprises correlating some
or all ofthe revenue data (in the ?rst set of data) with data in
the second set of data. In some cases, this correlation is
performed with respect to the regions speci?ed by the geo
graphical hierarchy, such that data in the ?rst data set that is
categorized within a particular region is correlated with a
subset of the second data set; this subset comprises data
within the second data set that also has been categorized
within the same particular region. This correlation bene?
cially can allow a decision maker to understand relationships
between the ?nancial performance of one product and the
?nancial performance of another product, or relationships
between the ?nancial performance of a product and another
metric (such as sales force metrics).
Essentially, correlating portions oftwo data sets comprises
normalizing the two data sets (or portions thereof) to the same
geographical hierarchy, and/or providing information to the
user based on these normalized data sets. There are several
techniques by which the two data sets (or portions thereof)
can be correlated for a user. Merely by way of example, in a
particularembodiment, the method 500 comprises displaying
information about the correlated data (block 540). This cor
related information may be displayed with a map display
(and/or with multiple map displays). Merely by way of
example, in one embodiment, the user interface might display
two maps (e.g., side-by-side) one showing a map display (as
per the method 400) based on the ?rst data set (or a portion
thereof), such as a map display of revenue information, and
the other showing a map display based on the second data set.
For instance, one map display might illustrate worldwide
revenue for a ?rst product (categorized into regions) while the
other map display might illustrate worldwide revenue for a
second product (categorized into the same regions) for a
second product. In another example, one map display might
illustrate a change in worldwide revenue across all products
(categorized into regions) over a certain period, while the
other map display might illustrate changes in sales force
personnel or advertising spending (categorized into the same
regions) over a prior period.
US Patent: Business Intelligence Dashboards for Performance Analysis

Más contenido relacionado

Destacado

Destacado (18)

15 years Regional Economic Development Agency - Stara Zagora
15 years Regional Economic Development  Agency - Stara Zagora15 years Regional Economic Development  Agency - Stara Zagora
15 years Regional Economic Development Agency - Stara Zagora
 
Fire safety and prevention
Fire safety and preventionFire safety and prevention
Fire safety and prevention
 
Кампания "Осинови паметник" Казанлък
Кампания "Осинови паметник" КазанлъкКампания "Осинови паметник" Казанлък
Кампания "Осинови паметник" Казанлък
 
Паметници Шипка
Паметници ШипкаПаметници Шипка
Паметници Шипка
 
Cca overall report_ppt_ultan_bg
Cca overall report_ppt_ultan_bgCca overall report_ppt_ultan_bg
Cca overall report_ppt_ultan_bg
 
Oracle Corp - strategy paper - March 2001
Oracle Corp - strategy paper - March 2001Oracle Corp - strategy paper - March 2001
Oracle Corp - strategy paper - March 2001
 
Erasmus+ IC
Erasmus+ ICErasmus+ IC
Erasmus+ IC
 
Европейски парламент - работа, състав
Европейски парламент - работа, съставЕвропейски парламент - работа, състав
Европейски парламент - работа, състав
 
St fin conf_project_merig_bg
St fin conf_project_merig_bgSt fin conf_project_merig_bg
St fin conf_project_merig_bg
 
Ppt final conference maria-helena antunes_bulgarian
Ppt final conference maria-helena antunes_bulgarianPpt final conference maria-helena antunes_bulgarian
Ppt final conference maria-helena antunes_bulgarian
 
ESN Еrasmus+
ESN Еrasmus+ESN Еrasmus+
ESN Еrasmus+
 
Pavasaris
PavasarisPavasaris
Pavasaris
 
Data Analysis: Putting Data Capital to Work
Data Analysis: Putting Data Capital to WorkData Analysis: Putting Data Capital to Work
Data Analysis: Putting Data Capital to Work
 
I am legend case study
I am legend case studyI am legend case study
I am legend case study
 
Project management
Project managementProject management
Project management
 
Bg young ambassadors visit Feb 2011
Bg young ambassadors visit Feb 2011Bg young ambassadors visit Feb 2011
Bg young ambassadors visit Feb 2011
 
Paragraph writing
Paragraph writingParagraph writing
Paragraph writing
 
Allergic rhinitis
Allergic rhinitisAllergic rhinitis
Allergic rhinitis
 

Similar a US Patent: Business Intelligence Dashboards for Performance Analysis

US20110125511 (1)
US20110125511 (1)US20110125511 (1)
US20110125511 (1)
ruvib
 
Running Head PROJECT DELIVERABLE 31PROJECT DELIVERABLE 310.docx
Running Head PROJECT DELIVERABLE 31PROJECT DELIVERABLE 310.docxRunning Head PROJECT DELIVERABLE 31PROJECT DELIVERABLE 310.docx
Running Head PROJECT DELIVERABLE 31PROJECT DELIVERABLE 310.docx
todd581
 
Week11 Determine Technical Requirements
Week11 Determine Technical RequirementsWeek11 Determine Technical Requirements
Week11 Determine Technical Requirements
hapy
 
Controlling SOA in Support of Operational Improvement (ISPE PE Vol 31 No 4 - ...
Controlling SOA in Support of Operational Improvement (ISPE PE Vol 31 No 4 - ...Controlling SOA in Support of Operational Improvement (ISPE PE Vol 31 No 4 - ...
Controlling SOA in Support of Operational Improvement (ISPE PE Vol 31 No 4 - ...
David Stokes
 

Similar a US Patent: Business Intelligence Dashboards for Performance Analysis (20)

US20110125511 (1)
US20110125511 (1)US20110125511 (1)
US20110125511 (1)
 
Running Head PROJECT DELIVERABLE 31PROJECT DELIVERABLE 310.docx
Running Head PROJECT DELIVERABLE 31PROJECT DELIVERABLE 310.docxRunning Head PROJECT DELIVERABLE 31PROJECT DELIVERABLE 310.docx
Running Head PROJECT DELIVERABLE 31PROJECT DELIVERABLE 310.docx
 
business analytics.ppt
business analytics.pptbusiness analytics.ppt
business analytics.ppt
 
Using Ontology to Capture Supply Chain Code Halos
Using Ontology to Capture Supply Chain Code HalosUsing Ontology to Capture Supply Chain Code Halos
Using Ontology to Capture Supply Chain Code Halos
 
Managing costs-by-leveraging-procurement-info-intelligently
Managing costs-by-leveraging-procurement-info-intelligentlyManaging costs-by-leveraging-procurement-info-intelligently
Managing costs-by-leveraging-procurement-info-intelligently
 
The Evolution of Digital Control Towers in Supply Chain
The Evolution of Digital Control Towers in Supply ChainThe Evolution of Digital Control Towers in Supply Chain
The Evolution of Digital Control Towers in Supply Chain
 
Strategies to Monetize Energy Data - How Utilities Can Increase Their 'Earnin...
Strategies to Monetize Energy Data - How Utilities Can Increase Their 'Earnin...Strategies to Monetize Energy Data - How Utilities Can Increase Their 'Earnin...
Strategies to Monetize Energy Data - How Utilities Can Increase Their 'Earnin...
 
Connecting ERP and digital technologies to become a High Velocity steel enter...
Connecting ERP and digital technologies to become a High Velocity steel enter...Connecting ERP and digital technologies to become a High Velocity steel enter...
Connecting ERP and digital technologies to become a High Velocity steel enter...
 
Manage Supply Chain Complexity With Predictive Commerce
Manage Supply Chain Complexity With Predictive CommerceManage Supply Chain Complexity With Predictive Commerce
Manage Supply Chain Complexity With Predictive Commerce
 
To Become a Data-Driven Enterprise, Data Democratization is Essential
To Become a Data-Driven Enterprise, Data Democratization is EssentialTo Become a Data-Driven Enterprise, Data Democratization is Essential
To Become a Data-Driven Enterprise, Data Democratization is Essential
 
10 Ways to Save Using Energy Data (Real-time and Utility Bill Data)
10 Ways to Save Using Energy Data (Real-time and Utility Bill Data)10 Ways to Save Using Energy Data (Real-time and Utility Bill Data)
10 Ways to Save Using Energy Data (Real-time and Utility Bill Data)
 
Oil & Gas Analytic Solution
Oil & Gas Analytic SolutionOil & Gas Analytic Solution
Oil & Gas Analytic Solution
 
Hh
HhHh
Hh
 
Data mining & data warehousing
Data mining & data warehousingData mining & data warehousing
Data mining & data warehousing
 
Putting Data at the Heart of Energy Trading
Putting Data at the Heart of Energy TradingPutting Data at the Heart of Energy Trading
Putting Data at the Heart of Energy Trading
 
2559 Big Data Pack
2559 Big Data Pack2559 Big Data Pack
2559 Big Data Pack
 
The Characteristics of Valuable Information
The Characteristics of Valuable InformationThe Characteristics of Valuable Information
The Characteristics of Valuable Information
 
Lecture 01 mis
Lecture 01 misLecture 01 mis
Lecture 01 mis
 
Week11 Determine Technical Requirements
Week11 Determine Technical RequirementsWeek11 Determine Technical Requirements
Week11 Determine Technical Requirements
 
Controlling SOA in Support of Operational Improvement (ISPE PE Vol 31 No 4 - ...
Controlling SOA in Support of Operational Improvement (ISPE PE Vol 31 No 4 - ...Controlling SOA in Support of Operational Improvement (ISPE PE Vol 31 No 4 - ...
Controlling SOA in Support of Operational Improvement (ISPE PE Vol 31 No 4 - ...
 

Último

Jual Obat Aborsi Surabaya ( Asli No.1 ) 085657271886 Obat Penggugur Kandungan...
Jual Obat Aborsi Surabaya ( Asli No.1 ) 085657271886 Obat Penggugur Kandungan...Jual Obat Aborsi Surabaya ( Asli No.1 ) 085657271886 Obat Penggugur Kandungan...
Jual Obat Aborsi Surabaya ( Asli No.1 ) 085657271886 Obat Penggugur Kandungan...
ZurliaSoop
 
Top profile Call Girls In Latur [ 7014168258 ] Call Me For Genuine Models We ...
Top profile Call Girls In Latur [ 7014168258 ] Call Me For Genuine Models We ...Top profile Call Girls In Latur [ 7014168258 ] Call Me For Genuine Models We ...
Top profile Call Girls In Latur [ 7014168258 ] Call Me For Genuine Models We ...
gajnagarg
 
Sonagachi * best call girls in Kolkata | ₹,9500 Pay Cash 8005736733 Free Home...
Sonagachi * best call girls in Kolkata | ₹,9500 Pay Cash 8005736733 Free Home...Sonagachi * best call girls in Kolkata | ₹,9500 Pay Cash 8005736733 Free Home...
Sonagachi * best call girls in Kolkata | ₹,9500 Pay Cash 8005736733 Free Home...
HyderabadDolls
 
Top profile Call Girls In dimapur [ 7014168258 ] Call Me For Genuine Models W...
Top profile Call Girls In dimapur [ 7014168258 ] Call Me For Genuine Models W...Top profile Call Girls In dimapur [ 7014168258 ] Call Me For Genuine Models W...
Top profile Call Girls In dimapur [ 7014168258 ] Call Me For Genuine Models W...
gajnagarg
 
Top profile Call Girls In Tumkur [ 7014168258 ] Call Me For Genuine Models We...
Top profile Call Girls In Tumkur [ 7014168258 ] Call Me For Genuine Models We...Top profile Call Girls In Tumkur [ 7014168258 ] Call Me For Genuine Models We...
Top profile Call Girls In Tumkur [ 7014168258 ] Call Me For Genuine Models We...
nirzagarg
 
Top profile Call Girls In Chandrapur [ 7014168258 ] Call Me For Genuine Model...
Top profile Call Girls In Chandrapur [ 7014168258 ] Call Me For Genuine Model...Top profile Call Girls In Chandrapur [ 7014168258 ] Call Me For Genuine Model...
Top profile Call Girls In Chandrapur [ 7014168258 ] Call Me For Genuine Model...
gajnagarg
 
Reconciling Conflicting Data Curation Actions: Transparency Through Argument...
Reconciling Conflicting Data Curation Actions:  Transparency Through Argument...Reconciling Conflicting Data Curation Actions:  Transparency Through Argument...
Reconciling Conflicting Data Curation Actions: Transparency Through Argument...
Bertram Ludäscher
 
Top profile Call Girls In Bihar Sharif [ 7014168258 ] Call Me For Genuine Mod...
Top profile Call Girls In Bihar Sharif [ 7014168258 ] Call Me For Genuine Mod...Top profile Call Girls In Bihar Sharif [ 7014168258 ] Call Me For Genuine Mod...
Top profile Call Girls In Bihar Sharif [ 7014168258 ] Call Me For Genuine Mod...
nirzagarg
 
+97470301568>>weed for sale in qatar ,weed for sale in dubai,weed for sale in...
+97470301568>>weed for sale in qatar ,weed for sale in dubai,weed for sale in...+97470301568>>weed for sale in qatar ,weed for sale in dubai,weed for sale in...
+97470301568>>weed for sale in qatar ,weed for sale in dubai,weed for sale in...
Health
 
Lecture_2_Deep_Learning_Overview-newone1
Lecture_2_Deep_Learning_Overview-newone1Lecture_2_Deep_Learning_Overview-newone1
Lecture_2_Deep_Learning_Overview-newone1
ranjankumarbehera14
 

Último (20)

Dubai Call Girls Peeing O525547819 Call Girls Dubai
Dubai Call Girls Peeing O525547819 Call Girls DubaiDubai Call Girls Peeing O525547819 Call Girls Dubai
Dubai Call Girls Peeing O525547819 Call Girls Dubai
 
Statistics notes ,it includes mean to index numbers
Statistics notes ,it includes mean to index numbersStatistics notes ,it includes mean to index numbers
Statistics notes ,it includes mean to index numbers
 
TrafficWave Generator Will Instantly drive targeted and engaging traffic back...
TrafficWave Generator Will Instantly drive targeted and engaging traffic back...TrafficWave Generator Will Instantly drive targeted and engaging traffic back...
TrafficWave Generator Will Instantly drive targeted and engaging traffic back...
 
Jual Obat Aborsi Surabaya ( Asli No.1 ) 085657271886 Obat Penggugur Kandungan...
Jual Obat Aborsi Surabaya ( Asli No.1 ) 085657271886 Obat Penggugur Kandungan...Jual Obat Aborsi Surabaya ( Asli No.1 ) 085657271886 Obat Penggugur Kandungan...
Jual Obat Aborsi Surabaya ( Asli No.1 ) 085657271886 Obat Penggugur Kandungan...
 
Nirala Nagar / Cheap Call Girls In Lucknow Phone No 9548273370 Elite Escort S...
Nirala Nagar / Cheap Call Girls In Lucknow Phone No 9548273370 Elite Escort S...Nirala Nagar / Cheap Call Girls In Lucknow Phone No 9548273370 Elite Escort S...
Nirala Nagar / Cheap Call Girls In Lucknow Phone No 9548273370 Elite Escort S...
 
Top profile Call Girls In Latur [ 7014168258 ] Call Me For Genuine Models We ...
Top profile Call Girls In Latur [ 7014168258 ] Call Me For Genuine Models We ...Top profile Call Girls In Latur [ 7014168258 ] Call Me For Genuine Models We ...
Top profile Call Girls In Latur [ 7014168258 ] Call Me For Genuine Models We ...
 
Sonagachi * best call girls in Kolkata | ₹,9500 Pay Cash 8005736733 Free Home...
Sonagachi * best call girls in Kolkata | ₹,9500 Pay Cash 8005736733 Free Home...Sonagachi * best call girls in Kolkata | ₹,9500 Pay Cash 8005736733 Free Home...
Sonagachi * best call girls in Kolkata | ₹,9500 Pay Cash 8005736733 Free Home...
 
Top profile Call Girls In dimapur [ 7014168258 ] Call Me For Genuine Models W...
Top profile Call Girls In dimapur [ 7014168258 ] Call Me For Genuine Models W...Top profile Call Girls In dimapur [ 7014168258 ] Call Me For Genuine Models W...
Top profile Call Girls In dimapur [ 7014168258 ] Call Me For Genuine Models W...
 
Top profile Call Girls In Tumkur [ 7014168258 ] Call Me For Genuine Models We...
Top profile Call Girls In Tumkur [ 7014168258 ] Call Me For Genuine Models We...Top profile Call Girls In Tumkur [ 7014168258 ] Call Me For Genuine Models We...
Top profile Call Girls In Tumkur [ 7014168258 ] Call Me For Genuine Models We...
 
Aspirational Block Program Block Syaldey District - Almora
Aspirational Block Program Block Syaldey District - AlmoraAspirational Block Program Block Syaldey District - Almora
Aspirational Block Program Block Syaldey District - Almora
 
Top profile Call Girls In Chandrapur [ 7014168258 ] Call Me For Genuine Model...
Top profile Call Girls In Chandrapur [ 7014168258 ] Call Me For Genuine Model...Top profile Call Girls In Chandrapur [ 7014168258 ] Call Me For Genuine Model...
Top profile Call Girls In Chandrapur [ 7014168258 ] Call Me For Genuine Model...
 
Reconciling Conflicting Data Curation Actions: Transparency Through Argument...
Reconciling Conflicting Data Curation Actions:  Transparency Through Argument...Reconciling Conflicting Data Curation Actions:  Transparency Through Argument...
Reconciling Conflicting Data Curation Actions: Transparency Through Argument...
 
Top profile Call Girls In Bihar Sharif [ 7014168258 ] Call Me For Genuine Mod...
Top profile Call Girls In Bihar Sharif [ 7014168258 ] Call Me For Genuine Mod...Top profile Call Girls In Bihar Sharif [ 7014168258 ] Call Me For Genuine Mod...
Top profile Call Girls In Bihar Sharif [ 7014168258 ] Call Me For Genuine Mod...
 
RESEARCH-FINAL-DEFENSE-PPT-TEMPLATE.pptx
RESEARCH-FINAL-DEFENSE-PPT-TEMPLATE.pptxRESEARCH-FINAL-DEFENSE-PPT-TEMPLATE.pptx
RESEARCH-FINAL-DEFENSE-PPT-TEMPLATE.pptx
 
SAC 25 Final National, Regional & Local Angel Group Investing Insights 2024 0...
SAC 25 Final National, Regional & Local Angel Group Investing Insights 2024 0...SAC 25 Final National, Regional & Local Angel Group Investing Insights 2024 0...
SAC 25 Final National, Regional & Local Angel Group Investing Insights 2024 0...
 
+97470301568>>weed for sale in qatar ,weed for sale in dubai,weed for sale in...
+97470301568>>weed for sale in qatar ,weed for sale in dubai,weed for sale in...+97470301568>>weed for sale in qatar ,weed for sale in dubai,weed for sale in...
+97470301568>>weed for sale in qatar ,weed for sale in dubai,weed for sale in...
 
High Profile Call Girls Service in Jalore { 9332606886 } VVIP NISHA Call Girl...
High Profile Call Girls Service in Jalore { 9332606886 } VVIP NISHA Call Girl...High Profile Call Girls Service in Jalore { 9332606886 } VVIP NISHA Call Girl...
High Profile Call Girls Service in Jalore { 9332606886 } VVIP NISHA Call Girl...
 
Gulbai Tekra * Cheap Call Girls In Ahmedabad Phone No 8005736733 Elite Escort...
Gulbai Tekra * Cheap Call Girls In Ahmedabad Phone No 8005736733 Elite Escort...Gulbai Tekra * Cheap Call Girls In Ahmedabad Phone No 8005736733 Elite Escort...
Gulbai Tekra * Cheap Call Girls In Ahmedabad Phone No 8005736733 Elite Escort...
 
20240412-SmartCityIndex-2024-Full-Report.pdf
20240412-SmartCityIndex-2024-Full-Report.pdf20240412-SmartCityIndex-2024-Full-Report.pdf
20240412-SmartCityIndex-2024-Full-Report.pdf
 
Lecture_2_Deep_Learning_Overview-newone1
Lecture_2_Deep_Learning_Overview-newone1Lecture_2_Deep_Learning_Overview-newone1
Lecture_2_Deep_Learning_Overview-newone1
 

US Patent: Business Intelligence Dashboards for Performance Analysis

  • 1. US. Patent 105 Q QQ Q Q01 QNin Q(10Q Q(A)(Ti QQQ QQin Apr. 1, 2014 Sheet 1 0f 11 Store Revenue Data V Access Revenue Data V Provide User Interface V Receive Selection of Product Line Identify Revenue Transactions V identify Customers V Analyze Customers V Receive Selection of Characteristic V Segment Set of Customers V Display information FIG. 1 US 8,688,502 B2 K100
  • 2. US. Patent Apr. 1, 2014 Sheet 2 0f 11 US 8,688,502 B2 Assign Ranks to Customers 205 V Define Segmentation Scheme 210 V Calculate Attributable Revenue 215 V Display Attributable Revenue 220 200 FIG. 2
  • 3. US. Patent Apr. 1, 2014 Sheet 3 0f 11 US 8,688,502 B2 Identify Pluratity of Product Lines 305 V Assign Ranks to Product Lines 310 V Display Information about Product Lines 315 K 300 FIG. 3
  • 4. US. Patent Apr. 1, 2014 Sheet 4 0f 11 US 8,688,502 B2 Store Revenue Data 405 V Access Revenue Data 410 V Provide User Interface 415 V Receive User Input 420 V Define Geographical Hierarchy 425 V Categorize Data 430 V Translate Dimension(s) 435 V Analyze Data 440 V Define Ranking Scheme 445 V Define Coloration Scheme 450 V Generate Map Display 455 K 400FIG. 4
  • 5. US. Patent Apr. 1, 2014 Sheet 5 0f 11 US 8,688,502 B2 Access Data 505 V Categorize Data 510 V Receive User Input V Analyze Data 520 V Define Ranking Scheme 525 V Define Colorization Scheme 530 V Correlate with Revenue Data 535 V Display Correlated Data 540 K 500FIG. 5
  • 6.
  • 7. US 8,688,502 B2Sheet 7 0f 11Apr. 1, 2014US. Patent ..OE 88/ 88.88.8888.88.88;88.8.8888.8?8888...88.88.88.838.288588.8888886.38888.808.888888.88.8829.6__<88.8.188.88.8@8888@88888.8.88.883588..882m.-.N.1 88:88$888.8.@8888@881288.888888.87/08891-8.1/},8188.888888.8.8888.88888.888.8.8838.8.0891-N.1$888.8888.88.8888.08.02888.28.888588.8.885-v.1.33881.3%.881.81881.81881.80%.881.518...:...<QB QEK mQN E82838888838.83 88888885288222.0__< 88.8...8m8.8888-.0821-.N.1 E882Ewt8@870882m.-8.EA 8285Q88:NE88.0891-N.1 8888.88Q888w..0821-F.1 .33881.3%.881.81881.81881.31881.518...=...<QB
  • 8. US 8,688,502 B2Sheet 8 0f 11Apr. 1, 2014US. Patent cow 1wow w.GE mooodoow comcom cow DHODUOHQo625E UwEEszwéozwloEwQEoo IQmEanu$053500 33vw=9w59653800E20w$0365 wLmEBwso$053500
  • 9. US 8,688,502 B2Sheet 9 0f 11Apr. 1, 2014US. Patent 000 j a.GE Sm. 2.333 mom El QEUE 0ququ @2652 N818I@8ch5%l@8chIvi: ommdr I MNWE. 1N22 wwwdm 22500 I-:23 H U ____06:35 “5282:@892“62655:96659m6:56521umcwzd 52:00"coammbzmanmm“Emgmmw5%an mg Etmsd=82".
  • 10. US. Patent Apr. 1, 2014 Sheet 10 0f 11 US 8,688,502 B2 1005 Processor(s) working K Memory 1010 K Storage Device(s) Ogisr’i?rgg 1025 1040’// ~1>351045 K Input Device(s) K 1015 ' ' Apphcatton(s) K Output Device(s) 1020 Communications f Subsystem 1030 f1000 FIG. 10
  • 11. US. Patent Apr. 1, 2014 Sheet 11 0111 US 8,688,502 B2 User Computer User Computer User Computer Network DEIEIII ._||_|u EIEIEIII uu DDIIIEJ nun uuuu 1:11:11: 1115a DEIEIEI nun EIEIEIEI nun 1115b DUDE! mum |:||:u:||:1 mum uncn: nun EIDEIEI nun DEIDEI nun nucn: nun 01:11:": nun nucn: mum L__—_-_____J l______.l Database Database 1120a 1120b K1100 FIG. 11
  • 12. US 8,688,502 B2 1 BUSINESS INTELLIGENCE DASHBOARDS FOR PERFORMANCE ANALYSIS CROSS-REFERENCES TO RELATED APPLICATIONS This application is related to co-pending US. patent appli cation Ser. No. 12/711,623, ?led Feb. 24, 2010 by Hartley et al. and entitled “Mapping Data in EnterpriseApplications for Operational Visibility”, which is hereby incorporated by ref erence, as ifset forth in full in this document, for all purposes. COPYRIGHT STATEMENT A portion of the disclosure of this patent document con tains material that is subject to copyright protection. The copyright owner has no objection to the facsimile reproduc tionby anyone ofthe patent document or the patent disclosure as it appears in the Patent and Trademark Of?ce patent ?le or records, but otherwise reserves all copyright rights whatso ever. FIELD The present disclosure relates, in general, to business intel ligence systems, and more particularly, to tools and tech niques for displaying revenue data. BACKGROUND Commercial enterprises typically seekto improve ?nancial performance as time goes on. One way to gain insight into possible performance improvements is by analyzing past per formance. Business intelligence systems can facilitate this process by synthesizing mountains of data (such as revenue data, cost data, and the like) to allow enterprises to see pat terns and gain insights that are not readily apparent from the raw data (often because ofthe sheer volume ofthe data to be analyzed). Inparticular, data on revenue from sales ofproducts (which can include any of a variety of difference goods and/or ser vices) can be used to drive decisions on which products should be emphasized in marketing campaigns, which prod ucts should be developed further, and/or which products should be dropped from an enterprise’s product line alto gether, to name a few examples. More speci?cally, past rev enue data can provide insight into products that might have a symbiotic relationship (such that they should be marketed together and/or to the same potential customers), as well as insight into geographical trends (which can inform decisions about deployment of sales force resources, marketing resources, and/or the like). Similarly, an enterprise often will engage in a merger or acquisition ofanother enterprise with a goal ofintegrating the product lines ofthe two enterprises; it is often hoped that this integration will result in a symbiotic relationship between the respective product lines. Merely by way of example, a cor poration selling a primary product might acquire another corporation selling a complementary product withthe goal of expanding the market of the complementary product and/or with the hope that sales of the complementary product will drive further sales of the primary product. To evaluate the ef?cacy of such an acquisition retrospectively (and, corre spondingly, to learn from that experience in order to inform future acquisition strategies), it would be helpful to be able to analyze the revenue performance of the primary and/or complementary product. Ideally, such analysis could be nor 20 25 30 35 40 45 50 55 60 65 2 malized (to account for other product lines which might also affect revenue performance, etc.). There are, however, obstacles to the use ofrevenue data in this fashion. The ?rst obstacle is in identifying patterns in the data. In the past, identi?cation of such patterns has been a difficult and labor-intensiveprocess, requiring personnel with both the data processing expertise to manipulate the data and the business expertise to understand how the data should be manipulated and/or understood. Business intelligence sys tems have remedied this problem somewhat, but the use of such systems typically still requires signi?cant data process ing expertise, often placing them out ofreach ofthe business people who can understand the meaning of identi?ed trends and make business decisions thereupon. Another obstacle to the employment of revenue data for decision support purposes is that, even if the data can be analyzed and trends identi?ed, it is difficult to convey these trends in a meaningful manner. Research shows that most humans intuitively can grasp information more readily which it is provided in a graphical format than when the information is provided numerically or textually. In some cases, the graphical presentation of data is a trivial matterifor example, a chronological series of numbers can easily be displayed as a line plot or a bar chart, with the horizontal axis representing a time scale. But when such data is multidimen sional, it becomes more dif?cult to convey that data graphi cally in a meaningful way. This problem is especially true when the display ofthe data is meant to provide geographical insight. For example, while applications such as Google EarthTM can be used to map relatively simple, one dimensional data onto a geographical display (such as a worldmap), this taskbecomes signi?cantly more complex when the data has no explicit geographical dimension, or when attempting to map multiple data sets with disparate geographical dimensions. Hence, there is a need for improved tools and techniques for analyzing data (in particular revenue data), and providing the results of that analysis in a meaningful way. BRIEF SUMMARY A set of embodiments provides tools and techniques for providing decision support to enterprises. Certain of these tools analyze and/or display information, including, in a par ticular aspect, revenue and/or other ?nancial information, in novel ways. These features can provide users with enhanced insight into the performance ofvarious product lines and/or into opportunities to enhance such performance, including (but not limited to) insight into the performance of two or more product lines in conjunction with one another. In another aspect, certain tools provide heretofore unavailable facilities for evaluating the success of an acquisition, for example, by providing insight into the market compatibility of an acquired product line with an existing product line. Yet other embodiments provide tools and techniques for generating map displays to graphically illustrate ?nancial performance. In one aspect, a map display might employ a coloration scheme that distinguishes among various ranked regions to illustrate, for example, revenue performance (which can be measured by any of a number of metrics), to allow a userto quickly understand the relative performance of a product line across a number of regions. In another aspect, a map display might correlate a ?rst set of revenue informa tion (or other ?nancial information) with other data sets, such as sales force data, competitive sales data, and/or the like, to allow a user to quickly identify correlative patterns in the two data sets. Such map displays might feature two maps side
  • 13. US 8,688,502 B2 3 by-side, or might superimpose a map of one data set over a map ofanother data set, to assist in the user’s visual analysis. The tools provided by various embodiments include, with out limitation, methods, systems, and/or software products. Merely by way of example, a method might comprise one or more procedures, any or all ofwhich are executed by a com puter system. Correspondingly, an embodiment might pro vide a computer system con?gured with instructions to per form one or more procedures in accordance with methods provided by various other embodiments. Similarly, a com puter program might comprise a set of instructions that are executable by a computer system (and/or a processor therein) to perform such operations. In many cases, such software programs are encoded on physical and/or tangible computer readable media (such as, to name but a few examples, optical media, magnetic media, and/or the like). Merely by way of example, a method in accordance with one set of embodiments comprises accessing revenue data, stored in a database, about a plurality ofrevenue transactions. In one aspect ofcertain embodiments, the revenue data might be created by an enterprise application, and/or the revenue data about each revenue transaction might identify an amount ofrevenue generated by a sale of one or more products by an enterprise. The method might further comprise providing a user interface for a user to interact with a data presentation system in communication with the database. In some cases, the method also comprises de?ning a geographical hierarchy for the revenue data, which might de?ne a plurality ofregions organizedhierarchically, and/or categorizing the revenue data according to the geographical hierarchy. In some embodiments, the method further comprises de?n ing a ranking scheme for the revenue data; in an aspect, the ranking scheme might comprise a plurality ofthresholds for segmenting the plurality of regions into a plurality of ranks, according to a revenue characteristic for each region. The method might further comprise de?ning a coloration scheme for the revenue data. The coloration scheme, in an aspect, de?nes a coloration pattern corresponding to each of the plurality of ranks. The method, then, may further include generating a map display in the user interface. In an aspect, the map display shows at least a subset of the plurality of regions de?ned by the geographical hierarchy for the revenue data, and each displayed region might a rank de?ned by the ranking scheme and a corresponding coloration pattern de?ned by the coloration scheme. A method in accordance with another set of embodiments comprises accessing revenue data, stored in a database, about a plurality ofrevenue transactions, providing a user interface for a user to interact with a data presentation system in com munication with the database, and receiving, via the user interface, selection ofa product line for analysis. The method might further comprise identifying a set of revenue transac tions corresponding to the selected product line, each of the revenue transactions in the set ofrevenue transactions having an associated customer, and/or identifying a set of customers associated with the set of revenue transactions. In some embodiments, the method further comprises ana lyzing each ofthe customers inthe set ofcustomers to identify an amount ofrevenue attributable to each customer, receiving a selection of a revenue characteristic of interest, and/or seg menting the set of customers into a plurality of subsets of customers, according to the selected customer characteristic ofinterest. The method might further comprise displaying, in the user interface, revenue information about at least one of the subsets of customers. Another set ofembodiments provides computer systems. A computer system in accordance with one embodiment com 20 25 30 35 40 45 50 55 60 65 4 prises one or more processors, along with a computer read able medium in communication with the one or more proces sors. The computer readable medium might have encoded thereon a set of instructions executable by the computer sys tem to perform one ormore operations. The set ofinstructions might include instructions to perform operations in accor dance with the methods described above. Similarly, an appa ratus might comprise a computer readable medium having encoded thereon a set of instructions executable by one or more computers to perform one ormore operations, including without limitation operations in accordance with the methods above. BRIEF DESCRIPTION OF THE DRAWINGS A further understanding of the nature and advantages of particular embodiments may be realized by reference to the remaining portions of the speci?cation and the drawings, in which like reference numerals are used to refer to similar components. In some instances, a sub-label is associated with a reference numeral to denote one of multiple similar com ponents. When reference is made to a reference numeral without speci?cation to an existing sub-label, it is intended to refer to all such multiple similar components. FIGS. 1-3 are process ?ow diagrams illustrating various methods ofanalyzing and/or displaying revenue information, in accordance with various embodiments. FIGS. 4 and 5 are process ?ow diagrams illustrating vari ous methods of mapping revenue data, in accordance with various embodiments. FIGS. 6-8 are exemplary screen displays depicting a user interface for displaying revenue information for a user, in accordance with various embodiments. FIG. 9 is an exemplary screen display depicting a user interface for displaying mapped revenue data for a user, in accordance with various embodiments. FIG. 10 is a generalized schematic diagram illustrating a computer system, in accordance with various embodiments. FIG. 11 is a block diagram illustrating a networked system of computers, which can be used in accordance with various embodiments. DETAILED DESCRIPTION OF CERTAIN EMBODIMENTS While various aspects and features ofcertain embodiments have been summarized above, the following detailed descrip tion illustrates a few exemplary embodiments in further detail to enable one of skill in the art to practice such embodiments. In the following description, for the purposes ofexplanation, numerous speci?c details are set forth in order to provide a thorough understanding of the described embodiments. It will be apparent to one skilled in the art, however, that other embodiments of the present may be practiced without some ofthese speci?c details. In other instances, certain structures and devices are shown in block diagram form. Several embodiments are described herein, andwhile various features are ascribed to different embodiments, it should be appreci ated that the features described with respect to one embodi ment may be incorporated with other embodiments as well. By the same token, however, no single feature or features of any described embodiment should be considered essential to every embodiment ofthe invention, as other embodiments of the invention may omit such features. In an aspect, certain embodiments provide a decision maker (or other user) with analysis of revenue performance for various products (or product lines). A product can be any
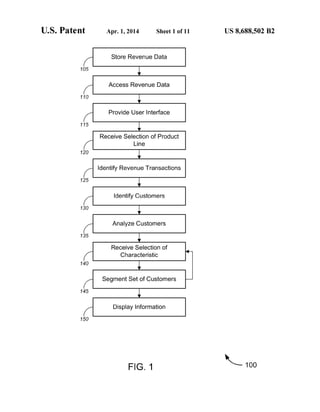
  • 14. US 8,688,502 B2 5 good or service that produces revenue for an operating entity (such as a corporation, etc.), such as through sales of a good, performance of a service, licensing of a software program or intellectual property, etc. In an aspect, a product line might comprise a group of (possibly related) products, and in another aspect, a product line might comprise a single prod uct. Hence, unless the context clearly indicates otherwise, the terms “product” and “product line” should be interpreted broadly and interchangeably when used herein. A set of embodiments provides tools and techniques for providing decision support to enterprises. Certain of these tools analyze and/or display information, including, in a par ticular aspect, revenue and/or other ?nancial information, in novel ways. These features can provide users with enhanced insight into the performance of various product lines and/or into opportunities to enhance such performance, including (but not limited to) insight into the performance of two or more product lines in conjunction with one another. In another aspect, certain tools provide heretofore unavailable facilities for evaluating the success of an acquisition, for example, by providing insight into the market compatibility of an acquired product line with an existing product line. Yet other embodiments provide tools and techniques that generate map displays to graphically illustrate ?nancial per formance. In an aspect, a map display might employ a col oration scheme that distinguishes among various ranked regions to illustrate, for example, revenue performance (which can be measured by any of a number of metrics), to allow a user to quickly understandthe relative performance of a product line across a number of regions. In another aspect, a map display might correlate a ?rst set of revenue informa tion (or other ?nancial information) with other data sets, such as sales force data, competitive sales data, and/or the like, to allow a user to quickly identify correlative patterns in the two data sets. Such map displays might feature two maps side by-side, or might superimpose a map of one data set over a map ofanother data set, to assist in the user’s visual analysis. FIGS. 1-6 illustrate various methods that can be used to map ?nancial information to geographic areas, analyze ?nan cial information, and/or display such mapped and/or ana lyzed ?nancial information. While the methods of FIGS. 1-6 are illustrated, for ease ofdescription, as different methods, it should be appreciated that the various techniques and proce dures of these methods can be combined in any suitable fashion, and that, in some embodiments, the methods depicted by FIGS. 1-6 can be considered interoperable and/or as portions ofa single method. Similarly, while the techniques and procedures are depicted and/or described in a certain order for purposes ofillustration, it should be appreciated that certain procedures may be reordered and/or omitted within the scope ofvarious embodiments. Moreover, these methods (and/or portions thereof) may also be implemented using any suitable hardware implementation, including without limita tion as software programs installed (and/or installable) on the computer systems described in detail below. FIGS. 1-3 are process ?ow diagrams illustrating various methods ofanalyzing and/or displaying revenue information, in accordance with various embodiments. For example, FIG. 1 illustrates a method 100 of displaying information about revenue produced by an analysis ofrevenue from one or more product lines, in accordance with one set of embodiments. In the illustrated embodiment, method 100 comprises stor ing (e.g., in a database) data about a plurality of transactions (block 105). In a particular aspect of some embodiments, this data might be revenue data that pertains to revenue transac tions. A “revenue transaction” can be any transaction that produces revenue for an entity, such as a corporation. 20 25 30 35 40 45 50 55 60 65 6 Examples of revenue transactions can include sales transac tions in which goods and/or services are transferred in return for some form ofpayment, license transactions (e.g., sales of software licenses, licenses to intellectual property, etc.), and/ or the like. In one aspect, the revenue data may be created by an enterprise application, and/or the revenue data about each revenue transaction identifying an amount of revenue gener ated by a sale of one or more products (e.g., goods, services, licenses, etc.) by an enterprise. Revenue data about a particu lar transaction can include, without limitation, identi?cation of a selling entity (and/or licensor), identi?cation of a pur chasing entity (and/or licensee), identi?cation of a product and/or product line purchased (and/or licensed), identi?ca tion of a quantity of the product purchased, a unit price, a gross sales amount, and/or a revenue amount (if different from the gross sales amount). In some cases, the database might include revenue transactions pertaining to sales of a product as well as revenue transactions related to services provided in connection with that product. In one aspect, these two data sets might both be treated as being associated with that product. In many cases, data used by various embodiments (includ ing without limitation revenue data) may be stored in a data base and/or a data warehouse. Merely by way of example, in a typical embodiment, a business application (also referred to herein as an “enterprise application”), which may be respon sible for tracking and/or accounting for many types of busi ness transactions, including without limitation revenue trans actions, may store data about one or more revenue transactions in a database. (Examples of enterprise applica tions can include, without limitation, one or more applica tions such as those available in Oracle e-Business SuiteTM, Oracle Fusion ApplicationsTM, PeopleSoft EnterpriseTM, JD Edwards EnterpriseOneTM, and Siebel CRMApplicationsTM, all of which are commercially available from Oracle Corp.) An automated process, such as an extract-transform-load (“ETL”) process may loadthis data into a data warehouse. For purposes of this disclosure, a data warehouse can be consid ered to be to be a specialized database for storing and/or analyzing data about large numbers oftransactions. Embodi ments may be used with transaction data stored in either a database and/or a warehouse, as well as other data storage mechanisms. Hence, as used herein, the term “database” means any appropriate data structure for storing data used by various embodiments; such data structures can include, with out limitation, relational databases, non-relational databases, ?le systems, data warehouses, and/or the like. At block 110, the method 100 comprises accessing data (e.g., revenue data) stored in the database. Often, the proce dures for accessing the data may vary according to the nature ofthe database in which the data is stored; merely by way of example, many relational database management systems and data warehouse management systems provide mechanisms, such as SQL calls, stored procedures, etc., to provide access to data stored in databases managed by those systems, and such mechanisms may be used as appropriate. While the revenue data may be stored merely as a series of transaction records each pertaining to a particular revenue transaction (each transaction having associated details, such as customer identity, revenue amount, product/product line sold, etc.), it should be appreciated that the revenue data can be catego rized in many ways; for example, the revenue data might be categorized as multiple sets ofrevenue data, each associated with a particular customer; as another example, the revenue data might be categorized as multiple sets of revenue data, each pertaining to revenue generated by sales of a set of one or more products in a particular product line.
  • 15. US 8,688,502 B2 7 The method 100 further comprises, in some embodiments, providing a user interface (block 115). In an aspect, this user interface can provide the user with the ability to interact with a data presentation system. (This data presentation system, which may be in communication with the database and/or may be responsible for accessing the data in the database, may also perform many ofthe analysis and/or display func tions described herein.) For example, the user interface can be used to output infor mation for a user, e.g., by displaying the information on a display device, printing information with a printer, playing audio through a speaker, etc.; the user interface can also function to receive input from a user, e.g., using standard input devices such as mice and other pointing devices, key boards (both numeric and alphanumeric), microphones, etc. The procedures undertaken to provide a user interface, there fore, can vary depending on the nature ofthe implementation; in some cases, providing a user interface can comprise dis playing the user interface on a display device; in other cases, however, where the user interface is displayed on a device remote from the computer system (such as on a client com puter, wireless device, etc.), providing the user interface might comprise formatting data for transmission to such a device and/or transmitting, receiving and/or interpreting data that is used to create the user interface on the remote device. Alternatively and/or additionally, the user interface on a client computer (or any other appropriate user device) might be a web interface, in which the user interface is provided through one or more web pages that are served from a computer system (and/or a web server in communication with the com puter system), and are received and displayed by a web browser onthe client computer (or other capable user device). The web pages can display output from the computer system and receive input from the user (e.g., by using Web-based forms, via hyperlinks, electronic buttons, etc.). A variety of techniques can be used to create these Web pages and/or display/receive information, such as JavaScript, Java appli cations or applets, dynamic HTML and/or AJAX technolo gies. In many cases, providing a user interface will comprise providing one or more display screens (a few examples of which are described below), each of which includes one or more user interface elements. As used herein, the term “user interface element” (also described as a “user interface mecha nism” or a “user interface device”) means any text, image or device that can be displayed on a display screen for providing information to a user and/or for receiving user input. Some such elements are commonly referred to as “widgets,” and can include, without limitation, text, text boxes, text ?elds, tables and/or grids, charts, hyperlinks, buttons, lists, combo boxes, checkboxes, radio buttons, and/or the like. While the exemplary display screens described herein employ speci?c user interface elements appropriate for the type of informa tion to be conveyed/received by computer system in accor dance with the described embodiments, it should be appreci ated that the choice ofuser interface element for a particular purpose is typically implementation-dependent and/or dis cretionary. Hence, the illustrated user interface elements employed by the display screens described herein should be considered exemplary in nature, and the reader should appre ciate that other user interface elements could be substituted within the scope of various embodiments. As noted above, in an aspect of certain embodiments, the user interface provides interaction between a user and a com puter system. Hence, when this document describes proce dures for displaying (or otherwise providing) information to 20 25 30 35 40 45 50 55 60 65 8 a user, orto receiving input from a user, the user interface may be the vehicle for the exchange of such input/output. Inthe illustrated embodiment, the method 100 further com prises receiving a selection of one or more product lines for analysis (block 120). In many embodiments, the selection is received as user input via the user interface. Merely by way of example, in some embodiments, the user may be provided with a list of product lines (e.g., in a drop box or other appropriate interface element), may be provided with a text input ?eld to specify a product line, and/or the like. As noted above, some cases, a product line might simply identify a single product, while in other cases, a product line might identify multiple products (e.g., a family ofrelated products). In particular embodiments, a usermight select multiple prod uct lines to be analyzed against one another, as described in further detail below. At block 125, the method 100 comprises identifying a set ofrevenue transactions corresponding to the selected product line. Merely by way of example, in a set of embodiments, identifying a set of revenue transactions might comprise searching the database in which the revenue data is stored, using an identi?er of the selected product line as a search criteria. As noted above, in many cases, the database will comprise data (e.g., a series of records) about revenue trans actions; each ofthese records might have a ?eld for identify ing a product and/or product line, such that the database can be searched for records in which the value of that ?eld matches a search criterion provided by the user when select ing a product line for analysis. (In some embodiments, the procedures for identifying the set ofrevenue transactions and for accessing revenue data might be consolidated into the same set of operations.) In certain embodiments, the method 100 further comprises identifying a set of customers associated with the identi?ed set of revenue transactions (block 130). Merely by way of example, in some embodiments, the search results might be a set ofrecords in the database that all have a product or prod uct-line identi?er that matches the product line speci?ed by the user. Each of these records might also have a customer identi?er ?eld, and the records thus can be analyzed to iden tify the customer from the value in this ?eld. From this analy sis, a set of customers can be identi?ed from the set oftrans actions pertaining to the product line of interest. The method 100 might further comprise analyzing some or all of the customers in the identi?ed set of customers (block 135). In an aspect, this analysis might include identifying an amount of revenue attributable to each customer (either on a per-transaction basis or as a collective amount), for example, by analyzing a revenue ?eld in each record for each customer, and optionally consolidating the revenue values across mul tiple records (representing multiple revenue transactions) for a single customer. At block 140, the method 100 comprises receiving a selec tion ofone or more revenue characteristics ofinterest. As used herein, the term “revenue characteristic” means any charac teristic of a revenue transaction that can be used to differen tiate, sort, categorize, and/or distinguish between individual revenue transactions and/or between sets or groups ofrevenue transactions. These characteristics ofinterest, as described in further detail below, can be used to segment and/or analyze the data for the identi?ed customers. In some aspects, the selection of characteristic(s) of interest is received from the user, via the user interface, in a manner similar to the way in which the product lines ofinterest are selected. In accordance with different embodiments, a wide variety of revenue char acteristics may be available for the user to select, and/or the
  • 16. US 8,688,502 B2 analysis and/or segmentation ofthe data may vary according to the selected revenue characteristic(s). Some revenue characteristics may pertain primarily to products and/orproduct lines. Merely by way ofexample, one possible revenue characteristic is revenue earned on sales ofa product line (e.g., over a speci?ed period). Using this revenue characteristic, product lines may be sorted, ranked, differen tiated, etc. according to the revenue generated from those product lines (as calculated from some or all ofthe identi?ed revenue transactions that pertain to each product line). Other examples of such revenue characteristics are described in further detail below. Another type of revenue characteristic that can be sup ported by various embodiments is a revenue characteristic that pertains primarily to customers. For example, customer size is a revenue characteristic that might be selected by a user that wanted to analyze the revenue data according to the size ofthe customers (e.g., companies, etc.) thatparticipated inthe identi?ed revenue transactions. Using this characteristic, a user could view results of analysis of revenue by customer size (e.g., to determine how much ofthe revenue was gener ated from customers falling within various size categories determinedby thresholds speci?edby the user, precon?gured by the system, etc.). Similarly, customer identity is a revenue characteristic that can be used to generate, for example, a list of customers ranked by revenue. Other revenue characteris tics can include, without limitation, customer industry seg ment, whether the customer has purchased a competing prod uct from another vendor, and customer region (which can be used with the mapping tools provided by other embodiments, as described below), to name a few examples. In some cases, multiple revenue characteristics might be selected. For example, the user might select product line and customer identity characteristics, which could be used to generate a plurality of lists of customers ranked by revenue, with each list pertaining only to revenue generated by one (or more) ofthe product lines. From these examples, one skilled in the art should appreciate that various embodiments can provide users with a variety ofdimensions by which revenue data can be analyzed, through the selection of different rev enue characteristics for analysis. In an aspect ofcertain embodiments, the method 100 might include segmenting the set of customers into two or more subsets (block 145). Merely by way of example, in some embodiments, the set ofcustomers is segmented according to the characteristic ofinterest speci?edby the user. In an aspect, this segmenting may comprise classifying each customer into one oftwo or more groups, according to the characteristic of interest. So, for example, if the characteristic of interest is revenue earned over the course of a year, the customers might be divided into quartiles (or any other appropriate division, which might be speci?ed by user input, by default business rules, and/or the like). As illustrated by FIG. 1, the operations of receiving a selection ofa characteristic ofinterest and segmenting the set of customers may be performed iteratively. For example, the set of customers may be segmented into two subgroups according to a ?rst characteristic ofinterest, and one (or both ofthose subgroups) might be further segmented by a second characteristic of interest. Thus, for example, the set of cus tomers might be segmented into quartiles according to an amount ofrevenue earned from sales of a particular product, and the top quartile (or all of the quartiles) might be further segmented into quintiles by customer size. To further illustrate how a group of customers may be segmented in accordance with one embodiment, FIG. 2 illus trates a method 200 that may be employed to segment a group 20 25 30 35 40 45 50 55 60 65 10 ofcustomers according to a revenue characteristic ofinterest. At block 205, the method comprises assigning ranks to each ofthe customers in the set of customers. In an aspect, assign ing a rank to a customer might comprise sorting the set of customers (e.g., from high to low, etc.) according to the value of the characteristic of interest for that customer. So, for example, ifthe characteristic ofinterest is revenue earned, the method might comprise ?nding each transaction (during the period of interest) that involved that customer and summing the revenue values of each of those transactions to obtain an overall revenue amount for that customer. After these proce dures have been performed for every customer in the set, the set can then be sorted by the overall revenue amount for each customer, from high to low. After being sorted, the customers can then be ranked according to the sort order. The method 200 may further comprise de?ning a segmen tation scheme for the set of customers (block 210). In an aspect, the segmentation scheme might divide the set of cus tomers in to a speci?ed number of subsets of customers, according to the rank assigned to each customer. Merely by way ofexample, if segmentation into quartiles is desired, the segmentation scheme might divide the set of customers into four equally-sized subsets, with the ?rst subset comprising the customers generating the largest revenue for the company (i.e., the “largest” customers), and so forth. In some cases, the segmentation scheme may be speci?ed by application defaults, by business rules, and/or the like. In other cases, the user might be provided with the ability (using appropriate user interface elements) to specify a desired segmentation scheme. In some cases, it is useful for decision makers to under stand how overall revenue breaks down among the customers. For instance, if a majority of revenue is generated from a select few customers, it may be to the company’s advantage to focus particularly on attracting additional revenue from those customers. Conversely, the company might wish to focus on “smaller customers” in an attempt to diversity its revenue base. In either case, it may be bene?cial for a decision maker to see how the revenue from a particular product line (or overall revenue, if desired) is distributed among different classes of customers. Accordingly, in an embodiment, the method 200 further comprises calculating an amount of revenue attributable to each subset of customers (block 215), as de?ned by the seg mentation scheme. For instance, once the set ofcustomers has been segmented into quartiles (or any other breakdown), the revenue from all of the customers in each quartile can be summed to produce a consolidated revenue amount for that quartile. The method 200, then, may further comprise dis playing the amount of revenue attributable to each subset of customers (block 220), e.g., using the display techniques described in further detail below. Returning to FIG. 1, the method 100 further comprises displaying, for a user, (block 150) information about revenue attributable to at least one of the subsets of customers. In an aspect, this information may be displayed in a user interface, and/or it might employ one or more graphical and/or textual user interface elements to display the information. The nature of the display will depend, on many cases, on the type of information being displayed, and a number ofdifferent types of information might be displayed, depending on the type of analysis requested by the user. In some cases, the displayed information might include revenue amounts attributable to one or more customers (or one or more subsets of customers, as described above). In other cases, however, the revenue amounts might not be displayed. Merely by way ofexample, in a particularembodi
  • 17. US 8,688,502 B2 11 ment, a user might seek to understand af?nity between two product lines, and the display might comprise a representa tion (either graphical, textual, or both) that provides a ranked list of one or more products with the highest af?nity to the selected target product, without regard to the amount of rev enue generated from each of the products. In other cases, however, the representation might also include revenue amountsifor instance, in the af?nity example, the list of products might be ordered by revenue amount but might also be accompanied by an indication of the amount of revenue generated from sales of each product made in conjunction with sales of the selected target product. Further, in some embodiments, whether or not actual rev enue amounts are displayed, the user interface may provide users with the ability to drill into the displayed information to produce additional information. Different embodiments may support a widevariety of“drill-down” capabilities. Merely by way of example, as indicated below, certain embodiments provide the ability for a user to drill from a map display into various data (whichtypically will be, but neednot necessarily be, related to information, such as products, sales force, regions, etc. corresponding to the map display itself). Like wise, certain embodiments can provide the ability for user to use any of the displays described herein to drill into further information (which may be, but need not necessarily be) relatively more focused, detailed, and/or speci?c. This drill down feature may be implemented recursively, allowing a user to journey further into progressively more detailed and/ or focused information, as the user drills from display screen to display screen. Correspondingly, however, various embodiments may provide the user with the ability to “drill up” into more summary information, and/or traverse between different types ofdata (e.g., progressively from general sales data, to data about a speci?c product, to data about a sales force responsible forthatproduct, to general sales force data), by selecting appropriate user interface elements to drill into the desired information. For instance, continuing with the af?nity example, the user interface may provide a user interface element (which may be a portion ofthe displayed information itself, which may serve as a hyperlink, etc., and/or may be a corresponding element, such as a button, etc.) that allows the user to request the display ofmore detailed information about a particular prod uct in the af?nity list. In some cases, an additional user inter face element might be provided to allow the user to provide input on what type of information the user would like to drill into. To illustrate, ifthe display provides a graphical illustration of ten products with af?nities to the selected target product, the usermight be given the ability to select one ofthe products (e.g., by clicking on that product in the display) to drill into further information about that product. Such further informa tion might include overall revenue information for that prod uct (without regard to whether the revenue was generated in conjunction with a sale of the target product), historical rev enue information, largest customers for that product, etc. A separate user interface element might allow the user to select which of these areas (or others), the user would like to drill into. In fact, certain embodiments may be considered recur sive, in that selecting some portion ofthe displayed informa tion might restart the method 100, with the selected informa tion acting as the target for a new set of analysis. A user interface in accordance with one set of embodi ments might be con?gured to display a dashboard display, one example ofwhich is depicted by FIG. 6 and described in further detail below. In an exemplary embodiment the dash board display might comprise a plurality of panels, each 20 25 30 35 40 45 50 55 60 65 12 displaying information about revenue attributable to one or more subsets ofcustomers; some ofthe panels might present information graphically (e.g., using charts, images, and/or other graphical devices), while others might present informa tion textually (e.g., using lists, tables, and/or the like). In accordance with various embodiments, many different types of information may be displayed by the user interface (e.g., using dashboard panels). Merely by way ofexample, in many embodiments, the user interface might display sorted lists of customers (e.g., customers that have been segmented into a particular subgroup). In other embodiments, the user interface might display revenue ?gures for one or more groups of customers. Such revenue ?gures can include, inter alia, revenue earned on one or more particular product line, revenue earned over one or more particular period, in one or more particular regions. In particular various embodiments can be used to provide deep analysis ofrevenue patterns based on customer characteristics, including without limitation rev enue earned on sales to customers ofa certain size, customers in certain industry segments, a competitor’s customers, and/ or the like. In particular, embodiments allow revenue to be broken out according to these characteristics to allow com parative analysis. In some cases, the user may be given the option to view revenue data about multiple product lines (e.g., a comparative analysis of revenue across multiple product lines). Hence, FIG. 3 illustrates a method 300 of displaying revenue infor mation about multiple product lines. In a particular embodi ment, the method 300 may be integrated with the method 100 described above. Merely by way of example, in some cases, the revenue characteristic of interest might be an amount of revenue earned onthe sales ofone ormore products otherthan one or more selected (target) product(s) or product line(s). The method 300, then, might comprise, at block 305, identi fying a plurality of product lines, other than the selected product line(s), that each also have generated revenue attrib utable to a set of customers who also purchased the selected product line (e.g., customers identi?ed as being associated with revenue transactions that correspond to the selected product line). The method 300 might furthercomprise assign ing a rank to each ofthese identi?edproduct lines (block 310). In different embodiments, different criteria might be used to rankthe identi?ed product lines. By way ofexample, product lines might be ranked based on the amount of revenue gen erated by each respective product line and attributable to the identi?ed set of customers, by a number ofproducts sold (to the identi?ed set ofcustomers) in eachproduct line, and/orby an amount ofcustomers purchasing each product line. In this situation, displaying information about the attributable rev enue might comprise displaying information about at least some of these identi?ed product lines (block 315). This dis play might be based on the rank assigned to each of the identi?ed product lines. To illustrate, if the system identi?es one hundred custom ers as purchasing the target product (i.e., as being associated with one or more revenue transactions corresponding to the target product), it might then identify twenty-?ve other prod ucts also purchased by one or more of those one hundred customers, and then rank those twenty-?ve products accord ing to the collective amount of revenue each generated from the one hundred customers. The system might then display information about the top ?ve ranked products (other than the target product); such information might include, merely by way of example, an identi?cation of each displayed product, a collective amount of revenue generated from sales of each product to the customer set, and/or the like. As noted above, such a display might be textual and/or graphical in nature. In
  • 18. US 8,688,502 B2 13 this way, the system can enable a decision maker to quickly ?nd af?nities between a target product and other products. As noted above, certain embodiments can provide insight into geographical revenue trends, e.g., by mapping and dis playing revenue data. FIGS. 4 and 5 are process ?ow dia grams illustrating various methods 400 and 500, respectively, ofmapping revenue data, in accordance with various embodi ments. In many cases, the mapping of data (including in particular revenue data) is useful to show relative perfor mance of various regions (e.g., sales territories countries, states, etc.) in generating revenue. Accordingly, in an aspect, the ?rst method 400 can be employed to generate a map with a ranked display of the relative performance of various regions, while the second method 500 can be used to correlate two data sets and/or to map the correlated data sets. In an aspect, the methods 400 and/or 500 can operate on similar data to that used by the methods 100, 200, and 300 of FIGS. 1-3 and, in fact, can often be combined with those methods (e.g., to display a map ofrevenue data as one panel on a dashboard). Accordingly, the method 400 comprises several operations that are similar to those ofthe method 100, including without limitation storing revenue data (e.g., data about a plurality ofrevenue transactions) in a database (block 405), accessing the revenue data (block 410) and providing a user interface for user to interact with a data presentation system in communication with the database (block 415). In some embodiments, the revenue data might pertain to a speci ?ed of revenue transactions (including, for example, a set of revenue transactions that correspond to a particular product line, customer, customer set, etc.). Merelybyway ofexample, the methods 100-300, and/or various portions thereof, might be used to identify the set ofrevenue transactions about which revenue data should be retrieved from the database and/or analyzed. For instance, in a particular embodiment, a user might select a product line in the manner described above, and the revenue data associated with transactions corresponding to that product line might be used in the method 400 of FIG. 4. The method 400 further comprises receiving user input via the user interface (block 420). A variety of different types of user inputs might be used to specify how mapped data should be displayed, as described in further detail below. Merely by way of example, a user may provide input to specify a par ticular set ofrevenue data to be analyzed and/or mapped (e.g., to identify a product for analysis, to identify a time period for analysis, etc.), to specify a type of analysis to perform, to indicate a desired geographical hierarchy (and/or a level of a given geographical hierarchy to display on a map), to specify one or more thresholds to de?ne a ranking scheme, to indicate one or more desired colors to be used on a map display, and/or to select a region of a map display, to name a few examples. Depending on the type of input that the user is to provide, various embodiments may provide a variety of different user interface elements to receive such input. Merely by way of example, a color palette may be provided to allow a user to select colors, while a list of threshold values and/or a text input box might be provided to allow a user to specify thresh old values. In some embodiments, user input to select a mapped region may be received as a mouse click on the selectedregion in a map ofa larger area (e.g., a mouse click on a continent in a world map). Based on these examples, one of skill in the art should appreciate that a wide variety of user interface elements may be used by various embodiments, and that these examples should not be considered limiting. At block 425, the method 400 comprises de?ning a geo graphical hierarchy by which the revenue data should be categorized. In an aspect, a geographical hierarchy de?nes a 20 25 30 35 40 45 50 55 60 65 14 plurality of regions that may be organized hierarchically. Merely by way of example, a geographical hierarchy might comprise a ?rst hierarchical level that includes the entire world. That geographical hierarchy might include a second hierarchical level that comprises several regions (e.g., North America; Latin American and the Caribbean; Europe, the Middle East, andAfrica (“EMEA”); andAsia Paci?c. A third hierarchical level might include individual countries, and a fourthhierarchical level might includes intra-national regions or subdivisions where appropriate (e.g., states in the US, cantons in Switzerland, provinces in Canada, etc.). In another example, a geographical hierarchy might include a ?rst level comprising the United States, a second level including regions within the United States (e.g., Paci?c, Rocky Moun tain, North, South, and East), a third region including indi vidual states, and a fourth level including individual counties (or, in some cases, metropolitan areas, etc.). In an aspect, the regions de?ned at one level ofthe geographical hierarchy can be considered sub-regions of a region at a higher level ofthe hierarchy. For example, a geographical might de?ne the United States as a region at a top level of the hierarchy and de?ne each individual state as a region at a second level ofthe hierarchy; in this example, the states can be considered to be sub-regions of the United States. In some cases, a geographical hierarchy might be de?ned based, at least inpart, onuser input. For example, a user might select a desired geographical hierarchy in the user interface. In other cases, a geographical hierarchy might be de?ned without user input at all, based, for instance, on a set of stored business rules that specify how a geographical hierarchy should be de?ned, and/or based on a geographical hierarchy speci?ed by the ?nancial data itself (e.g., in cases in which eachtransactionrecordhas a geographical dimension, such as a sale location, customer location, etc.). At block 430, the method 400 comprises categorizing the data according to the geographical hierarchy. In many cases, each data element (e.g., transaction record, etc.) in the set of ?nancial data might have either a geographical dimension or another dimension from which a geographical dimension can be derived. For example, some companies might track their revenue data according to, inter alia, sales region. This dimen sion can be considered a geographical dimension and can be used to categorize the data according to the geographical hierarchy. In some cases, the geographical dimension of the data elements might correspond to a different (second) geographi cal hierarchy than the hierarchy de?ned for categorizing the data (the ?rst geographical hierarchy, in this example). Merely by way of example, the de?ned geographical hierar chy might be the ?rst hierarchy described above (with the world at the ?rst level, various intercontinental regions at the second level, and individual countries at the third level), while the ?nancial data might include a geographical dimension that is non-hierarchical (i.e., organized by a geographical hierarchy that has only one level, such as the country ofsale). As another example, some ofthe data might be organized by the ?rst geographical hierarchy, while other data is organized according to a second hierarchy. This situation is common, for example, in the case of an acquisition, in which the sales territories of the acquisition do not align precisely with the sales territories of the acquirer. In the past, such situations made an integrated analysis ofthe inconsistent data dif?cult, if not impossible. In such cases, the method 400 (and/or more precisely, the categorization ofthe data according to the geographical hier archy) might include translating the geographical dimension of each ?nancial data element from the second geographical
  • 19. US 8,688,502 B2 15 hierarchy to the ?rst geographical hierarchy (block 435). This can allow for the analysis and/or mapping of data from dis parate sources and/or of legacy data that was collected using a different geographical hierarchy than the hierarchy that should be used to map the data. In one aspect, this translation can be facilitated by the use ofa translation table, which maps locations in one hierarchy to locations in another hierarchy. A number oftranslation tables may be employed in accordance with different embodiments, and these translation tables may be created programmatically and/or manually. In a set of embodiments, translation tables, once created, can be reused as needed. In some cases, the transaction records may be updated with new hierarchy-speci?c location information, such that the translation need only be performed once for a given data element. In other cases, the translation may be performed at run time, recognizing that different geographi cal hierarchies may be used for different types ofanalyses. In still other embodiments, a hybrid procedure may be used, in which data elements are normalized to a standard hierarchy, and then that standard hierarchy can be translated to a use speci?c hierarchy as needed. It should be noted that this translation procedure may be used iteratively. if necessary. For example, a given dataset might include a ?rst set of data elements with a geographical dimension that corresponds to a ?rst geographical hierarchy and a second set ofdata elements with a geographical dimen sion that corresponds to a second geographical hierarchy. However, the desired analysis might require the use ofa third geographical hierarchy. In this case, the ?rst set of data ele ments might be translatedwith a ?rst translation table, and the second set ofdata elements might be translated with a second translation table. In other cases, the data might not have a geographical dimension per se, but it might include another, non-geo graphical dimension from which a geographical dimension can be derived. Merely by way of example, a sales record might not have any explicit geographical information, but it might include a sales department code for the department to which the sale was attributed. In this case, a translation table might translate department codes into a geographical dimen sion (e.g., by translating each sales department code into a location value corresponding to the sales territory for that respective sales department). In either case, the method 400 can include categorizing each data element (e.g., transaction record) into its appropriate location in the geographical hier archy, according to whatever geographical information is available in the data and/or whatever geographical informa tion can be derived from the data. At block 440, the system analyzes the data. In one aspect, analyzing the data might comprise calculating a collective value of the categorized data for each region to be mapped, according to the de?ned geographical hierarchy. The nature ofthis calculation typically will depend on the type ofmetric the user would like to have mapped (which also determines which revenue data is selected at block 410, above). Merely by way of example, if the user would like to see a map of year-over-year revenue growth for each country (as illus trated in FIG. 9, for instance), the analysis typically would involve, foreach country to be displayed, calculating the prior year’s revenue (e.g., by summing the revenue values in all of the transaction records corresponding to that country for the prior ?scal year), calculating the current year’s revenue (in similar fashion), and subtracting the ?rst value from the sec ond. Different calculations could be used to analyze different metrics (e.g., overall revenue earned over a given period, number ofsales over a given period, average revenue per sale, etc.). 20 25 30 35 40 45 50 55 60 65 16 In some embodiments, the data are analyzed at the level of the geographical hierarchy that is to be displayed (which might be speci?ed by the user, set by default, etc.). In other cases, however, the data are analyzed at the lowest level possible, and then the results of the analysis are “rolled up” the geographical hierarchy to the level at which the map will be displayed. This technique canbeuseful, forexample, when a user desires to “drill into” the map to obtain detail at a lower level of the hierarchy (as described further below), as the lower-level analysis will have been performed already. (Of course, there are alternatives that would still allow a user to “drill into” a speci?ed region without using roll-up analysis; merely by way of example, the data could be re-analyzed at the newly-selected level ofthe hierarchy ifnecessary.) As noted above, the mapping techniques disclosed herein are particularly useful to analyze the respective performance of (or in) various geographical regions. Accordingly, in one set of embodiments, the method 400 comprises de?ning a ranking scheme for the data to be mapped (block 445). In an aspect, the ranking scheme comprises one or more thresholds for segmenting the regions in the geographical hierarchy into a plurality of ranks, according to a revenue characteristic of each region. In another aspect, this revenue characteristic comprises the metric by which the data is analyzed, as described above. In some cases, the thresholds are absolute thresholds (e.g., speci?c revenue ?gures, speci?c amounts of growth, etc.), while in other cases, the thresholds are relative thresholds (e.g., percentile thresholds, quartile thresholds, etc.). In certain embodiments, the thresholds are set based on user input (e.g., user input specifying that the regions should be divided into quartiles; user input specifying that a ?rst threshold should correspond to a ?rst revenue amount, that a second threshold should correspond to a second revenue amount, etc.; and/or the like). In other embodiments, the thresholds may be determined without user input (e.g., based on an analysis of the data and/or business rules). Merely by way ofexample, ifoverall revenue per region is to be mapped, and ifthe analysis ofthe data indicates that every region had earned revenue between $0 and $500 million during the rel evant period, with the majority of regions earning between $10 million and $100 million, the system might determine that the appropriate thresholds should be <$10 million, $10 million-$25 million, $25 million-$50 million, $50 million $100 million, $100 million-$200 million, and >$200 million. At block 450, the method 400 comprises de?ning a colora tion scheme for the data. In an aspect, the coloration scheme de?nes a coloration pattern for each rank de?ned by the ranking scheme. In accordance with various embodiments, a colorationpatternmight comprise any color, a pattern, and/or any other display characteristic that visually distinguishes regions ofone rank from regions ofanother rank. As with the thresholds, the coloration scheme (and/or the individual col oration patterns thereof) may be de?ned either based on user input and/or automatically (e.g., based on system defaults, etc.). Merely by way of example, a user might select two or more colors, patterns, etc. (e.g., from a color palette provided by the user interface) and assign each of those colors, etc. to one ofthe ranks de?ned by the ranking scheme. In a particular embodiment, a coloration scheme might employ the same base color, in different shades, to illustrate different ranks de?ned by the ranking scheme, for example with the highest rank being the darkest color and the lowest rank being white (or blank), with progressive gradations of shading indicating intermediate ranks. The method 400 further comprises generating a map dis play in the user interface (block 455). In an aspect, the map
  • 20. US 8,688,502 B2 17 display shows at least a subset of the regions de?ned by the geographical hierarchy (and, in many cases, it will display all ofthe regions at a particular level ofthe geographical hierar chy). Each ofthe displayed regions, ofcourse, typically will have a rank de?ned by the ranking scheme and a correspond ing coloration pattern de?ned by the coloration scheme. FIG. 9, described in detail below, illustrates a user interface with a map display generated in accordance with the method 400. In some cases, the method 400 (and/or portions thereof) may be used iteratively. Merely by way of example, in one embodiment, the user interface might receive user input selecting a displayed region (e.g., a “click” on one of the regions, a selection of a region from a menu, etc.), which might cause the system to implement any portions of the method 400 necessary to redraw the map (i.e., generate a new map display in the user interface) with a different scope; in other words, ifthe user selects a particular region, the system might generate a second map to display each of the sub regions (as de?ned by the geographical hierarchy) of the selected region. For instance, if a user selects the United States on a displayed map of the world, the system might generate a map display showing only the United States, with each of the states displayed according to a ranking scheme and/or coloration scheme. In some cases, the new map might be generated with the same ranking scheme and/or coloration scheme (in which case the operations for de?ning those schemes might be omitted), while in other cases it may be appropriate to rede?ne ranking and/or coloration schemes for the more speci?c map display (for example, when showing overall revenue, the ranking scheme for a world map might not provide an effective display for a map of the US only, in which each the revenue scale might be signi?cantly lower). Hence, certain embodiments provide a userwith the ability to drill into a speci?c region to see data at a lower level ofthe geographical hierarchy. Other options may be available as well. Merely by way of example, in some cases, rather than displaying a lower-level map, the system might, upon receiv ing a selection of a region, display ?nancial data (e.g., using the techniques discussedwith respect to FIGS. 1-3) speci?c to that region. Hence, the use of map displays allows users to obtain ?nancial performance information (and otherinforma tion) quickly and easily, particularly with respect to a region (at any desired level ofthe geographical hierarchy) in which the user is interested. For instance, a user could drill from a displayed region in a geographical map into ?nancial performance for that region (either overall, for a speci?c product line, etc.), to drill in to sales force information for that region (e.g., identities and/or performance metrics of sales representative(s) for that region), to drill into pipeline/sales channel information for that region, and/or the like. Moreover, as noted above, certain embodiments provide the user with the ability (e.g., using appropriate user interface elements) to drill down into more speci?c/focused/detailed information (either along a geo graphical dimension, such as into a lower level in a geo graphical hierarchy, or along another dimension, such as divi sion, product line, speci?c performance metrics, etc.), to drill up into more general information (again, along any appropri ate dimension), or traverse across different dimensions of data (e.g., from revenue totals, to sales force information, to pipeline information). In some cases, it is useful to be able to map correlated data. For example, it might be useful to view revenue performance for two different products in the same geographical hierarchy, or to view revenue performance correlated with sales force data (e.g., number of sales people assigned to a particular region, changes in that number, etc.). Accordingly, FIG. 5 20 25 30 35 40 45 50 55 60 65 18 illustrates a method 500 that can be used to map correlated data. In one aspect, the method 500 of FIG. 5 can be imple mented with the method 400 ofFIG. 4 to display a ?rst set of data (e.g., revenue data) along with another, second set ofdata that is correlated the ?rst set of data. The method 500 comprises accessing the second set data in a database (block 505), which may be (but need not be) the same database as the database in which the ?rst set of data is stored; categorizing the second set of data (block 510), e.g., according to the same geographical hierarchy used to catego rize the ?rst set of data, receiving user input (block 515); analyzing the second set ofdata (block 520); de?ning a rank ing scheme for the second set of data (block 525); and de?n ing a coloration scheme for the second set ofdata (block 530). In an aspect, these procedures are similar to those described above with respect to FIG. 4, although they are performed with respect to the second set of data, rather than the ?rst set of data. In some cases, the ranking and/or coloration schemes might be the same for both sets ofdata (e.g., in cases in which two maps are to be displayed side-by-side, in which case similar ranking and/or coloration schemes might facilitate visual correlationbetween patterns inboth sets ofdata), while in other cases, the ranking scheme might be different (e.g., when a different metric is analyzed for each data set) and/or the coloration scheme might be different (e.g., when both sets of data are to be displayed on the same map display, as described below, for example). At block 535, the method 500 comprises correlating some or all ofthe revenue data (in the ?rst set of data) with data in the second set of data. In some cases, this correlation is performed with respect to the regions speci?ed by the geo graphical hierarchy, such that data in the ?rst data set that is categorized within a particular region is correlated with a subset of the second data set; this subset comprises data within the second data set that also has been categorized within the same particular region. This correlation bene? cially can allow a decision maker to understand relationships between the ?nancial performance of one product and the ?nancial performance of another product, or relationships between the ?nancial performance of a product and another metric (such as sales force metrics). Essentially, correlating portions oftwo data sets comprises normalizing the two data sets (or portions thereof) to the same geographical hierarchy, and/or providing information to the user based on these normalized data sets. There are several techniques by which the two data sets (or portions thereof) can be correlated for a user. Merely by way of example, in a particularembodiment, the method 500 comprises displaying information about the correlated data (block 540). This cor related information may be displayed with a map display (and/or with multiple map displays). Merely by way of example, in one embodiment, the user interface might display two maps (e.g., side-by-side) one showing a map display (as per the method 400) based on the ?rst data set (or a portion thereof), such as a map display of revenue information, and the other showing a map display based on the second data set. For instance, one map display might illustrate worldwide revenue for a ?rst product (categorized into regions) while the other map display might illustrate worldwide revenue for a second product (categorized into the same regions) for a second product. In another example, one map display might illustrate a change in worldwide revenue across all products (categorized into regions) over a certain period, while the other map display might illustrate changes in sales force personnel or advertising spending (categorized into the same regions) over a prior period.