Weekly Market Outlook (22nd Feb 10- 26th Feb 10)
•
0 recomendaciones•95 vistas

Weekly Market Outlook (22nd Feb 10- 26th Feb 10) by Moneysukh. Get more info at www.moneysukh.com

Recomendados
Recomendados
Más contenido relacionado
Más de Mansukh Investment & Trading Solutions
Más de Mansukh Investment & Trading Solutions (20)
Último
Último (20)
Weekly Market Outlook (22nd Feb 10- 26th Feb 10)
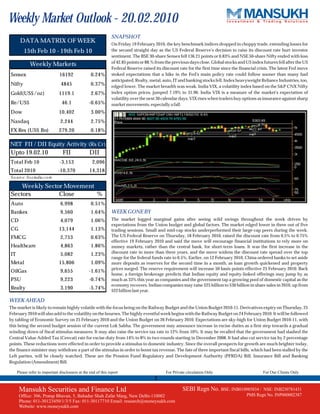
- 1. Weekly Market Outlook - 20.02.2010 SNAPSHOT DATA MATRIX OF WEEK On Friday 19 February 2010, the key benchmark indices dropped in choppy trade, extending losses for 15th Feb 10 - 19th Feb 10 the second straight day as the US Federal Reserve's decision to raise its discount rate hurt investor sentiment. The BSE 30-share Sensex fell 136.21 points or 0.83% and NSE 50-share Nifty ended with loss of 42.85 points or 88.% from the previous days close, Global stocks and US index futures fell after the US Weekly Markets Federal Reserve raised its discount rate for the first time since the financial crisis. The latest Fed move Sensex 16192 0.24% stoked expectations that a hike in the Fed's main policy rate could follow sooner than many had anticipated. Realty, metal, auto, IT and banking stocks fell. Index heavyweight Reliance Industries, too, Nifty 4845 0.37% edged lower. The market breadth was weak. India VIX, a volatility index based on the S&P CNX Nifty Gold(US$/oz) 1119.1 2.67% index option prices, jumped 7.19% to 31.90. India VIX is a measure of the market's expectation of volatility over the next 30 calendar days. VIX rises when traders buy options as insurance against sharp Re/US$ 46.1 -0.65% market movements, especially a fall. Dow 10,402 3.00% Nasdaq 2,244 2.75% FX Res (US$ Bn) 279.20 0.18% NET FII / DII Equity Activity (Rs Cr) Upto 19.02.10 FII DII Total Feb 10 -3,153 2,096 Total 2010 -10,370 14,318 S o urc e : bs e india.c o m Weekly Sector Movement Sectors Close % Auto 6,998 0.51% Bankex 9,560 1.64% WEEK GONE BY CD 4,079 1.06% The market logged marginal gains after seeing wild swings throughout the week driven by expectations from the Union budget and global factors. The market edged lower in three out of five CG 13,144 1.13% trading sessions. Small and mid-cap stocks underperformed their large-cap peers during the week. FMCG 2,753 0.63% The US Federal Reserve on Thursday, 18 February 2010, raised the discount rate from 0.5% to 0.75% effective 19 February 2010 and said the move will encourage financial institutions to rely more on Healthcare 4,863 1.86% money markets, rather than the central bank, for short-term loans. It was the first increase in the IT 5,082 1.23% discount rate in more than three years, and the move widens the discount rate spread over the top range for the federal funds rate to 0.5%. Earlier, on 12 February 2010, China ordered banks to set aside Metal 15,806 1.09% more deposits as reserves for the second time in a month, as loan growth quickened and property prices surged. The reserve requirement will increase 50 basis points effective 25 February 2010. Back OilGas 9,655 -1.61% home, a foreign brokerage predicts that Indian equity and equity-linked offerings may jump by as PSU 9,223 -0.74% much as 33% this year as companies and the government tap a growing pool of domestic capital as the economy recovers. Indian companies may raise $25 billion to $30 billion in share sales in 2010, up from Realty 3,190 -5.74% $22 billion last year. WEEK AHEAD The market is likely to remain highly volatile with the focus being on the Railway Budget and the Union Budget 2010-11. Derivatives expiry on Thursday, 25 February 2010 will also add to the volatility on the bourses. The highly eventful week begins with the Railway Budget on 24 February 2010. It will be followed by tabling of Economic Survey on 25 February 2010 and the Union Budget on 26 February 2010. Expectations are sky-high for Union Budget 2010-11, with this being the second budget session of the current Lok Sabha. The government may announce increase in excise duties as a first step towards a gradual winding down of fiscal stimulus measures. It may also raise the service tax rate to 12% from 10%. It may be recalled that the government had slashed the Central Value Added Tax (Cenvat) rate for excise duty from 14% to 8% in two rounds starting in December 2008. It had also cut service tax by 2 percentage points. These reductions were effected in order to provide a stimulus to domestic industry. Since the overall prospects for growth are much brighter today, the finance minister may withdraw a part of the stimulus in order to boost tax revenue. The fate of three important fiscal bills, which had been stalled by the Left parties, will be closely watched. These are the Pension Fund Regulatory and Development Authority (PFRDA) Bill, Insurance Bill and Banking Regulation (Amendment) Bill. Please refer to important disclosures at the end of this report For Private circulation Only For Our Clients Only 1 Mansukh Securities and Finance Ltd SEBI Regn No. BSE: INB010985834 / NSE: INB230781431 Office: 306, Pratap Bhavan, 5, Bahadur Shah Zafar Marg, New Delhi-110002 PMS Regn No. INP000002387 Phone: 011-30123450/1/3/5 Fax: 011-30117710 Email: research@moneysukh.com Website: www.moneysukh.com
- 2. Weekly Market Outlook INDEX - TECHNICAL STAND POINT Index Composition Date 19.02.10 INDEX Value NIFTY Feb Fut 4848 Mar Fut 4844 Feb OI 24762400 Mar OI 6956650 BANK NIFTY Feb Fut 8480 Mar Fut 8469 Feb OI 1087600 Mar OI 154200 CNX IT Feb Fut 5715 Feb OI 28900 TREND LINE CONJECTURE:- We have projected a trend line by joining the significant previous tops of 16002 and 17196. The value for this upper trend line stood at 17,500. This week Sensex shattered this trend line decisively and continued to stay below these levels which might be a bearish indicator in short term. In addition to that , new trend line from the lows of 13219 and 15330 also breached with substantial volumes. Hence we expect some more lows in upcoming sessions near 15330 where consolidation shouldn’t be rule out. On the flip side, diagonal pattern joining 15600 and 17493 seems to be shaping at this point. Hence we expect more positivism in the indices with medium target at around 19750 however it should be more confirmed in later part of 1st half of 2010. In Nifty trend line drawn from the lows of 4679 and 4731 providing good support at this juncture. Value for this trend line stood at 4750 level. Below this level spot index may drift to 4530 in a short span of time where we may found some sort of support. Moreover trend line adjoining tops of 4693 and 5181 seems to be determining new diagonal pattern in upcoming sessions however such possibility looks illusive at this point. Hence for upcoming sessions range bound scenario between 4750-5050 looks more prominent and worthy. ELLIOT WAVE CONJECTURE:- Remember we have already determined 'X2' wave of this diametric formation shaped in benchmark indices with nearby target at around 4900 in 11- 18 trading sessions. Now with above the target levels, 'X2' wave continued to show strength however advance decline ratio displays lack of conviction around these levels. As we have assumed that we may be into 'C' wave of the A-B-C pattern from 17493. Since last Wednesday, the Index has been forming 'HIGHER TOP' formation, which continues the optimistic preconceived notion. As in the previous A-B-C move, entire move from the lows of 15331 treated as a “b” leg, conceivably waiting 'Oct high of 17493 to be near term top decisively. During the nutshell the perfidious wave marked as corrective 'B' wave, 86% up-move originated 8047 (6th March'09) to 14931 (19th May'09) adage FII inflows of only Rs.25000 crs. Since 19th May, the FII inflows encompass explode by further Rs.62000 crs, in response to which, market moved barely 16%. Beneath this bullish unusual composition, a Complex insider wave has been shaping from March lows in 2009. Within this, the 1st move ended at 17493 as a Diametric formation, and 2nd corrective move now seems to shaping from last week lows as domestic indices manages to past 17493 on the last day of 2009 though index unable to sustain these levels on closing basis.. Under this alternative, the 2nd counteractive move if it possible mostly a diagonal move, which can triggered the Sensex ahead of 17500. If it's a Diametric, the size of the 2nd corrective would be about 6-7 months with a value target of 61.8% of the 1st corrective move mentioned earlier. This would gauge to19700 on Sensex (preferably in June-Sept 2010). Well let's wait and watch if Sensex remain constraint between 15330-17500 or goes in for a decisive surge above 17800 to reap new highs of 2010. Please refer to important disclosures at the end of this report For Private circulation Only For Our Clients Only 2 Mansukh Securities and Finance Ltd SEBI Regn No. BSE: INB010985834 / NSE: INB230781431 Office: 306, Pratap Bhavan, 5, Bahadur Shah Zafar Marg, New Delhi-110002 PMS Regn No. INP000002387 Phone: 011-30123450/1/3/5 Fax: 011-30117710 Email: research@moneysukh.com Website: www.moneysukh.com
- 3. Weekly Market Outlook MOVING AVERAGES AND THE CANDLE STICK PATTERN: The short term moving average is an indicator of the trend in the near future. The value for the short term moving average (20 DMA) is at 4854 and medium term moving average (50 DMA) is at 5039. Presently, the Nifty trading below 50 DSMA and 20 DSMA which conveys still a negative divergence in near term. RETRACEMENT AND GAP CONJECTURE:- As marked on the chart above, on 24Aug 09, Sensex formed a gap up of 122 points ( market as GG)which might be an exhaustive one, having upper and lower values of 15,362 and 15,240 respectively. As per Japanese candle stick theory, any gap is an incitement for bulls/bears to get their positions in order to fill such gaps. As this gap was created on last to last August, the Sensex has already consumed more than 60 trading sessions and the gap has not filled yet. Unless this gap is filled, the Sensex will continue to move in upward trajectory in near term. RETRACEMENT COUNTER RETRACEMENT HIGHS LOWS POINTS DAYS LOWS HIGHS POINTS DAYS 15600 13320 2280 21 13320 16002 2682 14 16002 14684 1318 11 14684 15958 1274 7 15958 15357 601 5 15357 16435 1078 3 BANK NIFTY FUT Analyzing above table we scrutinize that there is continuous faster retracement taking place in the Sensex, which is an optimistic signal. There are three downward moves. ? The move from 15,600 to 13,220 took 21 days and it got retraced in 14 days. ? The move from 16,002 to 14,684 took 11 days and it almost got retraced in 7 days. ? The move from 15,958 to 15,357 took 5 days and it got fully retraced in just 3 days. FIBONACCI RETRACEMENT:- Nifty Fut Chart Entire move from the highs of 17493 to 15330 exactly took 10 trading sessions while its retracement move also took 10 trading sessions to its 80% level at around 17060. From 17060 to 17530 Sensex entirely took more than 28 trading sessions which itself determines a consolidation on higher levels. Above these levels next resistence zone would be between 17800-18160-18470. Moreover such pull backs usually countered by small corrections. Hence we expect 15330 should act as a major support zone on lower side. Please refer to important disclosures at the end of this report For Private circulation Only For Our Clients Only 3 Mansukh Securities and Finance Ltd SEBI Regn No. BSE: INB010985834 / NSE: INB230781431 Office: 306, Pratap Bhavan, 5, Bahadur Shah Zafar Marg, New Delhi-110002 PMS Regn No. INP000002387 Phone: 011-30123450/1/3/5 Fax: 011-30117710 Email: research@moneysukh.com Website: www.moneysukh.com
- 4. Weekly Market Outlook OSCILLATORS: OSCILLATORS CURRENT AVERAGE MACD (E9,E24,S9) -59.77 -74.98 RSI (14,E9) 43.91 41.99 STOCHASTICS %K= 71.50 %D= 79.32 FINAL VERDICT: Nifty has multiple support around 4675, 4538 and 4353 based on the weekly swing with only resistance at 4950, however based on the trendline drawn from the all time highs of 6357 and high of 5310NIFTY after the recent fall benchmark index has important BANK achieved FUT resistance at 5200. Cautious approach is advocated as technical indicators are suggesting mixed view about the market. While stochastic has reached its level where market probably find its support but MACD and RSI indicate further downside. Analyst Recommendation Pre-budget investors are advised not to make fresh investment meanwhile they may hold on there existing long position. Traders may go long with a strict stop loss of 4675 and may short with a stop loss of 4950. Nifty Fut Chart Please refer to important disclosures at the end of this report For Private circulation Only For Our Clients Only 4 Mansukh Securities and Finance Ltd SEBI Regn No. BSE: INB010985834 / NSE: INB230781431 Office: 306, Pratap Bhavan, 5, Bahadur Shah Zafar Marg, New Delhi-110002 PMS Regn No. INP000002387 Phone: 011-30123450/1/3/5 Fax: 011-30117710 Email: research@moneysukh.com Website: www.moneysukh.com
- 5. Weekly Market Outlook SENSEX 30-TECHNICAL LEVELS FOR THE UPCOMING WEEK ENDED 26th Feb 2010 SUPPORT CLOSE PRICE RESISTANCE SCRIP 3rd 2nd 1st 19.02.10 1st 2nd 3rd INCLINATION ACC 860 881 892 901.8 913 924 946 Neutral BHEL 2266 2314 2334 2354 2382 2409 2457 Neutral Bharti Airtel 260 270 274 278.25 283 288 297 - ive DLF 267 281 286 291.3 299 307 321 - ive Grasim Inds 2571 2629 2655 2681.15 2713 2745 2803 Neutral HDFC 2376 2427 2457 2487.7 2508 2528 2579 + ive HDFC Bank 1607 1647 1673 1699.55 1713 1727 1767 + ive Hero Honda Motor 1604 1641 1661 1679.75 1698 1715 1752 Neutral Hind. Unilever 226 234 237 240.95 245 249 256 Neutral Hindalco Inds. 138 144 147 149.75 153 155 161 Neutral ICICI Bank 785 807 819 830.5 841 851 873 Neutral Infosys Tech. 2477 2503 2516 2529.55 2542 2555 2581 + ive ITC 238 243 246 248.05 250 253 257 Neutral JP Associates 120 126 128 129.65 133 137 142 - ive Larsen & Toubro 1377 1424 1450 1475.3 1497 1519 1566 + ive M&M 956 979 989 998.9 1013 1026 1050 Neutral Maruti Suzuki 1290 1327 1349 1370.3 1386 1402 1439 Neutral NTPC 191 196 199 201.75 204 207 212 Neutral ONGC 1059 1081 1093 1105.65 1115 1125 1147 Neutral Rel. Comm. 151 157 159 161.8 166 169 175 - ive Reliance Inds. 955 970 977 984.25 992 1000 1015 - ive Reliance Infra. 949 980 991 1002.5 1022 1041 1071 - ive St Bk of India 1833 1870 1887 1903.9 1925 1946 1983 - ive Sterlite Inds. 702 725 735 745.85 758 770 792 - ive Sun Pharma. 1452 1497 1522 1547.85 1567 1587 1632 Neutral Tata Motors 654 676 687 697.9 709 720 742 Neutral Tata Power Co. 1193 1218 1229 1239.85 1253 1266 1290 Neutral Tata Steel 536 550 556 562.55 570 578 592 Neutral TCS 725 739 745 750.8 758 766 779 Neutral Wipro 642 654 660 666 672 678 691 Neutral 6 Mansukh Securities and Finance Ltd SEBI Regn No. BSE: INB010985834 /NSE: INB230781431 Office: 306, Pratap Bhavan, 5, Bahadur Shah Zafar Marg, New Delhi-110002 PMS Regn No. INP000002387 Phone: 011-30123450/1/3/5 Fax: 011-30117710 Email: research@moneysukh.com Website: www.moneysukh.com
- 6. Weekly Market Outlook NSE MIDCAP 30-TECHNICAL LEVELS FOR THE UPCOMING WEEK ENDED 26th Feb 2010 SUPPORT CLOSE PRICE RESISTANCE Market Cap SCRIP 3rd 2nd 1st 19.02.10 1st 2nd 3rd (Rs Crore) Allahabad Bank 128 130 131 132.45 134 135 137 5917 Andhra Bank 97 99 99 100.2 101 102 103 4860 Ashok Leyland 46 48 48 49.05 50 51 52 6525 Aurobindo Pharma 846 882 898 914.9 935 955 991 5050 Cummins India 436 455 464 472.15 482 492 511 9349 Divi's Lab. 559 577 585 593.65 603 613 631 7777 Educomp Sol. 607 654 681 708.5 727 746 793 6727 GVK Power Infra. 35 39 40 42 45 47 52 6633 IDBI Bank 110 113 115 117.4 119 120 124 8510 Indian Bank 157 164 166 168.8 173 177 184 7255 Indian Hotels 84 86 87 87.9 89 91 93 6360 JSW Steel 956 992 1006 1020.45 1042 1064 1100 19088 Lanco Infratech 43 45 46 47.15 49 50 53 11353 Lupin 1458 1497 1511 1526.15 1550 1575 1614 13572 MTNL 70 73 74 75.55 77 78 81 4760 MphasiS 689 712 722 732.35 745 757 780 15357 Oracle Fin.Serv. 2094 2154 2180 2205.8 2240 2274 2334 18493 Petronet LNG 69 71 71 72.2 73 74 75 5415 Piramal Health 352 366 372 378 386 394 408 7900 Punj Lloyd 161 168 171 173.2 178 182 190 5751 Rel.Nat.Resour. 60 61 62 62.55 64 64 66 10215 SCI 134 142 145 147.55 152 157 164 6248 Tata Chemicals 252 273 284 295.55 305 315 336 7190 Tata Tea 902 916 922 926.7 935 944 958 5731 Tech Mahindra 894 918 928 936.85 952 966 990 11457 Titan Inds. 1730 1774 1791 1808.15 1835 1862 1906 8026 UltraTech Cem. 969 997 1012 1027.1 1041 1055 1083 12786 United Phosp. 148 153 154 155.9 159 161 166 6853 Voltas 142 148 150 152.65 156 160 165 5051 Welsp.Guj.Stahl 224 232 235 238.35 243 248 255 4862 7 Mansukh Securities and Finance Ltd SEBI Regn No. BSE: INB010985834 /NSE: INB230781431 Office: 306, Pratap Bhavan, 5, Bahadur Shah Zafar Marg, New Delhi-110002 PMS Regn No. INP000002387 Phone: 011-30123450/1/3/5 Fax: 011-30117710 Email: research@moneysukh.com Website: www.moneysukh.com
- 7. Weekly Market Outlook EQUITY CALLS PERFORM ANCE FOR W EEK ENDED 19th Feb 2010 Total No. of Calls Target Achieved Profit Booked Positional Calls Exit/Stop Loss Success Rate 49 16 20 0 12 73.47% Research Desk Phone: 011-30211872/73 Email: research@moneysukh.com NAME DESIGNATION E-MAIL Varun Gupta Head - Research varungupta@moneysukh.com Pashupati Nath Jha Research Analyst pashupatinathjha@moneysukh.com Ajay Lakra Research Analyst ajaylakra@moneysukh.com Vikram Singh Research Analyst vikram_research@moneysukh.com This report is for the personal information of the authorized recipient and does not construe to be any investment, legal or taxation advice to you. Mansukh Securities and Finance Ltd (hereinafter referred as MSFL) is not soliciting any action based on it. This report is not for public distribution and has been furnished to you solely for your information and should not be reproduced or redistributed to any person in any form. The report is based upon information that we consider reliable, but we do not represent that it is accurate or complete. MSFL or any of its affiliates or employees shall not be in any way responsible for any loss or damage that may arise to any person from any inadvertent error in the information contained in this report. MSFL or any of its affiliates or employees do not provide, at any time, any express or implied warranty of any kind, regarding any matter pertaining to this report, including without limitation the implied warranties of merchantability, fitness for a particular purpose, and non-infringement. The recipients of this report should rely on their own investigations. MSFL and/or its affiliates and/or employees may have interests/positions, financial or otherwise in the securities mentioned in this report. This information is subject to change without any prior notice. MSFL reserves the right to make modifications and alterations to this statement as may be required from time to time. Nevertheless, MSFL is committed to providing independent and transparent recommendations to its clients, and would be happy to provide information in response to specific client queries. 9 Mansukh Securities and Finance Ltd SEBI Regn No. BSE: INB010985834 / NSE: INB230781431 Office: 306, Pratap Bhavan, 5, Bahadur Shah Zafar Marg, New Delhi-110002 PMS Regn No. INP000002387 Phone: 011-30123450/1/3/5 Fax: 011-30117710 Email: research@moneysukh.com Website: www.moneysukh.com