SlideShare una empresa de Scribd logo
1 de 1
Class test


1. Define Statistics with its application in different fields.
2. What is variable? Give a few examples of it.
3. For the following table, construct a line graph
                Months           Aug       Sep          Oct       Nov        Dec
              Share index        200       350          400       150        50

4. Explain the concept of sample and population along with their examples.
5. Explain the concept of discrete and continuous variable along with examples.
6. Explain the concept of qualitative and quantitative variable along with examples.
7. Explain the concept of independent and dependent variable along with examples.
8. Explain different scales of measurement along with examples.
9. For the following table, construct a histogram

                  class                frequency
                 5 – 10                     5
                 10 – 15                   10
                 15 – 20                   15
                 20 – 25                   10
                 25 – 30                    5
10. Construct a steam & leaf plot for the following data
11.


      11,14,16,21,23,24,27,30,31,35,36,37,38,40,41,42,43,50,51
12. Classify the variables as quantitative/qualitative
      Number of customers, Color, Marital status, Length, Number of students in BBA
13. Classify the variables as nominal/ordinal/interval/ratio
      Age, Gender, Health status, Academic degree, Color, Weight, Disease status,
      Place of residence, Calendar time, IQ test score.
14. Let X = age, Y = weight. Then construct a scatter diagram for the data below

          X        1        2    3    4     5       6      7      8      9    10
          Y        5       10   15   20    25      30     35     40     45    50
15. Classify the variables as discrete/continuous
      Shirt size, Number of students in IUBAT, Weight, Volume of a 1L Coke, Shoe size
16. Write down the advantages of different graphs.
17. Write down the disadvantages of different graphs.
18. Distinguish between bar diagram and histogram.


                                     Md. Mortuza Ahmmed

Más contenido relacionado

Destacado

Exam Questions on Basic Statistics
Exam Questions on Basic StatisticsExam Questions on Basic Statistics
Exam Questions on Basic StatisticsIUBAT
 
1.2 frequency and histograms (1)
1.2 frequency and histograms (1)1.2 frequency and histograms (1)
1.2 frequency and histograms (1)tdalexander2
 
Exam Questions on Basic Statistics
Exam Questions on Basic StatisticsExam Questions on Basic Statistics
Exam Questions on Basic StatisticsIUBAT
 
Understanding drawing histograms
Understanding drawing histogramsUnderstanding drawing histograms
Understanding drawing histogramsAnkit Katiyar
 
Lecture sheet
Lecture sheetLecture sheet
Lecture sheetIUBAT
 
Scatter diagrams and correlation and simple linear regresssion
Scatter diagrams and correlation and simple linear regresssionScatter diagrams and correlation and simple linear regresssion
Scatter diagrams and correlation and simple linear regresssionAnkit Katiyar
 
Histograms, frequency polygons, and ogives
Histograms, frequency polygons, and ogivesHistograms, frequency polygons, and ogives
Histograms, frequency polygons, and ogivesTom Thand
 
2.3 Histogram/Frequency Polygon/Ogives
2.3 Histogram/Frequency Polygon/Ogives2.3 Histogram/Frequency Polygon/Ogives
2.3 Histogram/Frequency Polygon/Ogivesmlong24
 
How to Make a Frequency Table and Bar Graph
How to Make a Frequency Table and Bar GraphHow to Make a Frequency Table and Bar Graph
How to Make a Frequency Table and Bar GraphAmanda Craft
 
Measure of central tendency (Mean, Median and Mode)
Measure of central tendency (Mean, Median and Mode)Measure of central tendency (Mean, Median and Mode)
Measure of central tendency (Mean, Median and Mode)Shakehand with Life
 
Frequency Distributions and Graphs
Frequency Distributions and GraphsFrequency Distributions and Graphs
Frequency Distributions and Graphsmonritche
 

Destacado (20)

Exam Questions on Basic Statistics
Exam Questions on Basic StatisticsExam Questions on Basic Statistics
Exam Questions on Basic Statistics
 
1.2 frequency and histograms (1)
1.2 frequency and histograms (1)1.2 frequency and histograms (1)
1.2 frequency and histograms (1)
 
Exam Questions on Basic Statistics
Exam Questions on Basic StatisticsExam Questions on Basic Statistics
Exam Questions on Basic Statistics
 
Understanding drawing histograms
Understanding drawing histogramsUnderstanding drawing histograms
Understanding drawing histograms
 
Lecture sheet
Lecture sheetLecture sheet
Lecture sheet
 
Lampiran 1
Lampiran 1Lampiran 1
Lampiran 1
 
Scatter diagrams and correlation and simple linear regresssion
Scatter diagrams and correlation and simple linear regresssionScatter diagrams and correlation and simple linear regresssion
Scatter diagrams and correlation and simple linear regresssion
 
Statistic chapter 1 & 2
Statistic chapter 1 & 2Statistic chapter 1 & 2
Statistic chapter 1 & 2
 
Histogram
HistogramHistogram
Histogram
 
Exercises statistics
Exercises statisticsExercises statistics
Exercises statistics
 
Histograms, frequency polygons, and ogives
Histograms, frequency polygons, and ogivesHistograms, frequency polygons, and ogives
Histograms, frequency polygons, and ogives
 
2.3 Histogram/Frequency Polygon/Ogives
2.3 Histogram/Frequency Polygon/Ogives2.3 Histogram/Frequency Polygon/Ogives
2.3 Histogram/Frequency Polygon/Ogives
 
How to Make a Frequency Table and Bar Graph
How to Make a Frequency Table and Bar GraphHow to Make a Frequency Table and Bar Graph
How to Make a Frequency Table and Bar Graph
 
Statistical graphs
Statistical graphsStatistical graphs
Statistical graphs
 
Problems statistics 1
Problems statistics 1Problems statistics 1
Problems statistics 1
 
Bar graph
Bar graphBar graph
Bar graph
 
Histograms
HistogramsHistograms
Histograms
 
Histogram
HistogramHistogram
Histogram
 
Measure of central tendency (Mean, Median and Mode)
Measure of central tendency (Mean, Median and Mode)Measure of central tendency (Mean, Median and Mode)
Measure of central tendency (Mean, Median and Mode)
 
Frequency Distributions and Graphs
Frequency Distributions and GraphsFrequency Distributions and Graphs
Frequency Distributions and Graphs
 

Similar a Exam Questions on Basic Statistics

Coder Name Rebecca Oquendo
Coder Name  Rebecca Oquendo                                    Coder Name  Rebecca Oquendo
Coder Name Rebecca Oquendo DioneWang844
 
Coder Name Rebecca Oquendo .docx
Coder Name  Rebecca Oquendo                                    .docxCoder Name  Rebecca Oquendo                                    .docx
Coder Name Rebecca Oquendo .docxmary772
 
Penggambaran Data dengan Grafik
Penggambaran Data dengan GrafikPenggambaran Data dengan Grafik
Penggambaran Data dengan Grafikanom0164
 
Chapter 8 Measure of Dispersion of Data
Chapter 8 Measure of Dispersion of DataChapter 8 Measure of Dispersion of Data
Chapter 8 Measure of Dispersion of DataMISS ESTHER
 
Population lesson 5
Population lesson 5Population lesson 5
Population lesson 5Mrs Coles
 

Similar a Exam Questions on Basic Statistics (9)

Methods of data presention
Methods of data presentionMethods of data presention
Methods of data presention
 
Coder Name Rebecca Oquendo
Coder Name  Rebecca Oquendo                                    Coder Name  Rebecca Oquendo
Coder Name Rebecca Oquendo
 
Coder Name Rebecca Oquendo .docx
Coder Name  Rebecca Oquendo                                    .docxCoder Name  Rebecca Oquendo                                    .docx
Coder Name Rebecca Oquendo .docx
 
Penggambaran Data dengan Grafik
Penggambaran Data dengan GrafikPenggambaran Data dengan Grafik
Penggambaran Data dengan Grafik
 
Tableau whitepaper
Tableau whitepaperTableau whitepaper
Tableau whitepaper
 
Classification & tabulation of data
Classification & tabulation of dataClassification & tabulation of data
Classification & tabulation of data
 
Chapter 8 Measure of Dispersion of Data
Chapter 8 Measure of Dispersion of DataChapter 8 Measure of Dispersion of Data
Chapter 8 Measure of Dispersion of Data
 
Population lesson 5
Population lesson 5Population lesson 5
Population lesson 5
 
Presenting data & stats
Presenting data & statsPresenting data & stats
Presenting data & stats
 

Más de IUBAT

Basic Statistics Presentation
Basic Statistics PresentationBasic Statistics Presentation
Basic Statistics PresentationIUBAT
 
Course outline sta 240 spring semester 2011
Course outline sta 240 spring semester 2011Course outline sta 240 spring semester 2011
Course outline sta 240 spring semester 2011IUBAT
 
Exam Questions on Basic Statistics
Exam Questions on Basic StatisticsExam Questions on Basic Statistics
Exam Questions on Basic StatisticsIUBAT
 
Exam Questions on Basic Statistics
Exam Questions on Basic StatisticsExam Questions on Basic Statistics
Exam Questions on Basic StatisticsIUBAT
 
Exam Questions on Basic Statistics
Exam Questions on Basic StatisticsExam Questions on Basic Statistics
Exam Questions on Basic StatisticsIUBAT
 
Exam Questions on Basic Statistics
Exam Questions on Basic StatisticsExam Questions on Basic Statistics
Exam Questions on Basic StatisticsIUBAT
 
Exam Questions on Basic Statistics
Exam Questions on Basic StatisticsExam Questions on Basic Statistics
Exam Questions on Basic StatisticsIUBAT
 
Exam Questions on Basic Statistics
Exam Questions on Basic StatisticsExam Questions on Basic Statistics
Exam Questions on Basic StatisticsIUBAT
 
Exam Questions on Basic Statistics
Exam Questions on Basic StatisticsExam Questions on Basic Statistics
Exam Questions on Basic StatisticsIUBAT
 
Exam Questions on Basic Statistics
Exam Questions on Basic StatisticsExam Questions on Basic Statistics
Exam Questions on Basic StatisticsIUBAT
 
Exam Questions on Basic Statistics
Exam Questions on Basic StatisticsExam Questions on Basic Statistics
Exam Questions on Basic StatisticsIUBAT
 
Exam Questions on Basic Statistics
Exam Questions on Basic StatisticsExam Questions on Basic Statistics
Exam Questions on Basic StatisticsIUBAT
 
Exam Questions on Basic Statistics
Exam Questions on Basic StatisticsExam Questions on Basic Statistics
Exam Questions on Basic StatisticsIUBAT
 
Exam Questions on Basic Statistics
Exam Questions on Basic StatisticsExam Questions on Basic Statistics
Exam Questions on Basic StatisticsIUBAT
 
Exam Questions on Basic Statistics
Exam Questions on Basic StatisticsExam Questions on Basic Statistics
Exam Questions on Basic StatisticsIUBAT
 
Exam Questions on Basic Statistics
Exam Questions on Basic StatisticsExam Questions on Basic Statistics
Exam Questions on Basic StatisticsIUBAT
 
Exam Questions on Basic Statistics
Exam Questions on Basic StatisticsExam Questions on Basic Statistics
Exam Questions on Basic StatisticsIUBAT
 
Exam Questions on Basic Statistics
Exam Questions on Basic StatisticsExam Questions on Basic Statistics
Exam Questions on Basic StatisticsIUBAT
 
Exam Questions on Basic Statistics
Exam Questions on Basic StatisticsExam Questions on Basic Statistics
Exam Questions on Basic StatisticsIUBAT
 
Exam Questions on Basic Statistics
Exam Questions on Basic StatisticsExam Questions on Basic Statistics
Exam Questions on Basic StatisticsIUBAT
 

Más de IUBAT (20)

Basic Statistics Presentation
Basic Statistics PresentationBasic Statistics Presentation
Basic Statistics Presentation
 
Course outline sta 240 spring semester 2011
Course outline sta 240 spring semester 2011Course outline sta 240 spring semester 2011
Course outline sta 240 spring semester 2011
 
Exam Questions on Basic Statistics
Exam Questions on Basic StatisticsExam Questions on Basic Statistics
Exam Questions on Basic Statistics
 
Exam Questions on Basic Statistics
Exam Questions on Basic StatisticsExam Questions on Basic Statistics
Exam Questions on Basic Statistics
 
Exam Questions on Basic Statistics
Exam Questions on Basic StatisticsExam Questions on Basic Statistics
Exam Questions on Basic Statistics
 
Exam Questions on Basic Statistics
Exam Questions on Basic StatisticsExam Questions on Basic Statistics
Exam Questions on Basic Statistics
 
Exam Questions on Basic Statistics
Exam Questions on Basic StatisticsExam Questions on Basic Statistics
Exam Questions on Basic Statistics
 
Exam Questions on Basic Statistics
Exam Questions on Basic StatisticsExam Questions on Basic Statistics
Exam Questions on Basic Statistics
 
Exam Questions on Basic Statistics
Exam Questions on Basic StatisticsExam Questions on Basic Statistics
Exam Questions on Basic Statistics
 
Exam Questions on Basic Statistics
Exam Questions on Basic StatisticsExam Questions on Basic Statistics
Exam Questions on Basic Statistics
 
Exam Questions on Basic Statistics
Exam Questions on Basic StatisticsExam Questions on Basic Statistics
Exam Questions on Basic Statistics
 
Exam Questions on Basic Statistics
Exam Questions on Basic StatisticsExam Questions on Basic Statistics
Exam Questions on Basic Statistics
 
Exam Questions on Basic Statistics
Exam Questions on Basic StatisticsExam Questions on Basic Statistics
Exam Questions on Basic Statistics
 
Exam Questions on Basic Statistics
Exam Questions on Basic StatisticsExam Questions on Basic Statistics
Exam Questions on Basic Statistics
 
Exam Questions on Basic Statistics
Exam Questions on Basic StatisticsExam Questions on Basic Statistics
Exam Questions on Basic Statistics
 
Exam Questions on Basic Statistics
Exam Questions on Basic StatisticsExam Questions on Basic Statistics
Exam Questions on Basic Statistics
 
Exam Questions on Basic Statistics
Exam Questions on Basic StatisticsExam Questions on Basic Statistics
Exam Questions on Basic Statistics
 
Exam Questions on Basic Statistics
Exam Questions on Basic StatisticsExam Questions on Basic Statistics
Exam Questions on Basic Statistics
 
Exam Questions on Basic Statistics
Exam Questions on Basic StatisticsExam Questions on Basic Statistics
Exam Questions on Basic Statistics
 
Exam Questions on Basic Statistics
Exam Questions on Basic StatisticsExam Questions on Basic Statistics
Exam Questions on Basic Statistics
 

Último

Cloud Frontiers: A Deep Dive into Serverless Spatial Data and FME
Cloud Frontiers:  A Deep Dive into Serverless Spatial Data and FMECloud Frontiers:  A Deep Dive into Serverless Spatial Data and FME
Cloud Frontiers: A Deep Dive into Serverless Spatial Data and FMESafe Software
 
Why Teams call analytics are critical to your entire business
Why Teams call analytics are critical to your entire businessWhy Teams call analytics are critical to your entire business
Why Teams call analytics are critical to your entire businesspanagenda
 
Apidays New York 2024 - APIs in 2030: The Risk of Technological Sleepwalk by ...
Apidays New York 2024 - APIs in 2030: The Risk of Technological Sleepwalk by ...Apidays New York 2024 - APIs in 2030: The Risk of Technological Sleepwalk by ...
Apidays New York 2024 - APIs in 2030: The Risk of Technological Sleepwalk by ...apidays
 
Strategies for Landing an Oracle DBA Job as a Fresher
Strategies for Landing an Oracle DBA Job as a FresherStrategies for Landing an Oracle DBA Job as a Fresher
Strategies for Landing an Oracle DBA Job as a FresherRemote DBA Services
 
Rising Above_ Dubai Floods and the Fortitude of Dubai International Airport.pdf
Rising Above_ Dubai Floods and the Fortitude of Dubai International Airport.pdfRising Above_ Dubai Floods and the Fortitude of Dubai International Airport.pdf
Rising Above_ Dubai Floods and the Fortitude of Dubai International Airport.pdfOrbitshub
 
DBX First Quarter 2024 Investor Presentation
DBX First Quarter 2024 Investor PresentationDBX First Quarter 2024 Investor Presentation
DBX First Quarter 2024 Investor PresentationDropbox
 
Apidays New York 2024 - Scaling API-first by Ian Reasor and Radu Cotescu, Adobe
Apidays New York 2024 - Scaling API-first by Ian Reasor and Radu Cotescu, AdobeApidays New York 2024 - Scaling API-first by Ian Reasor and Radu Cotescu, Adobe
Apidays New York 2024 - Scaling API-first by Ian Reasor and Radu Cotescu, Adobeapidays
 
Navigating the Deluge_ Dubai Floods and the Resilience of Dubai International...
Navigating the Deluge_ Dubai Floods and the Resilience of Dubai International...Navigating the Deluge_ Dubai Floods and the Resilience of Dubai International...
Navigating the Deluge_ Dubai Floods and the Resilience of Dubai International...Orbitshub
 
TrustArc Webinar - Unlock the Power of AI-Driven Data Discovery
TrustArc Webinar - Unlock the Power of AI-Driven Data DiscoveryTrustArc Webinar - Unlock the Power of AI-Driven Data Discovery
TrustArc Webinar - Unlock the Power of AI-Driven Data DiscoveryTrustArc
 
Corporate and higher education May webinar.pptx
Corporate and higher education May webinar.pptxCorporate and higher education May webinar.pptx
Corporate and higher education May webinar.pptxRustici Software
 
Finding Java's Hidden Performance Traps @ DevoxxUK 2024
Finding Java's Hidden Performance Traps @ DevoxxUK 2024Finding Java's Hidden Performance Traps @ DevoxxUK 2024
Finding Java's Hidden Performance Traps @ DevoxxUK 2024Victor Rentea
 
Exploring Multimodal Embeddings with Milvus
Exploring Multimodal Embeddings with MilvusExploring Multimodal Embeddings with Milvus
Exploring Multimodal Embeddings with MilvusZilliz
 
Apidays New York 2024 - The value of a flexible API Management solution for O...
Apidays New York 2024 - The value of a flexible API Management solution for O...Apidays New York 2024 - The value of a flexible API Management solution for O...
Apidays New York 2024 - The value of a flexible API Management solution for O...apidays
 
[BuildWithAI] Introduction to Gemini.pdf
[BuildWithAI] Introduction to Gemini.pdf[BuildWithAI] Introduction to Gemini.pdf
[BuildWithAI] Introduction to Gemini.pdfSandro Moreira
 
WSO2's API Vision: Unifying Control, Empowering Developers
WSO2's API Vision: Unifying Control, Empowering DevelopersWSO2's API Vision: Unifying Control, Empowering Developers
WSO2's API Vision: Unifying Control, Empowering DevelopersWSO2
 
FWD Group - Insurer Innovation Award 2024
FWD Group - Insurer Innovation Award 2024FWD Group - Insurer Innovation Award 2024
FWD Group - Insurer Innovation Award 2024The Digital Insurer
 
How to Troubleshoot Apps for the Modern Connected Worker
How to Troubleshoot Apps for the Modern Connected WorkerHow to Troubleshoot Apps for the Modern Connected Worker
How to Troubleshoot Apps for the Modern Connected WorkerThousandEyes
 
Apidays New York 2024 - Accelerating FinTech Innovation by Vasa Krishnan, Fin...
Apidays New York 2024 - Accelerating FinTech Innovation by Vasa Krishnan, Fin...Apidays New York 2024 - Accelerating FinTech Innovation by Vasa Krishnan, Fin...
Apidays New York 2024 - Accelerating FinTech Innovation by Vasa Krishnan, Fin...apidays
 
Modular Monolith - a Practical Alternative to Microservices @ Devoxx UK 2024
Modular Monolith - a Practical Alternative to Microservices @ Devoxx UK 2024Modular Monolith - a Practical Alternative to Microservices @ Devoxx UK 2024
Modular Monolith - a Practical Alternative to Microservices @ Devoxx UK 2024Victor Rentea
 
Cloud Frontiers: A Deep Dive into Serverless Spatial Data and FME
Cloud Frontiers:  A Deep Dive into Serverless Spatial Data and FMECloud Frontiers:  A Deep Dive into Serverless Spatial Data and FME
Cloud Frontiers: A Deep Dive into Serverless Spatial Data and FMESafe Software
 

Último (20)

Cloud Frontiers: A Deep Dive into Serverless Spatial Data and FME
Cloud Frontiers:  A Deep Dive into Serverless Spatial Data and FMECloud Frontiers:  A Deep Dive into Serverless Spatial Data and FME
Cloud Frontiers: A Deep Dive into Serverless Spatial Data and FME
 
Why Teams call analytics are critical to your entire business
Why Teams call analytics are critical to your entire businessWhy Teams call analytics are critical to your entire business
Why Teams call analytics are critical to your entire business
 
Apidays New York 2024 - APIs in 2030: The Risk of Technological Sleepwalk by ...
Apidays New York 2024 - APIs in 2030: The Risk of Technological Sleepwalk by ...Apidays New York 2024 - APIs in 2030: The Risk of Technological Sleepwalk by ...
Apidays New York 2024 - APIs in 2030: The Risk of Technological Sleepwalk by ...
 
Strategies for Landing an Oracle DBA Job as a Fresher
Strategies for Landing an Oracle DBA Job as a FresherStrategies for Landing an Oracle DBA Job as a Fresher
Strategies for Landing an Oracle DBA Job as a Fresher
 
Rising Above_ Dubai Floods and the Fortitude of Dubai International Airport.pdf
Rising Above_ Dubai Floods and the Fortitude of Dubai International Airport.pdfRising Above_ Dubai Floods and the Fortitude of Dubai International Airport.pdf
Rising Above_ Dubai Floods and the Fortitude of Dubai International Airport.pdf
 
DBX First Quarter 2024 Investor Presentation
DBX First Quarter 2024 Investor PresentationDBX First Quarter 2024 Investor Presentation
DBX First Quarter 2024 Investor Presentation
 
Apidays New York 2024 - Scaling API-first by Ian Reasor and Radu Cotescu, Adobe
Apidays New York 2024 - Scaling API-first by Ian Reasor and Radu Cotescu, AdobeApidays New York 2024 - Scaling API-first by Ian Reasor and Radu Cotescu, Adobe
Apidays New York 2024 - Scaling API-first by Ian Reasor and Radu Cotescu, Adobe
 
Navigating the Deluge_ Dubai Floods and the Resilience of Dubai International...
Navigating the Deluge_ Dubai Floods and the Resilience of Dubai International...Navigating the Deluge_ Dubai Floods and the Resilience of Dubai International...
Navigating the Deluge_ Dubai Floods and the Resilience of Dubai International...
 
TrustArc Webinar - Unlock the Power of AI-Driven Data Discovery
TrustArc Webinar - Unlock the Power of AI-Driven Data DiscoveryTrustArc Webinar - Unlock the Power of AI-Driven Data Discovery
TrustArc Webinar - Unlock the Power of AI-Driven Data Discovery
 
Corporate and higher education May webinar.pptx
Corporate and higher education May webinar.pptxCorporate and higher education May webinar.pptx
Corporate and higher education May webinar.pptx
 
Finding Java's Hidden Performance Traps @ DevoxxUK 2024
Finding Java's Hidden Performance Traps @ DevoxxUK 2024Finding Java's Hidden Performance Traps @ DevoxxUK 2024
Finding Java's Hidden Performance Traps @ DevoxxUK 2024
 
Exploring Multimodal Embeddings with Milvus
Exploring Multimodal Embeddings with MilvusExploring Multimodal Embeddings with Milvus
Exploring Multimodal Embeddings with Milvus
 
Apidays New York 2024 - The value of a flexible API Management solution for O...
Apidays New York 2024 - The value of a flexible API Management solution for O...Apidays New York 2024 - The value of a flexible API Management solution for O...
Apidays New York 2024 - The value of a flexible API Management solution for O...
 
[BuildWithAI] Introduction to Gemini.pdf
[BuildWithAI] Introduction to Gemini.pdf[BuildWithAI] Introduction to Gemini.pdf
[BuildWithAI] Introduction to Gemini.pdf
 
WSO2's API Vision: Unifying Control, Empowering Developers
WSO2's API Vision: Unifying Control, Empowering DevelopersWSO2's API Vision: Unifying Control, Empowering Developers
WSO2's API Vision: Unifying Control, Empowering Developers
 
FWD Group - Insurer Innovation Award 2024
FWD Group - Insurer Innovation Award 2024FWD Group - Insurer Innovation Award 2024
FWD Group - Insurer Innovation Award 2024
 
How to Troubleshoot Apps for the Modern Connected Worker
How to Troubleshoot Apps for the Modern Connected WorkerHow to Troubleshoot Apps for the Modern Connected Worker
How to Troubleshoot Apps for the Modern Connected Worker
 
Apidays New York 2024 - Accelerating FinTech Innovation by Vasa Krishnan, Fin...
Apidays New York 2024 - Accelerating FinTech Innovation by Vasa Krishnan, Fin...Apidays New York 2024 - Accelerating FinTech Innovation by Vasa Krishnan, Fin...
Apidays New York 2024 - Accelerating FinTech Innovation by Vasa Krishnan, Fin...
 
Modular Monolith - a Practical Alternative to Microservices @ Devoxx UK 2024
Modular Monolith - a Practical Alternative to Microservices @ Devoxx UK 2024Modular Monolith - a Practical Alternative to Microservices @ Devoxx UK 2024
Modular Monolith - a Practical Alternative to Microservices @ Devoxx UK 2024
 
Cloud Frontiers: A Deep Dive into Serverless Spatial Data and FME
Cloud Frontiers:  A Deep Dive into Serverless Spatial Data and FMECloud Frontiers:  A Deep Dive into Serverless Spatial Data and FME
Cloud Frontiers: A Deep Dive into Serverless Spatial Data and FME
 

Exam Questions on Basic Statistics

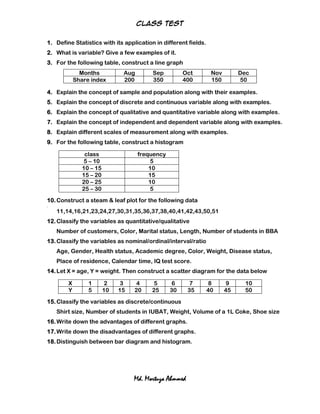
  • 1. Class test 1. Define Statistics with its application in different fields. 2. What is variable? Give a few examples of it. 3. For the following table, construct a line graph Months Aug Sep Oct Nov Dec Share index 200 350 400 150 50 4. Explain the concept of sample and population along with their examples. 5. Explain the concept of discrete and continuous variable along with examples. 6. Explain the concept of qualitative and quantitative variable along with examples. 7. Explain the concept of independent and dependent variable along with examples. 8. Explain different scales of measurement along with examples. 9. For the following table, construct a histogram class frequency 5 – 10 5 10 – 15 10 15 – 20 15 20 – 25 10 25 – 30 5 10. Construct a steam & leaf plot for the following data 11. 11,14,16,21,23,24,27,30,31,35,36,37,38,40,41,42,43,50,51 12. Classify the variables as quantitative/qualitative Number of customers, Color, Marital status, Length, Number of students in BBA 13. Classify the variables as nominal/ordinal/interval/ratio Age, Gender, Health status, Academic degree, Color, Weight, Disease status, Place of residence, Calendar time, IQ test score. 14. Let X = age, Y = weight. Then construct a scatter diagram for the data below X 1 2 3 4 5 6 7 8 9 10 Y 5 10 15 20 25 30 35 40 45 50 15. Classify the variables as discrete/continuous Shirt size, Number of students in IUBAT, Weight, Volume of a 1L Coke, Shoe size 16. Write down the advantages of different graphs. 17. Write down the disadvantages of different graphs. 18. Distinguish between bar diagram and histogram. Md. Mortuza Ahmmed