SlideShare una empresa de Scribd logo
1 de 2
Descargar para leer sin conexión
Name ________________________________________Hour_____ Date________
                  Scatter Plots and Lines of Best Fit Worksheet

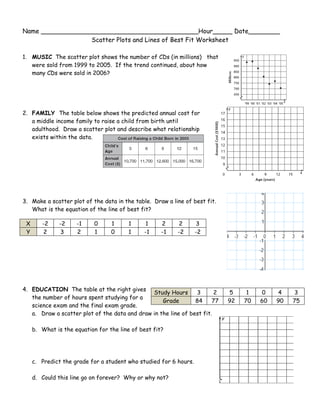
1. MUSIC The scatter plot shows the number of CDs (in millions) that
   were sold from 1999 to 2005. If the trend continued, about how
   many CDs were sold in 2006?


2. FAMILY The table below shows the predicted annual cost for
   a middle income family to raise a child from birth until
   adulthood. Draw a scatter plot and describe what relationship
   exists within the data.


3. Make a scatter plot of the data in the table. Draw a line of best fit.
   What is the equation of the line of best fit?

 X      -2     -2    -1     0     1      1     1     2     2        3
 Y       2     3     2      1     0      1    -1     -1   -2       -2


4. EDUCATION The table at the right gives
                                               Study Hours      3       2   5     1   0    4    3
   the number of hours spent studying for a
                                                   Grade        84     77   92   70   60   90   75
   science exam and the final exam grade.
   a. Draw a scatter plot of the data and draw in the line of best fit.

     b. What is the equation for the line of best fit?


     c. Predict the grade for a student who studied for 6 hours.

     d. Could this line go on forever? Why or why not?
5. BASEBALL The scatter plot shows the average price of a major-league baseball ticket from 1997
   to 2006.
   a. Use the points (2001, 17.60) and (2002, 18.75) to write
       the slope-intercept form of equation for the line of fit
       shown in the scatter plot.


   b. Use your equation to tell the price of a ticket in 2009. Is
      this extrapolation or interpolation?


6. DISEASE The table shows the number of cases of Foodborne
   Botulism in the United States for the years 2001 to 2005.
   a. Draw a scatter plot and determine, what relationship, if
      any, exists in the data.

   b. Draw a line of fit for the scatter plot, and write the slope-
      intercept form of an equation for the line of fit.


7. ZOOS The table shows the average and maximum longevity of
   various animals in captivity.
   a. Draw a scatter plot and determine, what relationship, if any,
       exists in the data.


   b. Draw a line of fit for the scatter plot, and write the slope-
      intercept form of an equation for the line of fit.


   c. Predict the maximum longevity for an animal with an average
      longevity of 33 years. Is this an example of Extrapolation or
      Interpolation?

Más contenido relacionado

La actualidad más candente

Writing equations using symbols
Writing equations using symbolsWriting equations using symbols
Writing equations using symbolsjulienorman80065
 
Examen matematica convocatoria primera 2011
Examen matematica  convocatoria primera 2011Examen matematica  convocatoria primera 2011
Examen matematica convocatoria primera 2011MCMurray
 
Teoria elemental del factorial ccesa007
Teoria elemental del factorial  ccesa007Teoria elemental del factorial  ccesa007
Teoria elemental del factorial ccesa007Demetrio Ccesa Rayme
 
Taller función lineal, a fín y ecuación de la recta
Taller función lineal, a fín y ecuación de la rectaTaller función lineal, a fín y ecuación de la recta
Taller función lineal, a fín y ecuación de la rectaOscar Fdo
 
Tutorial linear equations and linear inequalities
Tutorial linear equations and linear inequalitiesTutorial linear equations and linear inequalities
Tutorial linear equations and linear inequalitieskhyps13
 
Sum and Difference of 2 cubes
Sum and Difference of 2 cubesSum and Difference of 2 cubes
Sum and Difference of 2 cubesScott Bailey
 
Recurring Decimals
Recurring DecimalsRecurring Decimals
Recurring DecimalsSteve Bishop
 
1.6 solving linear inequalities
1.6 solving linear inequalities1.6 solving linear inequalities
1.6 solving linear inequalitiesswartzje
 
Ruang - Luas
Ruang - LuasRuang - Luas
Ruang - LuasMekZanie
 
2/27/12 Special Factoring - Sum & Difference of Two Cubes
2/27/12 Special Factoring - Sum & Difference of Two Cubes2/27/12 Special Factoring - Sum & Difference of Two Cubes
2/27/12 Special Factoring - Sum & Difference of Two Cubesjennoga08
 
Translating Mathematical Phrases into Algebraic Expressions or Equations
Translating Mathematical Phrases into Algebraic Expressions or EquationsTranslating Mathematical Phrases into Algebraic Expressions or Equations
Translating Mathematical Phrases into Algebraic Expressions or EquationsSonarin Cruz
 
Soalan Bahasa Inggeris Tahun 1 Kertas 2(cefr)
Soalan Bahasa Inggeris Tahun 1 Kertas 2(cefr)Soalan Bahasa Inggeris Tahun 1 Kertas 2(cefr)
Soalan Bahasa Inggeris Tahun 1 Kertas 2(cefr)Michael Pateh
 
Lembaran Kerja Darab, Bahagi dan Pecahan Tahun 2
Lembaran Kerja Darab, Bahagi dan Pecahan Tahun 2Lembaran Kerja Darab, Bahagi dan Pecahan Tahun 2
Lembaran Kerja Darab, Bahagi dan Pecahan Tahun 2Norazlin Mohd Rusdin
 
Actividad 4 teorema de thales.
Actividad 4 teorema de thales.Actividad 4 teorema de thales.
Actividad 4 teorema de thales.smatiasr
 
3 2 polynomial inequalities
3 2 polynomial inequalities3 2 polynomial inequalities
3 2 polynomial inequalitieshisema01
 
PDV: [Explicación] Matemáticas N°2 (2012)
PDV: [Explicación] Matemáticas N°2 (2012)PDV: [Explicación] Matemáticas N°2 (2012)
PDV: [Explicación] Matemáticas N°2 (2012)PSU Informator
 

La actualidad más candente (20)

Writing equations using symbols
Writing equations using symbolsWriting equations using symbols
Writing equations using symbols
 
Examen matematica convocatoria primera 2011
Examen matematica  convocatoria primera 2011Examen matematica  convocatoria primera 2011
Examen matematica convocatoria primera 2011
 
Teoria elemental del factorial ccesa007
Teoria elemental del factorial  ccesa007Teoria elemental del factorial  ccesa007
Teoria elemental del factorial ccesa007
 
Maths amazing facts
Maths amazing factsMaths amazing facts
Maths amazing facts
 
Taller función lineal, a fín y ecuación de la recta
Taller función lineal, a fín y ecuación de la rectaTaller función lineal, a fín y ecuación de la recta
Taller función lineal, a fín y ecuación de la recta
 
Tutorial linear equations and linear inequalities
Tutorial linear equations and linear inequalitiesTutorial linear equations and linear inequalities
Tutorial linear equations and linear inequalities
 
Sum and Difference of 2 cubes
Sum and Difference of 2 cubesSum and Difference of 2 cubes
Sum and Difference of 2 cubes
 
31+minutos+homotecia
31+minutos+homotecia31+minutos+homotecia
31+minutos+homotecia
 
Recurring Decimals
Recurring DecimalsRecurring Decimals
Recurring Decimals
 
1.6 solving linear inequalities
1.6 solving linear inequalities1.6 solving linear inequalities
1.6 solving linear inequalities
 
Ruang - Luas
Ruang - LuasRuang - Luas
Ruang - Luas
 
2/27/12 Special Factoring - Sum & Difference of Two Cubes
2/27/12 Special Factoring - Sum & Difference of Two Cubes2/27/12 Special Factoring - Sum & Difference of Two Cubes
2/27/12 Special Factoring - Sum & Difference of Two Cubes
 
Translating Mathematical Phrases into Algebraic Expressions or Equations
Translating Mathematical Phrases into Algebraic Expressions or EquationsTranslating Mathematical Phrases into Algebraic Expressions or Equations
Translating Mathematical Phrases into Algebraic Expressions or Equations
 
Soalan Bahasa Inggeris Tahun 1 Kertas 2(cefr)
Soalan Bahasa Inggeris Tahun 1 Kertas 2(cefr)Soalan Bahasa Inggeris Tahun 1 Kertas 2(cefr)
Soalan Bahasa Inggeris Tahun 1 Kertas 2(cefr)
 
Lembaran Kerja Darab, Bahagi dan Pecahan Tahun 2
Lembaran Kerja Darab, Bahagi dan Pecahan Tahun 2Lembaran Kerja Darab, Bahagi dan Pecahan Tahun 2
Lembaran Kerja Darab, Bahagi dan Pecahan Tahun 2
 
Actividad 4 teorema de thales.
Actividad 4 teorema de thales.Actividad 4 teorema de thales.
Actividad 4 teorema de thales.
 
Distance formula
Distance formulaDistance formula
Distance formula
 
Factoring Difference of Two Squares
Factoring Difference of Two SquaresFactoring Difference of Two Squares
Factoring Difference of Two Squares
 
3 2 polynomial inequalities
3 2 polynomial inequalities3 2 polynomial inequalities
3 2 polynomial inequalities
 
PDV: [Explicación] Matemáticas N°2 (2012)
PDV: [Explicación] Matemáticas N°2 (2012)PDV: [Explicación] Matemáticas N°2 (2012)
PDV: [Explicación] Matemáticas N°2 (2012)
 

Similar a 6.7 scatter plots and line of best fit

Applied Math 40S March 19, 2008
Applied Math 40S March 19, 2008Applied Math 40S March 19, 2008
Applied Math 40S March 19, 2008Darren Kuropatwa
 
Applied 40S March 25, 2009
Applied 40S March 25, 2009Applied 40S March 25, 2009
Applied 40S March 25, 2009Darren Kuropatwa
 
Applied Math 40S March 17, 2008
Applied Math 40S March 17, 2008Applied Math 40S March 17, 2008
Applied Math 40S March 17, 2008Darren Kuropatwa
 
De vry university math 221 assignment help
De vry university math 221 assignment helpDe vry university math 221 assignment help
De vry university math 221 assignment helpOlivia Fournier
 
Chapter 6 review
Chapter 6 reviewChapter 6 review
Chapter 6 reviewmlabuski
 
STAT 200 Introduction to Statistics Page 1 of91. True or .docx
STAT 200 Introduction to Statistics Page 1 of91. True or .docxSTAT 200 Introduction to Statistics Page 1 of91. True or .docx
STAT 200 Introduction to Statistics Page 1 of91. True or .docxwhitneyleman54422
 
(8) Lesson 9.3
(8) Lesson 9.3(8) Lesson 9.3
(8) Lesson 9.3wzuri
 
Day 8 histogram and pictograph
Day 8 histogram and pictographDay 8 histogram and pictograph
Day 8 histogram and pictographErik Tjersland
 
Day 8 histogram and pictograph
Day 8 histogram and pictographDay 8 histogram and pictograph
Day 8 histogram and pictographErik Tjersland
 
Chapter 9 Study Guide
Chapter 9 Study GuideChapter 9 Study Guide
Chapter 9 Study Guidewzuri
 
Mid module 1 test review
Mid module 1 test reviewMid module 1 test review
Mid module 1 test reviewmlabuski
 
(8) Lesson 8.1
(8) Lesson 8.1(8) Lesson 8.1
(8) Lesson 8.1wzuri
 
Lecture 01 (Mean, Median, Mode).pdf
Lecture 01 (Mean, Median, Mode).pdfLecture 01 (Mean, Median, Mode).pdf
Lecture 01 (Mean, Median, Mode).pdfSirRafiLectures
 
Math 221 Massive Success / snaptutorial.com
Math 221 Massive Success / snaptutorial.comMath 221 Massive Success / snaptutorial.com
Math 221 Massive Success / snaptutorial.comStephenson164
 
STAT 200 Final Exam (FALL 2016)
STAT 200 Final Exam (FALL 2016)STAT 200 Final Exam (FALL 2016)
STAT 200 Final Exam (FALL 2016)Vhristofer
 
(8) Lesson 9.2
(8) Lesson 9.2(8) Lesson 9.2
(8) Lesson 9.2wzuri
 
Test prep. unit 7 common core questions
Test prep.   unit 7 common core questionsTest prep.   unit 7 common core questions
Test prep. unit 7 common core questionsmlabuski
 
Answer all 20 questions. Make sure your answers are as complet.docx
Answer all 20 questions. Make sure your answers are as complet.docxAnswer all 20 questions. Make sure your answers are as complet.docx
Answer all 20 questions. Make sure your answers are as complet.docxfestockton
 
WEEK 7 mathematics 7, quarter 3 week 7..
WEEK 7 mathematics 7, quarter 3 week 7..WEEK 7 mathematics 7, quarter 3 week 7..
WEEK 7 mathematics 7, quarter 3 week 7..ArmanPuyao
 

Similar a 6.7 scatter plots and line of best fit (20)

Applied Math 40S March 19, 2008
Applied Math 40S March 19, 2008Applied Math 40S March 19, 2008
Applied Math 40S March 19, 2008
 
Applied 40S March 25, 2009
Applied 40S March 25, 2009Applied 40S March 25, 2009
Applied 40S March 25, 2009
 
Applied Math 40S March 17, 2008
Applied Math 40S March 17, 2008Applied Math 40S March 17, 2008
Applied Math 40S March 17, 2008
 
De vry university math 221 assignment help
De vry university math 221 assignment helpDe vry university math 221 assignment help
De vry university math 221 assignment help
 
Chapter 6 review
Chapter 6 reviewChapter 6 review
Chapter 6 review
 
STAT 200 Introduction to Statistics Page 1 of91. True or .docx
STAT 200 Introduction to Statistics Page 1 of91. True or .docxSTAT 200 Introduction to Statistics Page 1 of91. True or .docx
STAT 200 Introduction to Statistics Page 1 of91. True or .docx
 
(8) Lesson 9.3
(8) Lesson 9.3(8) Lesson 9.3
(8) Lesson 9.3
 
Practive test 1
Practive test 1Practive test 1
Practive test 1
 
Day 8 histogram and pictograph
Day 8 histogram and pictographDay 8 histogram and pictograph
Day 8 histogram and pictograph
 
Day 8 histogram and pictograph
Day 8 histogram and pictographDay 8 histogram and pictograph
Day 8 histogram and pictograph
 
Chapter 9 Study Guide
Chapter 9 Study GuideChapter 9 Study Guide
Chapter 9 Study Guide
 
Mid module 1 test review
Mid module 1 test reviewMid module 1 test review
Mid module 1 test review
 
(8) Lesson 8.1
(8) Lesson 8.1(8) Lesson 8.1
(8) Lesson 8.1
 
Lecture 01 (Mean, Median, Mode).pdf
Lecture 01 (Mean, Median, Mode).pdfLecture 01 (Mean, Median, Mode).pdf
Lecture 01 (Mean, Median, Mode).pdf
 
Math 221 Massive Success / snaptutorial.com
Math 221 Massive Success / snaptutorial.comMath 221 Massive Success / snaptutorial.com
Math 221 Massive Success / snaptutorial.com
 
STAT 200 Final Exam (FALL 2016)
STAT 200 Final Exam (FALL 2016)STAT 200 Final Exam (FALL 2016)
STAT 200 Final Exam (FALL 2016)
 
(8) Lesson 9.2
(8) Lesson 9.2(8) Lesson 9.2
(8) Lesson 9.2
 
Test prep. unit 7 common core questions
Test prep.   unit 7 common core questionsTest prep.   unit 7 common core questions
Test prep. unit 7 common core questions
 
Answer all 20 questions. Make sure your answers are as complet.docx
Answer all 20 questions. Make sure your answers are as complet.docxAnswer all 20 questions. Make sure your answers are as complet.docx
Answer all 20 questions. Make sure your answers are as complet.docx
 
WEEK 7 mathematics 7, quarter 3 week 7..
WEEK 7 mathematics 7, quarter 3 week 7..WEEK 7 mathematics 7, quarter 3 week 7..
WEEK 7 mathematics 7, quarter 3 week 7..
 

Más de MsKendall

10 4 practice
10 4 practice10 4 practice
10 4 practiceMsKendall
 
10 3 pracrice
10 3 pracrice10 3 pracrice
10 3 pracriceMsKendall
 
8.1, 3, 4 harder
8.1, 3, 4 harder8.1, 3, 4 harder
8.1, 3, 4 harderMsKendall
 
8.3 4 multiplication propertiex of exponents
8.3 4  multiplication propertiex of exponents8.3 4  multiplication propertiex of exponents
8.3 4 multiplication propertiex of exponentsMsKendall
 
8.1 practice
8.1 practice8.1 practice
8.1 practiceMsKendall
 
8.1 practice
8.1 practice8.1 practice
8.1 practiceMsKendall
 
7.6 systems of inequalities word problems
7.6 systems of inequalities word problems7.6 systems of inequalities word problems
7.6 systems of inequalities word problemsMsKendall
 
7.6 solving systems of inequalities hw (mixed forms)
7.6 solving systems of inequalities hw (mixed forms)7.6 solving systems of inequalities hw (mixed forms)
7.6 solving systems of inequalities hw (mixed forms)MsKendall
 
7.6 solving systems of inequalities cw (mixed forms)
7.6 solving systems of inequalities cw (mixed forms)7.6 solving systems of inequalities cw (mixed forms)
7.6 solving systems of inequalities cw (mixed forms)MsKendall
 
10 1 practice
10 1 practice10 1 practice
10 1 practiceMsKendall
 
7.6 practice
7.6 practice7.6 practice
7.6 practiceMsKendall
 
7.6 systems of inequalities
7.6 systems of inequalities7.6 systems of inequalities
7.6 systems of inequalitiesMsKendall
 
7.6 systems of inequalities worksheet
7.6 systems of inequalities worksheet7.6 systems of inequalities worksheet
7.6 systems of inequalities worksheetMsKendall
 
7.5 practice
7.5 practice7.5 practice
7.5 practiceMsKendall
 
9 5 practice (trig and area)
9 5 practice (trig and area)9 5 practice (trig and area)
9 5 practice (trig and area)MsKendall
 
9 5 practice (trig and area)
9 5 practice (trig and area)9 5 practice (trig and area)
9 5 practice (trig and area)MsKendall
 
7.4 word problems (by catgory)
7.4 word problems (by catgory)7.4 word problems (by catgory)
7.4 word problems (by catgory)MsKendall
 
7.1 7.3 review (11-12)
7.1 7.3 review (11-12)7.1 7.3 review (11-12)
7.1 7.3 review (11-12)MsKendall
 

Más de MsKendall (20)

10 4 practice
10 4 practice10 4 practice
10 4 practice
 
10 3 pracrice
10 3 pracrice10 3 pracrice
10 3 pracrice
 
8.1, 3, 4 harder
8.1, 3, 4 harder8.1, 3, 4 harder
8.1, 3, 4 harder
 
8.3 4 multiplication propertiex of exponents
8.3 4  multiplication propertiex of exponents8.3 4  multiplication propertiex of exponents
8.3 4 multiplication propertiex of exponents
 
8.1 practice
8.1 practice8.1 practice
8.1 practice
 
8.1 practice
8.1 practice8.1 practice
8.1 practice
 
7.6 systems of inequalities word problems
7.6 systems of inequalities word problems7.6 systems of inequalities word problems
7.6 systems of inequalities word problems
 
7.6 solving systems of inequalities hw (mixed forms)
7.6 solving systems of inequalities hw (mixed forms)7.6 solving systems of inequalities hw (mixed forms)
7.6 solving systems of inequalities hw (mixed forms)
 
7.6 solving systems of inequalities cw (mixed forms)
7.6 solving systems of inequalities cw (mixed forms)7.6 solving systems of inequalities cw (mixed forms)
7.6 solving systems of inequalities cw (mixed forms)
 
7.6 solving systems of inequalities hw (mixed forms)
7.6 solving systems of inequalities hw (mixed forms)7.6 solving systems of inequalities hw (mixed forms)
7.6 solving systems of inequalities hw (mixed forms)
 
7.6 solving systems of inequalities cw (mixed forms)
7.6 solving systems of inequalities cw (mixed forms)7.6 solving systems of inequalities cw (mixed forms)
7.6 solving systems of inequalities cw (mixed forms)
 
10 1 practice
10 1 practice10 1 practice
10 1 practice
 
7.6 practice
7.6 practice7.6 practice
7.6 practice
 
7.6 systems of inequalities
7.6 systems of inequalities7.6 systems of inequalities
7.6 systems of inequalities
 
7.6 systems of inequalities worksheet
7.6 systems of inequalities worksheet7.6 systems of inequalities worksheet
7.6 systems of inequalities worksheet
 
7.5 practice
7.5 practice7.5 practice
7.5 practice
 
9 5 practice (trig and area)
9 5 practice (trig and area)9 5 practice (trig and area)
9 5 practice (trig and area)
 
9 5 practice (trig and area)
9 5 practice (trig and area)9 5 practice (trig and area)
9 5 practice (trig and area)
 
7.4 word problems (by catgory)
7.4 word problems (by catgory)7.4 word problems (by catgory)
7.4 word problems (by catgory)
 
7.1 7.3 review (11-12)
7.1 7.3 review (11-12)7.1 7.3 review (11-12)
7.1 7.3 review (11-12)
 

6.7 scatter plots and line of best fit

  • 1. Name ________________________________________Hour_____ Date________ Scatter Plots and Lines of Best Fit Worksheet 1. MUSIC The scatter plot shows the number of CDs (in millions) that were sold from 1999 to 2005. If the trend continued, about how many CDs were sold in 2006? 2. FAMILY The table below shows the predicted annual cost for a middle income family to raise a child from birth until adulthood. Draw a scatter plot and describe what relationship exists within the data. 3. Make a scatter plot of the data in the table. Draw a line of best fit. What is the equation of the line of best fit? X -2 -2 -1 0 1 1 1 2 2 3 Y 2 3 2 1 0 1 -1 -1 -2 -2 4. EDUCATION The table at the right gives Study Hours 3 2 5 1 0 4 3 the number of hours spent studying for a Grade 84 77 92 70 60 90 75 science exam and the final exam grade. a. Draw a scatter plot of the data and draw in the line of best fit. b. What is the equation for the line of best fit? c. Predict the grade for a student who studied for 6 hours. d. Could this line go on forever? Why or why not?
  • 2. 5. BASEBALL The scatter plot shows the average price of a major-league baseball ticket from 1997 to 2006. a. Use the points (2001, 17.60) and (2002, 18.75) to write the slope-intercept form of equation for the line of fit shown in the scatter plot. b. Use your equation to tell the price of a ticket in 2009. Is this extrapolation or interpolation? 6. DISEASE The table shows the number of cases of Foodborne Botulism in the United States for the years 2001 to 2005. a. Draw a scatter plot and determine, what relationship, if any, exists in the data. b. Draw a line of fit for the scatter plot, and write the slope- intercept form of an equation for the line of fit. 7. ZOOS The table shows the average and maximum longevity of various animals in captivity. a. Draw a scatter plot and determine, what relationship, if any, exists in the data. b. Draw a line of fit for the scatter plot, and write the slope- intercept form of an equation for the line of fit. c. Predict the maximum longevity for an animal with an average longevity of 33 years. Is this an example of Extrapolation or Interpolation?