SlideShare una empresa de Scribd logo
1 de 9
Descargar para leer sin conexión
Hassan M. Ahmad AL-Kandari
Project Mgmt. Specialist ( S&E )
KUWAIT OIL COMPANY (KOC)
S-Curve analysis – Case Study
Abstract
Presentation of a case-study regarding the analysis of S-Curve of a life project draws a
concrete projection of a powerful tool in project management in all aspects (planning and
tracing and monitoring a project).
The analysis covers “ construction phase “ at different stages and steps of the original
planning and the revised planning including the turning points along the S-Curve
progress path in meeting the project’s objectives and in adding new values to the scope.
These turning points along the S-Curve path reflects the project management decision
making as well as adding values to the scope in term of adjustment orders and to push the
process further to the final destination “ move-in mobilization and handing over the
project “ to the users. The core question, Is it possible to intervene in a way to push the
on going process and bring the deviation back to the S-Curve path after fulfillment of the
shortage in planning sources and time scheduling?
Introduction
S-Curve Analysis provides sound evaluation and depicts a clear picture of a project
process and its development.
Projects are considered living-system; this means the stages of process has a natural cycle
with dynamically changing along the path of the project life cycle. That makes the project
management’s potentiality high and challenging to meet all milestones objectives and the
planned requirements successfully. Also, S-Curve provides a practical ground for PM
decisions and actions. The frame-work of the S-Curve from the start-up (birth) and
growth along the path development to the completion (maturation stage), then to have the
decline stage, thus all projects experience constant changes during the life cycle process.
The S-Curve is a Model for observing a project process through known phases
(conceptual, design, contractual, construction, utilization and operation, modification and
obsolescence for getting red-off and recycling finally) and to monitor stages of each
phase.
The interpolation of S-Curve analysis gives the indication, as reading the X-Ray of a
patient, of historical development and the deviation from the established previously
planned.
These deviations draw the actual progress (see figure.5 ).
S-Curve as tool presents resources relationships in term of different variables which are
scaled as percentages (% costs) in relation to the time variable, this relationships draw the
future path to meet the objectives and the final target goal, also S-Curve helps the
communication management (reporting, meetings, coordination, directives, and the
adjustments orders along the path) and the teams participations in decision making.
Nature of the S-Curve
The general appearance of an S-Curve is flatter at the beginning and end and steeper in
the middle. The S-Curve is a logistic curve describes how the work’s progresses and
changes diffuse through certain path. The S-Curve’s shape shows an initial period of slow
change the accelerated and rapid change in the middle, and then followed by slowing
down as the growth approached to the completion stage.
Also, in construction phase the S-Curve illustrates the starting site mobilization and
preparation of technical documentations, workshop drawings, getting approvals of parties
beside on-going some activities such as earth work preparation and surveying works, etc.
Where at the growth stage the exponential materialization of structures and the facilities
and the support services of a project’s components takes place.
Overall we can say that S-Curve gives a comprehensive picture of the project’s progress,
and at the same time is a flexible framework to manage a project successfully and
understand the causes and effects of all involved variables and the resources in relation to
the time scale.
Thus the S-Curve graphically traces and allows a quick and timely identification of the
problems that might negatively affects the progress of a project through periodical reports
and highlighting the actual against the planned activities and answers crucial questions:
• Will the project be completed as scheduled?
• What are the expected dates of completion of different activities as at present
rate?
• How many costs or the payments (invoices) are incurred on particular date?
Background Case-study Project
The following is the brief components of the projects under the study as an example
to our case-study of S-Curve analysis:
S-Curve – at the construction phase (Model):
S-Curve as PM tool at the construction phase consists of cumulative costs, other
quantitative variables (Activities Packages) plotted against time variable. The base for
S-Curve is the work break down structure (WBS) which is breakdown of the work
into systematic and logical components packages, these components are reflected
through activities with dates, costs, and weighting percentage on the vertical axis.
Figure- 1
Baseline S-Curve Model (see figure – 1):
The above S-Curve in general shows cumulative costs expended over time for the
duration of the project, and used to assist in calculation of the project’s cash flow.
Prior to project commencement. A schedule is outlining the proposed allocation of
resources and timing of tasks necessary to complete the project within a set of time-
frame and budget. Thus the original schedule is referred to as baseline S-Curve. This
S-Curve reflects the planned progress of a project.
Actual S-Curves case-study, (Figure- 2, Figure-3, Figure-4)
Time (in months)
Start-up Stage Growth stage Commissioning
TThhee PPrroojjeecctt ssiittee iiss llooccaatteedd iinn
tthhee BBuurrggaann OOiill FFiieelldd bbeehhiinndd
tthhee BBuurrggaann FFiirree SSttaattiioonn..
TThhee PPlloott aarreeaa iiss
aapppprrooxxiimmaatteellyy 118800mm xx 220000 mm
==3366000000mm22
The following planned S-Curves are updated on a regular basis (monthly) throughout
the duration of the project. These updates include the revision of percentage
completed for each task to-date. The planned and the revised planned S-Curves are
generated which reflect by presenting on-going S-Curve as an actual progress of the
project to-date, and is compared with baseline to determine How the project has been
progressed.
ORIGNAL S-CURVE
0.00%
10.00%
20.00%
30.00%
40.00%
50.00%
60.00%
70.00%
80.00%
90.00%
100.00%
A
pr-05
Jun-05
A
ug-05
O
ct-05
D
ec-05
Feb-06
A
pr-06
Jun-06
A
ug-06
O
ct-06
D
ec-06
Feb-07
A
pr-07
Jun-07
A
ug-07
O
ct-07
D
ec-07
Cumulative Percentage (Early) up 09.09.2006
Cumulative Percentage (late) up 09.09.2006
Actual
Figure- 2
EXT.NO 2 S-CURVE
0.00%
10.00%
20.00%
30.00%
40.00%
50.00%
60.00%
70.00%
80.00%
90.00%
100.00%
Apr-05
Jun-05
Aug-05
O
ct-05
D
ec-05
Feb-06
Apr-06
Jun-06
Aug-06
O
ct-06
D
ec-06
Feb-07
Apr-07
Jun-07
Aug-07
O
ct-07
D
ec-07
Cumulative Percentage (Early) up 09.09.2006
Cumulative Percentage (late) up 09.09.2006
Cumulative Percentage (Early) up 30.12.2006
Cumulative Percentage (late) up 30.12.2006
Cumulative Percentage (Early) up 28.06.2007
Cumulative Percentage (late) up 28.06.2007
Actual
Figure-3
EXT. NO 3 S-CURVE
0.00%
10.00%
20.00%
30.00%
40.00%
50.00%
60.00%
70.00%
80.00%
90.00%
100.00%
Apr-05Jun-05Aug-05Oct-05Dec-05Feb-06Apr-06Jun-06Aug-06Oct-06Dec-06Feb-07Apr-07Jun-07Aug-07Oct-07Dec-07
Cumulative Percentage (Early) up 09.09.2006
Cumulative Percentage (late) up 09.09.2006
Cumulative Percentage (Early) up 30.12.2006
Cumulative Percentage (late) up 30.12.2006
Cumulative Percentage (Early) up 28.06.2007
Cumulative Percentage (late) up 28.06.2007
Cumulative Percentage (Early) up 28.12.2007
Cumulative Percentage (late) up 28.12.2007
Actual
Figure-4
Analysis:
The above S-Curves ‘s figures ( 2,3,4 ) illustrate the changes and the shortfalls in the
construction process and highlight the project development and help us to understand
a practical construction management to push forward the project path to the final
commissioning stage, that means to bring the S-curve path to or near the model S-
Curve figure-1.
This study adds values to PM Knowledge as lesson learned and how to optimize
solutions for typical projects in the future and reinforce the knowledge management
system within the organization.
It is clear that original S-Curve in figure (2,) is far behind the model S-Curve due to
some causes which will be highlighted by this case-study. The Stat-up stage of the S-
Curve shows very flat covers more than 60% of the original contract period. Next, the
original growth S-Curve stage appears very high steeped, that don’t leave any space
for commissioning stage at all.
That’s dictated to modify the process and introduce a turning point by adding an
adjustment order in term of scope (additional offices area) and 3month time extension
to smooth the work process, as shown in figure (3), where is the turning point along
the work progress directs to the next step towards modifying a situation by proposing
a second adjustment order with time extension of 6month more to the contract
duration.
By the second adjustment order the S-Curve Growth Stage shaped to have some
characteristic of the S-Curve Model, but it’s clear that still it needs more span to come
to a turning point for the next completion stage (commissioning stage). Even though
the 2nd
adjustment order gave some breath to coach-up an increase in the level of
performance, but still this growth behind the picture of the S-Curve Model, which
forced the PM team to fight for an additional 3rd
adjustment order of 6 months in term
of time, to uplift the growth part of the S-Curve’s work process further in a steeped
way to meet the commissioning stage and bring the project to its final completion
“handing –over moment”.
Analysis and findings:
In the following S-Curve (figure-5) represents the summary of the actual S-Curve for
the whole construction stage duration (original contractual duration and the additional
time variation durations).
EXT. NO 3 S-CURVE
0.00%
10.00%
20.00%
30.00%
40.00%
50.00%
60.00%
70.00%
80.00%
90.00%
100.00%
Mar-05
May-05
Jul-05
Sep-05
Nov-05
Jan-06
Mar-06
May-06
Jul-06
Sep-06
Nov-06
Jan-07
Mar-07
May-07
Jul-07
Sep-07
Nov-07
Cumulative Percentage (late) up 28.12.2007
Actual
Figure-5
This figure-5, the actual S-curve has been projected as accumulated data from the
monthly progress report. Also, the report depicts the following brief of the major
events as progress status of this case-study’s project.
• Commencement date: 19 March 2006.
• Contractual Completion Date: 9 Sep. 2006, with 60% actual progress.
• 1st
Revised completion date is Dec. 2006, with 70% actual progress (Time
extension 3 months).
• 2nd
Revision completion date: 28Jun. 2007, with 80% actual progress (Time
extension 6 months).
• 3rd
Revision completion date: 28Dec.2007, with 100% planned progress ( Time
extension 6 months ).
Findings in term of time-frame based on the above projected actual S-Curve and the
status reports:
To answer this question we introduce the following interpolation tabulation of time
duration parentages needed to complete the project and to bring the shape of the actual S-
Curve to the natural model S-Curve, which represents the logical progress of a project.
Thus, the analyzed actual S-Curve duration after variations is ……………
The following table is construction’s time interpolation after the variations in time
extension to bring the actual S-Curve to the Model S-Curve shape:
Interpolation Table
Conclusion:
S-Curve pictures clear situations at all level and shapes the performance path of a project
graphically, which precisely examine the input variables and the results qualitatively and
quantitatively.
Based on the S-Curve analysis we can answer the question stipulated at the beginning,
that we can manage the S-Curve rectification and smoothing the performance process
during any project’s phase considering the following:
• Project’s Failure in some aspects is inevitable, but bringing the outcomes to the
successful end is the challenging corner-stone in any project.
• Risk and failure are viewed as lessons learned for future, thus the variation is a
hallmark of creative practice in any project when it adds values, and when it
enriches PM practice with exiting new ideas.
• By reading the S-Curve carefully and monitoring turning points along the path,
we can mange to push the project forwards.
• By smoothing S-Curve through coordination and supporting activities of team’s
participation in meeting the time schedules.
• By flagging the problems and the vital issues by all participants and concerned
groups at the right time.
• Besides maintaining the contractual and quality obligations, we can enhance
flexibility of work conditions by new approaches and alternatives to strengthen
better solutions.
• Adapting creative approach in managing the whole process such as walking-
management, and walking meeting progress on the spot, besides the traditional
progress meeting to insure the interaction among the participants, and turning the
r knowledge into action.
References:
1. Logistic function / of logistic curve from Wikipedia, Fee encyclopedia
www. Wikipedia . Org / logistic-curve.
2. New tools for project managers: Evolution of s-curve and earned value formation
Denis F. Cioffi, ph. D – A presentation Conference on PM at 3rd
Caribbean & Latin
May 2003.
3. Human Resources Development in Knowledge- based Economy. THE Emirates
Center for Strategic Studies and Research- 2003.
Abu Dabi, United Arab Emirates.

Más contenido relacionado

La actualidad más candente

J.S. Daniel paper of fast tracking design in megaproject construction
J.S. Daniel paper of fast tracking design in megaproject constructionJ.S. Daniel paper of fast tracking design in megaproject construction
J.S. Daniel paper of fast tracking design in megaproject constructionJ.S. Daniel
 
Planning, scheduling and resource allocation
Planning, scheduling and resource allocationPlanning, scheduling and resource allocation
Planning, scheduling and resource allocationJatin Mandhyan
 
What are the disadvantages of Gantt charts?
What are the disadvantages of Gantt charts?What are the disadvantages of Gantt charts?
What are the disadvantages of Gantt charts?PMA Consultants
 
Visio-Planning FlowChart-3
Visio-Planning FlowChart-3Visio-Planning FlowChart-3
Visio-Planning FlowChart-3Allan Leyte
 
Lecture5---Gantt Chart
Lecture5---Gantt ChartLecture5---Gantt Chart
Lecture5---Gantt Chartdanishrafiq
 
Brian Nicholls resume 2016-08-11
Brian Nicholls resume   2016-08-11Brian Nicholls resume   2016-08-11
Brian Nicholls resume 2016-08-11Brian Nicholls
 
3.1 the usage of bar chart
3.1 the usage of bar chart3.1 the usage of bar chart
3.1 the usage of bar chartNatalie Ulza
 
Earned value analysis for a construction project
Earned value analysis for a construction projectEarned value analysis for a construction project
Earned value analysis for a construction projectIAEME Publication
 
J.S. Daniel paper for practical checklist of schedule
J.S. Daniel paper for practical checklist of scheduleJ.S. Daniel paper for practical checklist of schedule
J.S. Daniel paper for practical checklist of scheduleJ.S. Daniel
 
Resume - Suzanne Pearce
Resume - Suzanne PearceResume - Suzanne Pearce
Resume - Suzanne PearceSuzanne Pearce
 

La actualidad más candente (18)

J.S. Daniel paper of fast tracking design in megaproject construction
J.S. Daniel paper of fast tracking design in megaproject constructionJ.S. Daniel paper of fast tracking design in megaproject construction
J.S. Daniel paper of fast tracking design in megaproject construction
 
Shahzad Sikandaruk
Shahzad SikandarukShahzad Sikandaruk
Shahzad Sikandaruk
 
Planning, scheduling and resource allocation
Planning, scheduling and resource allocationPlanning, scheduling and resource allocation
Planning, scheduling and resource allocation
 
Introduction to the project managment
Introduction to the project managment Introduction to the project managment
Introduction to the project managment
 
140 workplan
140 workplan140 workplan
140 workplan
 
LINE OF BALANACE
LINE OF BALANACELINE OF BALANACE
LINE OF BALANACE
 
Gantt and PERT chart
Gantt and PERT chartGantt and PERT chart
Gantt and PERT chart
 
Edg resume 06.2016
Edg resume 06.2016Edg resume 06.2016
Edg resume 06.2016
 
What are the disadvantages of Gantt charts?
What are the disadvantages of Gantt charts?What are the disadvantages of Gantt charts?
What are the disadvantages of Gantt charts?
 
Visio-Planning FlowChart-3
Visio-Planning FlowChart-3Visio-Planning FlowChart-3
Visio-Planning FlowChart-3
 
139 workplan
139 workplan139 workplan
139 workplan
 
Lecture5---Gantt Chart
Lecture5---Gantt ChartLecture5---Gantt Chart
Lecture5---Gantt Chart
 
Brian Nicholls resume 2016-08-11
Brian Nicholls resume   2016-08-11Brian Nicholls resume   2016-08-11
Brian Nicholls resume 2016-08-11
 
3.1 the usage of bar chart
3.1 the usage of bar chart3.1 the usage of bar chart
3.1 the usage of bar chart
 
Earned value analysis for a construction project
Earned value analysis for a construction projectEarned value analysis for a construction project
Earned value analysis for a construction project
 
J.S. Daniel paper for practical checklist of schedule
J.S. Daniel paper for practical checklist of scheduleJ.S. Daniel paper for practical checklist of schedule
J.S. Daniel paper for practical checklist of schedule
 
RINAL_PATEL
RINAL_PATELRINAL_PATEL
RINAL_PATEL
 
Resume - Suzanne Pearce
Resume - Suzanne PearceResume - Suzanne Pearce
Resume - Suzanne Pearce
 

Destacado (18)

Isarc2007 4.3 2-065
Isarc2007 4.3 2-065Isarc2007 4.3 2-065
Isarc2007 4.3 2-065
 
73
7373
73
 
Pras s curve final
Pras s curve finalPras s curve final
Pras s curve final
 
Exploring the limits_of_the_technology_s-curve
Exploring the limits_of_the_technology_s-curveExploring the limits_of_the_technology_s-curve
Exploring the limits_of_the_technology_s-curve
 
4267
42674267
4267
 
1005.2122
1005.21221005.2122
1005.2122
 
Jce 64 2012_8_3_1036_en
Jce 64 2012_8_3_1036_enJce 64 2012_8_3_1036_en
Jce 64 2012_8_3_1036_en
 
73
7373
73
 
The origins of the s curve in business functions
The origins of the s curve in business functionsThe origins of the s curve in business functions
The origins of the s curve in business functions
 
Pras s curve final
Pras s curve finalPras s curve final
Pras s curve final
 
Accenture jumping the_s_curve
Accenture jumping the_s_curveAccenture jumping the_s_curve
Accenture jumping the_s_curve
 
Jce 64 2012_8_3_1036_en
Jce 64 2012_8_3_1036_enJce 64 2012_8_3_1036_en
Jce 64 2012_8_3_1036_en
 
Scurve231 m en
Scurve231 m enScurve231 m en
Scurve231 m en
 
The mysterious s_curve
The mysterious s_curveThe mysterious s_curve
The mysterious s_curve
 
1005.2122
1005.21221005.2122
1005.2122
 
Gartner maturity and adoption 1
Gartner maturity and adoption 1Gartner maturity and adoption 1
Gartner maturity and adoption 1
 
S curve
S curveS curve
S curve
 
A project report on re-refining of used lube oil
A project report on re-refining of used lube oilA project report on re-refining of used lube oil
A project report on re-refining of used lube oil
 

Similar a S curve1

PROJECT MANAGEMENT _PPT_VIS
PROJECT MANAGEMENT _PPT_VISPROJECT MANAGEMENT _PPT_VIS
PROJECT MANAGEMENT _PPT_VIStpvishnu1
 
ContentsPart 1 Build a Methodology4Abstract4Introductio
ContentsPart 1 Build a Methodology4Abstract4IntroductioContentsPart 1 Build a Methodology4Abstract4Introductio
ContentsPart 1 Build a Methodology4Abstract4IntroductioAlleneMcclendon878
 
Project Management Techniques ( WBS & Critical Path Method )
Project Management Techniques ( WBS & Critical Path Method )Project Management Techniques ( WBS & Critical Path Method )
Project Management Techniques ( WBS & Critical Path Method )Surajkumar Sonar
 
Data Evaluation and Modeling for Product Definition Engineering - ISE 677
Data Evaluation and Modeling for Product Definition Engineering - ISE 677Data Evaluation and Modeling for Product Definition Engineering - ISE 677
Data Evaluation and Modeling for Product Definition Engineering - ISE 677Justin Davies
 
EARNED VALUE ANALYSIS FOR A CONSTRUCTION PROJECT
EARNED VALUE ANALYSIS FOR A CONSTRUCTION PROJECTEARNED VALUE ANALYSIS FOR A CONSTRUCTION PROJECT
EARNED VALUE ANALYSIS FOR A CONSTRUCTION PROJECTIAEME Publication
 
Line of Balance
Line of BalanceLine of Balance
Line of BalanceIJMER
 
Conveyor Belt Project Report
Conveyor Belt Project ReportConveyor Belt Project Report
Conveyor Belt Project ReportRISHABHSIINGH
 
2 project management 3
2 project management 32 project management 3
2 project management 3Narayan Mane
 
Tracking a Typical Apartment Construction using Earned Value Management
Tracking a Typical Apartment Construction using Earned Value ManagementTracking a Typical Apartment Construction using Earned Value Management
Tracking a Typical Apartment Construction using Earned Value ManagementIRJET Journal
 
PM office this fueje se siehesjksjrwl jsmsof india.pdf
PM office this fueje se siehesjksjrwl jsmsof india.pdfPM office this fueje se siehesjksjrwl jsmsof india.pdf
PM office this fueje se siehesjksjrwl jsmsof india.pdfgauravkumar4594
 
What is Project Management_PDF.pdf
What is Project Management_PDF.pdfWhat is Project Management_PDF.pdf
What is Project Management_PDF.pdfDivyaNair573905
 
PROJECT SCHEDULE
PROJECT SCHEDULEPROJECT SCHEDULE
PROJECT SCHEDULEAjeesh Mk
 

Similar a S curve1 (20)

Unit 5.pdf
Unit 5.pdfUnit 5.pdf
Unit 5.pdf
 
PROJECT MANAGEMENT _PPT_VIS
PROJECT MANAGEMENT _PPT_VISPROJECT MANAGEMENT _PPT_VIS
PROJECT MANAGEMENT _PPT_VIS
 
CSC-1986.original
CSC-1986.originalCSC-1986.original
CSC-1986.original
 
Project Planning and Development
Project Planning and DevelopmentProject Planning and Development
Project Planning and Development
 
Project management
Project managementProject management
Project management
 
ContentsPart 1 Build a Methodology4Abstract4Introductio
ContentsPart 1 Build a Methodology4Abstract4IntroductioContentsPart 1 Build a Methodology4Abstract4Introductio
ContentsPart 1 Build a Methodology4Abstract4Introductio
 
CCP_SEC3_Planning and Scheduling
CCP_SEC3_Planning and SchedulingCCP_SEC3_Planning and Scheduling
CCP_SEC3_Planning and Scheduling
 
H1303055462
H1303055462H1303055462
H1303055462
 
Project Management Techniques ( WBS & Critical Path Method )
Project Management Techniques ( WBS & Critical Path Method )Project Management Techniques ( WBS & Critical Path Method )
Project Management Techniques ( WBS & Critical Path Method )
 
Data Evaluation and Modeling for Product Definition Engineering - ISE 677
Data Evaluation and Modeling for Product Definition Engineering - ISE 677Data Evaluation and Modeling for Product Definition Engineering - ISE 677
Data Evaluation and Modeling for Product Definition Engineering - ISE 677
 
EARNED VALUE ANALYSIS FOR A CONSTRUCTION PROJECT
EARNED VALUE ANALYSIS FOR A CONSTRUCTION PROJECTEARNED VALUE ANALYSIS FOR A CONSTRUCTION PROJECT
EARNED VALUE ANALYSIS FOR A CONSTRUCTION PROJECT
 
Line of Balance
Line of BalanceLine of Balance
Line of Balance
 
Conveyor Belt Project Report
Conveyor Belt Project ReportConveyor Belt Project Report
Conveyor Belt Project Report
 
2 project management 3
2 project management 32 project management 3
2 project management 3
 
Tracking a Typical Apartment Construction using Earned Value Management
Tracking a Typical Apartment Construction using Earned Value ManagementTracking a Typical Apartment Construction using Earned Value Management
Tracking a Typical Apartment Construction using Earned Value Management
 
PM.pdf
PM.pdfPM.pdf
PM.pdf
 
PM.pdf
PM.pdfPM.pdf
PM.pdf
 
PM office this fueje se siehesjksjrwl jsmsof india.pdf
PM office this fueje se siehesjksjrwl jsmsof india.pdfPM office this fueje se siehesjksjrwl jsmsof india.pdf
PM office this fueje se siehesjksjrwl jsmsof india.pdf
 
What is Project Management_PDF.pdf
What is Project Management_PDF.pdfWhat is Project Management_PDF.pdf
What is Project Management_PDF.pdf
 
PROJECT SCHEDULE
PROJECT SCHEDULEPROJECT SCHEDULE
PROJECT SCHEDULE
 

Más de Muhammad Sadiq Aftab (20)

Tsc
TscTsc
Tsc
 
Technology s curves-in_renewable_energies
Technology s curves-in_renewable_energiesTechnology s curves-in_renewable_energies
Technology s curves-in_renewable_energies
 
Scurve231 m en
Scurve231 m enScurve231 m en
Scurve231 m en
 
Tcf2007 dk rdg
Tcf2007 dk rdgTcf2007 dk rdg
Tcf2007 dk rdg
 
S curve1
S curve1S curve1
S curve1
 
S curve tutorial1
S curve tutorial1S curve tutorial1
S curve tutorial1
 
S curve
S curveS curve
S curve
 
Innovation lifecycles
Innovation lifecyclesInnovation lifecycles
Innovation lifecycles
 
Gartner maturity and adoption 1
Gartner maturity and adoption 1Gartner maturity and adoption 1
Gartner maturity and adoption 1
 
Ga2000 gp25(3) enz
Ga2000 gp25(3) enzGa2000 gp25(3) enz
Ga2000 gp25(3) enz
 
Exploring the limits_of_the_technology_s-curve
Exploring the limits_of_the_technology_s-curveExploring the limits_of_the_technology_s-curve
Exploring the limits_of_the_technology_s-curve
 
Easec13 e-3-1
Easec13 e-3-1Easec13 e-3-1
Easec13 e-3-1
 
Brice dattee
Brice datteeBrice dattee
Brice dattee
 
Bowden 0
Bowden 0Bowden 0
Bowden 0
 
2007 02t
2007 02t2007 02t
2007 02t
 
109 bahmani oskooee
109 bahmani oskooee109 bahmani oskooee
109 bahmani oskooee
 
Tsc
TscTsc
Tsc
 
The mysterious s_curve
The mysterious s_curveThe mysterious s_curve
The mysterious s_curve
 
Technology s curves-in_renewable_energies
Technology s curves-in_renewable_energiesTechnology s curves-in_renewable_energies
Technology s curves-in_renewable_energies
 
Tcf2007 dk rdg
Tcf2007 dk rdgTcf2007 dk rdg
Tcf2007 dk rdg
 

Último

Computer Graphics Introduction, Open GL, Line and Circle drawing algorithm
Computer Graphics Introduction, Open GL, Line and Circle drawing algorithmComputer Graphics Introduction, Open GL, Line and Circle drawing algorithm
Computer Graphics Introduction, Open GL, Line and Circle drawing algorithmDeepika Walanjkar
 
Robotics Group 10 (Control Schemes) cse.pdf
Robotics Group 10  (Control Schemes) cse.pdfRobotics Group 10  (Control Schemes) cse.pdf
Robotics Group 10 (Control Schemes) cse.pdfsahilsajad201
 
Stork Webinar | APM Transformational planning, Tool Selection & Performance T...
Stork Webinar | APM Transformational planning, Tool Selection & Performance T...Stork Webinar | APM Transformational planning, Tool Selection & Performance T...
Stork Webinar | APM Transformational planning, Tool Selection & Performance T...Stork
 
Robotics-Asimov's Laws, Mechanical Subsystems, Robot Kinematics, Robot Dynami...
Robotics-Asimov's Laws, Mechanical Subsystems, Robot Kinematics, Robot Dynami...Robotics-Asimov's Laws, Mechanical Subsystems, Robot Kinematics, Robot Dynami...
Robotics-Asimov's Laws, Mechanical Subsystems, Robot Kinematics, Robot Dynami...Sumanth A
 
multiple access in wireless communication
multiple access in wireless communicationmultiple access in wireless communication
multiple access in wireless communicationpanditadesh123
 
THE SENDAI FRAMEWORK FOR DISASTER RISK REDUCTION
THE SENDAI FRAMEWORK FOR DISASTER RISK REDUCTIONTHE SENDAI FRAMEWORK FOR DISASTER RISK REDUCTION
THE SENDAI FRAMEWORK FOR DISASTER RISK REDUCTIONjhunlian
 
2022 AWS DNA Hackathon 장애 대응 솔루션 jarvis.
2022 AWS DNA Hackathon 장애 대응 솔루션 jarvis.2022 AWS DNA Hackathon 장애 대응 솔루션 jarvis.
2022 AWS DNA Hackathon 장애 대응 솔루션 jarvis.elesangwon
 
"Exploring the Essential Functions and Design Considerations of Spillways in ...
"Exploring the Essential Functions and Design Considerations of Spillways in ..."Exploring the Essential Functions and Design Considerations of Spillways in ...
"Exploring the Essential Functions and Design Considerations of Spillways in ...Erbil Polytechnic University
 
Levelling - Rise and fall - Height of instrument method
Levelling - Rise and fall - Height of instrument methodLevelling - Rise and fall - Height of instrument method
Levelling - Rise and fall - Height of instrument methodManicka Mamallan Andavar
 
KCD Costa Rica 2024 - Nephio para parvulitos
KCD Costa Rica 2024 - Nephio para parvulitosKCD Costa Rica 2024 - Nephio para parvulitos
KCD Costa Rica 2024 - Nephio para parvulitosVictor Morales
 
SOFTWARE ESTIMATION COCOMO AND FP CALCULATION
SOFTWARE ESTIMATION COCOMO AND FP CALCULATIONSOFTWARE ESTIMATION COCOMO AND FP CALCULATION
SOFTWARE ESTIMATION COCOMO AND FP CALCULATIONSneha Padhiar
 
High Voltage Engineering- OVER VOLTAGES IN ELECTRICAL POWER SYSTEMS
High Voltage Engineering- OVER VOLTAGES IN ELECTRICAL POWER SYSTEMSHigh Voltage Engineering- OVER VOLTAGES IN ELECTRICAL POWER SYSTEMS
High Voltage Engineering- OVER VOLTAGES IN ELECTRICAL POWER SYSTEMSsandhya757531
 
Katarzyna Lipka-Sidor - BIM School Course
Katarzyna Lipka-Sidor - BIM School CourseKatarzyna Lipka-Sidor - BIM School Course
Katarzyna Lipka-Sidor - BIM School Coursebim.edu.pl
 
ROBOETHICS-CCS345 ETHICS AND ARTIFICIAL INTELLIGENCE.ppt
ROBOETHICS-CCS345 ETHICS AND ARTIFICIAL INTELLIGENCE.pptROBOETHICS-CCS345 ETHICS AND ARTIFICIAL INTELLIGENCE.ppt
ROBOETHICS-CCS345 ETHICS AND ARTIFICIAL INTELLIGENCE.pptJohnWilliam111370
 
US Department of Education FAFSA Week of Action
US Department of Education FAFSA Week of ActionUS Department of Education FAFSA Week of Action
US Department of Education FAFSA Week of ActionMebane Rash
 
『澳洲文凭』买麦考瑞大学毕业证书成绩单办理澳洲Macquarie文凭学位证书
『澳洲文凭』买麦考瑞大学毕业证书成绩单办理澳洲Macquarie文凭学位证书『澳洲文凭』买麦考瑞大学毕业证书成绩单办理澳洲Macquarie文凭学位证书
『澳洲文凭』买麦考瑞大学毕业证书成绩单办理澳洲Macquarie文凭学位证书rnrncn29
 
Mine Environment II Lab_MI10448MI__________.pptx
Mine Environment II Lab_MI10448MI__________.pptxMine Environment II Lab_MI10448MI__________.pptx
Mine Environment II Lab_MI10448MI__________.pptxRomil Mishra
 
Prach: A Feature-Rich Platform Empowering the Autism Community
Prach: A Feature-Rich Platform Empowering the Autism CommunityPrach: A Feature-Rich Platform Empowering the Autism Community
Prach: A Feature-Rich Platform Empowering the Autism Communityprachaibot
 
Earthing details of Electrical Substation
Earthing details of Electrical SubstationEarthing details of Electrical Substation
Earthing details of Electrical Substationstephanwindworld
 

Último (20)

Computer Graphics Introduction, Open GL, Line and Circle drawing algorithm
Computer Graphics Introduction, Open GL, Line and Circle drawing algorithmComputer Graphics Introduction, Open GL, Line and Circle drawing algorithm
Computer Graphics Introduction, Open GL, Line and Circle drawing algorithm
 
Robotics Group 10 (Control Schemes) cse.pdf
Robotics Group 10  (Control Schemes) cse.pdfRobotics Group 10  (Control Schemes) cse.pdf
Robotics Group 10 (Control Schemes) cse.pdf
 
Stork Webinar | APM Transformational planning, Tool Selection & Performance T...
Stork Webinar | APM Transformational planning, Tool Selection & Performance T...Stork Webinar | APM Transformational planning, Tool Selection & Performance T...
Stork Webinar | APM Transformational planning, Tool Selection & Performance T...
 
Robotics-Asimov's Laws, Mechanical Subsystems, Robot Kinematics, Robot Dynami...
Robotics-Asimov's Laws, Mechanical Subsystems, Robot Kinematics, Robot Dynami...Robotics-Asimov's Laws, Mechanical Subsystems, Robot Kinematics, Robot Dynami...
Robotics-Asimov's Laws, Mechanical Subsystems, Robot Kinematics, Robot Dynami...
 
multiple access in wireless communication
multiple access in wireless communicationmultiple access in wireless communication
multiple access in wireless communication
 
THE SENDAI FRAMEWORK FOR DISASTER RISK REDUCTION
THE SENDAI FRAMEWORK FOR DISASTER RISK REDUCTIONTHE SENDAI FRAMEWORK FOR DISASTER RISK REDUCTION
THE SENDAI FRAMEWORK FOR DISASTER RISK REDUCTION
 
2022 AWS DNA Hackathon 장애 대응 솔루션 jarvis.
2022 AWS DNA Hackathon 장애 대응 솔루션 jarvis.2022 AWS DNA Hackathon 장애 대응 솔루션 jarvis.
2022 AWS DNA Hackathon 장애 대응 솔루션 jarvis.
 
"Exploring the Essential Functions and Design Considerations of Spillways in ...
"Exploring the Essential Functions and Design Considerations of Spillways in ..."Exploring the Essential Functions and Design Considerations of Spillways in ...
"Exploring the Essential Functions and Design Considerations of Spillways in ...
 
Levelling - Rise and fall - Height of instrument method
Levelling - Rise and fall - Height of instrument methodLevelling - Rise and fall - Height of instrument method
Levelling - Rise and fall - Height of instrument method
 
KCD Costa Rica 2024 - Nephio para parvulitos
KCD Costa Rica 2024 - Nephio para parvulitosKCD Costa Rica 2024 - Nephio para parvulitos
KCD Costa Rica 2024 - Nephio para parvulitos
 
SOFTWARE ESTIMATION COCOMO AND FP CALCULATION
SOFTWARE ESTIMATION COCOMO AND FP CALCULATIONSOFTWARE ESTIMATION COCOMO AND FP CALCULATION
SOFTWARE ESTIMATION COCOMO AND FP CALCULATION
 
Designing pile caps according to ACI 318-19.pptx
Designing pile caps according to ACI 318-19.pptxDesigning pile caps according to ACI 318-19.pptx
Designing pile caps according to ACI 318-19.pptx
 
High Voltage Engineering- OVER VOLTAGES IN ELECTRICAL POWER SYSTEMS
High Voltage Engineering- OVER VOLTAGES IN ELECTRICAL POWER SYSTEMSHigh Voltage Engineering- OVER VOLTAGES IN ELECTRICAL POWER SYSTEMS
High Voltage Engineering- OVER VOLTAGES IN ELECTRICAL POWER SYSTEMS
 
Katarzyna Lipka-Sidor - BIM School Course
Katarzyna Lipka-Sidor - BIM School CourseKatarzyna Lipka-Sidor - BIM School Course
Katarzyna Lipka-Sidor - BIM School Course
 
ROBOETHICS-CCS345 ETHICS AND ARTIFICIAL INTELLIGENCE.ppt
ROBOETHICS-CCS345 ETHICS AND ARTIFICIAL INTELLIGENCE.pptROBOETHICS-CCS345 ETHICS AND ARTIFICIAL INTELLIGENCE.ppt
ROBOETHICS-CCS345 ETHICS AND ARTIFICIAL INTELLIGENCE.ppt
 
US Department of Education FAFSA Week of Action
US Department of Education FAFSA Week of ActionUS Department of Education FAFSA Week of Action
US Department of Education FAFSA Week of Action
 
『澳洲文凭』买麦考瑞大学毕业证书成绩单办理澳洲Macquarie文凭学位证书
『澳洲文凭』买麦考瑞大学毕业证书成绩单办理澳洲Macquarie文凭学位证书『澳洲文凭』买麦考瑞大学毕业证书成绩单办理澳洲Macquarie文凭学位证书
『澳洲文凭』买麦考瑞大学毕业证书成绩单办理澳洲Macquarie文凭学位证书
 
Mine Environment II Lab_MI10448MI__________.pptx
Mine Environment II Lab_MI10448MI__________.pptxMine Environment II Lab_MI10448MI__________.pptx
Mine Environment II Lab_MI10448MI__________.pptx
 
Prach: A Feature-Rich Platform Empowering the Autism Community
Prach: A Feature-Rich Platform Empowering the Autism CommunityPrach: A Feature-Rich Platform Empowering the Autism Community
Prach: A Feature-Rich Platform Empowering the Autism Community
 
Earthing details of Electrical Substation
Earthing details of Electrical SubstationEarthing details of Electrical Substation
Earthing details of Electrical Substation
 

S curve1

  • 1. Hassan M. Ahmad AL-Kandari Project Mgmt. Specialist ( S&E ) KUWAIT OIL COMPANY (KOC) S-Curve analysis – Case Study Abstract Presentation of a case-study regarding the analysis of S-Curve of a life project draws a concrete projection of a powerful tool in project management in all aspects (planning and tracing and monitoring a project). The analysis covers “ construction phase “ at different stages and steps of the original planning and the revised planning including the turning points along the S-Curve progress path in meeting the project’s objectives and in adding new values to the scope. These turning points along the S-Curve path reflects the project management decision making as well as adding values to the scope in term of adjustment orders and to push the process further to the final destination “ move-in mobilization and handing over the project “ to the users. The core question, Is it possible to intervene in a way to push the on going process and bring the deviation back to the S-Curve path after fulfillment of the shortage in planning sources and time scheduling? Introduction S-Curve Analysis provides sound evaluation and depicts a clear picture of a project process and its development. Projects are considered living-system; this means the stages of process has a natural cycle with dynamically changing along the path of the project life cycle. That makes the project management’s potentiality high and challenging to meet all milestones objectives and the planned requirements successfully. Also, S-Curve provides a practical ground for PM decisions and actions. The frame-work of the S-Curve from the start-up (birth) and growth along the path development to the completion (maturation stage), then to have the decline stage, thus all projects experience constant changes during the life cycle process. The S-Curve is a Model for observing a project process through known phases (conceptual, design, contractual, construction, utilization and operation, modification and obsolescence for getting red-off and recycling finally) and to monitor stages of each phase.
  • 2. The interpolation of S-Curve analysis gives the indication, as reading the X-Ray of a patient, of historical development and the deviation from the established previously planned. These deviations draw the actual progress (see figure.5 ). S-Curve as tool presents resources relationships in term of different variables which are scaled as percentages (% costs) in relation to the time variable, this relationships draw the future path to meet the objectives and the final target goal, also S-Curve helps the communication management (reporting, meetings, coordination, directives, and the adjustments orders along the path) and the teams participations in decision making. Nature of the S-Curve The general appearance of an S-Curve is flatter at the beginning and end and steeper in the middle. The S-Curve is a logistic curve describes how the work’s progresses and changes diffuse through certain path. The S-Curve’s shape shows an initial period of slow change the accelerated and rapid change in the middle, and then followed by slowing down as the growth approached to the completion stage. Also, in construction phase the S-Curve illustrates the starting site mobilization and preparation of technical documentations, workshop drawings, getting approvals of parties beside on-going some activities such as earth work preparation and surveying works, etc. Where at the growth stage the exponential materialization of structures and the facilities and the support services of a project’s components takes place. Overall we can say that S-Curve gives a comprehensive picture of the project’s progress, and at the same time is a flexible framework to manage a project successfully and understand the causes and effects of all involved variables and the resources in relation to the time scale. Thus the S-Curve graphically traces and allows a quick and timely identification of the problems that might negatively affects the progress of a project through periodical reports and highlighting the actual against the planned activities and answers crucial questions: • Will the project be completed as scheduled? • What are the expected dates of completion of different activities as at present rate? • How many costs or the payments (invoices) are incurred on particular date? Background Case-study Project The following is the brief components of the projects under the study as an example to our case-study of S-Curve analysis:
  • 3. S-Curve – at the construction phase (Model): S-Curve as PM tool at the construction phase consists of cumulative costs, other quantitative variables (Activities Packages) plotted against time variable. The base for S-Curve is the work break down structure (WBS) which is breakdown of the work into systematic and logical components packages, these components are reflected through activities with dates, costs, and weighting percentage on the vertical axis. Figure- 1 Baseline S-Curve Model (see figure – 1): The above S-Curve in general shows cumulative costs expended over time for the duration of the project, and used to assist in calculation of the project’s cash flow. Prior to project commencement. A schedule is outlining the proposed allocation of resources and timing of tasks necessary to complete the project within a set of time- frame and budget. Thus the original schedule is referred to as baseline S-Curve. This S-Curve reflects the planned progress of a project. Actual S-Curves case-study, (Figure- 2, Figure-3, Figure-4) Time (in months) Start-up Stage Growth stage Commissioning TThhee PPrroojjeecctt ssiittee iiss llooccaatteedd iinn tthhee BBuurrggaann OOiill FFiieelldd bbeehhiinndd tthhee BBuurrggaann FFiirree SSttaattiioonn.. TThhee PPlloott aarreeaa iiss aapppprrooxxiimmaatteellyy 118800mm xx 220000 mm ==3366000000mm22
  • 4. The following planned S-Curves are updated on a regular basis (monthly) throughout the duration of the project. These updates include the revision of percentage completed for each task to-date. The planned and the revised planned S-Curves are generated which reflect by presenting on-going S-Curve as an actual progress of the project to-date, and is compared with baseline to determine How the project has been progressed. ORIGNAL S-CURVE 0.00% 10.00% 20.00% 30.00% 40.00% 50.00% 60.00% 70.00% 80.00% 90.00% 100.00% A pr-05 Jun-05 A ug-05 O ct-05 D ec-05 Feb-06 A pr-06 Jun-06 A ug-06 O ct-06 D ec-06 Feb-07 A pr-07 Jun-07 A ug-07 O ct-07 D ec-07 Cumulative Percentage (Early) up 09.09.2006 Cumulative Percentage (late) up 09.09.2006 Actual Figure- 2
  • 5. EXT.NO 2 S-CURVE 0.00% 10.00% 20.00% 30.00% 40.00% 50.00% 60.00% 70.00% 80.00% 90.00% 100.00% Apr-05 Jun-05 Aug-05 O ct-05 D ec-05 Feb-06 Apr-06 Jun-06 Aug-06 O ct-06 D ec-06 Feb-07 Apr-07 Jun-07 Aug-07 O ct-07 D ec-07 Cumulative Percentage (Early) up 09.09.2006 Cumulative Percentage (late) up 09.09.2006 Cumulative Percentage (Early) up 30.12.2006 Cumulative Percentage (late) up 30.12.2006 Cumulative Percentage (Early) up 28.06.2007 Cumulative Percentage (late) up 28.06.2007 Actual Figure-3 EXT. NO 3 S-CURVE 0.00% 10.00% 20.00% 30.00% 40.00% 50.00% 60.00% 70.00% 80.00% 90.00% 100.00% Apr-05Jun-05Aug-05Oct-05Dec-05Feb-06Apr-06Jun-06Aug-06Oct-06Dec-06Feb-07Apr-07Jun-07Aug-07Oct-07Dec-07 Cumulative Percentage (Early) up 09.09.2006 Cumulative Percentage (late) up 09.09.2006 Cumulative Percentage (Early) up 30.12.2006 Cumulative Percentage (late) up 30.12.2006 Cumulative Percentage (Early) up 28.06.2007 Cumulative Percentage (late) up 28.06.2007 Cumulative Percentage (Early) up 28.12.2007 Cumulative Percentage (late) up 28.12.2007 Actual Figure-4
  • 6. Analysis: The above S-Curves ‘s figures ( 2,3,4 ) illustrate the changes and the shortfalls in the construction process and highlight the project development and help us to understand a practical construction management to push forward the project path to the final commissioning stage, that means to bring the S-curve path to or near the model S- Curve figure-1. This study adds values to PM Knowledge as lesson learned and how to optimize solutions for typical projects in the future and reinforce the knowledge management system within the organization. It is clear that original S-Curve in figure (2,) is far behind the model S-Curve due to some causes which will be highlighted by this case-study. The Stat-up stage of the S- Curve shows very flat covers more than 60% of the original contract period. Next, the original growth S-Curve stage appears very high steeped, that don’t leave any space for commissioning stage at all. That’s dictated to modify the process and introduce a turning point by adding an adjustment order in term of scope (additional offices area) and 3month time extension to smooth the work process, as shown in figure (3), where is the turning point along the work progress directs to the next step towards modifying a situation by proposing a second adjustment order with time extension of 6month more to the contract duration. By the second adjustment order the S-Curve Growth Stage shaped to have some characteristic of the S-Curve Model, but it’s clear that still it needs more span to come to a turning point for the next completion stage (commissioning stage). Even though the 2nd adjustment order gave some breath to coach-up an increase in the level of performance, but still this growth behind the picture of the S-Curve Model, which forced the PM team to fight for an additional 3rd adjustment order of 6 months in term of time, to uplift the growth part of the S-Curve’s work process further in a steeped way to meet the commissioning stage and bring the project to its final completion “handing –over moment”. Analysis and findings: In the following S-Curve (figure-5) represents the summary of the actual S-Curve for the whole construction stage duration (original contractual duration and the additional time variation durations).
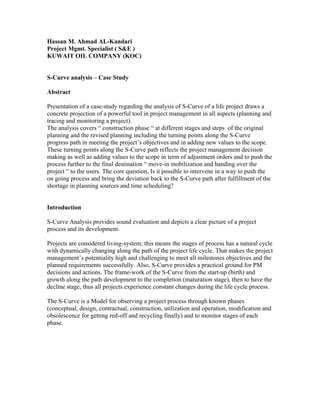
  • 7. EXT. NO 3 S-CURVE 0.00% 10.00% 20.00% 30.00% 40.00% 50.00% 60.00% 70.00% 80.00% 90.00% 100.00% Mar-05 May-05 Jul-05 Sep-05 Nov-05 Jan-06 Mar-06 May-06 Jul-06 Sep-06 Nov-06 Jan-07 Mar-07 May-07 Jul-07 Sep-07 Nov-07 Cumulative Percentage (late) up 28.12.2007 Actual Figure-5 This figure-5, the actual S-curve has been projected as accumulated data from the monthly progress report. Also, the report depicts the following brief of the major events as progress status of this case-study’s project. • Commencement date: 19 March 2006. • Contractual Completion Date: 9 Sep. 2006, with 60% actual progress. • 1st Revised completion date is Dec. 2006, with 70% actual progress (Time extension 3 months). • 2nd Revision completion date: 28Jun. 2007, with 80% actual progress (Time extension 6 months). • 3rd Revision completion date: 28Dec.2007, with 100% planned progress ( Time extension 6 months ). Findings in term of time-frame based on the above projected actual S-Curve and the status reports: To answer this question we introduce the following interpolation tabulation of time duration parentages needed to complete the project and to bring the shape of the actual S- Curve to the natural model S-Curve, which represents the logical progress of a project. Thus, the analyzed actual S-Curve duration after variations is …………… The following table is construction’s time interpolation after the variations in time extension to bring the actual S-Curve to the Model S-Curve shape:
  • 8. Interpolation Table Conclusion: S-Curve pictures clear situations at all level and shapes the performance path of a project graphically, which precisely examine the input variables and the results qualitatively and quantitatively. Based on the S-Curve analysis we can answer the question stipulated at the beginning, that we can manage the S-Curve rectification and smoothing the performance process during any project’s phase considering the following: • Project’s Failure in some aspects is inevitable, but bringing the outcomes to the successful end is the challenging corner-stone in any project. • Risk and failure are viewed as lessons learned for future, thus the variation is a hallmark of creative practice in any project when it adds values, and when it enriches PM practice with exiting new ideas. • By reading the S-Curve carefully and monitoring turning points along the path, we can mange to push the project forwards. • By smoothing S-Curve through coordination and supporting activities of team’s participation in meeting the time schedules. • By flagging the problems and the vital issues by all participants and concerned groups at the right time. • Besides maintaining the contractual and quality obligations, we can enhance flexibility of work conditions by new approaches and alternatives to strengthen better solutions. • Adapting creative approach in managing the whole process such as walking- management, and walking meeting progress on the spot, besides the traditional progress meeting to insure the interaction among the participants, and turning the r knowledge into action. References: 1. Logistic function / of logistic curve from Wikipedia, Fee encyclopedia www. Wikipedia . Org / logistic-curve. 2. New tools for project managers: Evolution of s-curve and earned value formation Denis F. Cioffi, ph. D – A presentation Conference on PM at 3rd Caribbean & Latin May 2003.
  • 9. 3. Human Resources Development in Knowledge- based Economy. THE Emirates Center for Strategic Studies and Research- 2003. Abu Dabi, United Arab Emirates.