Lesson 11: Understanding the Income Statement

Watch this with a 10-15 minute audiotrack at http://vimeo.com/novusprogram/lesson11 This lesson introduces the Income Statement (aka Profit & Loss Statement.) Understanding this common financial statement is essential to understanding how business works. The lesson covers the basic structure of the report, and introduces the key elements of the income statement. The Novus project is a combination of video tutorials designed to be used in conjunction with a free business simulation software program. The Novus Business and IT Program contains 36 business and IT training videos, covering basic finance, accounting, marketing, economics, business strategy, Word, Excel, and PowerPoint. Users will have an opportunity to apply the lessons in the Novus Business Simulator. Over six rounds, the user or teams will have to make decisions on capital purchases, financing, production, financing, and human resources for a microbrewery. This channel has arranged the 36 video lessons into the order in which they are meant to be used with the simulator. To watch this slideshow as a video, please go to our Vimeo page at: https://vimeo.com/novusprogram. To download our free business simulation software, please go to our SourceForge page at: http://sourceforge.net/projects/novus/.

Recomendados
Más contenido relacionado
Destacado
Destacado (11)
Más de Novus Business and IT Training Program
Más de Novus Business and IT Training Program (18)
Último
Último (20)
Lesson 11: Understanding the Income Statement
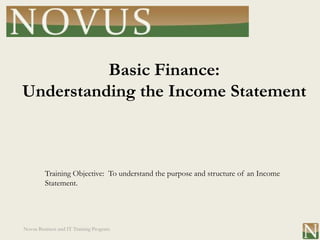
- 1. Basic Finance: Understanding the Income Statement Training Objective: To understand the purpose and structure of an Income Statement. Novus Business and IT Training Program
- 2. Income Statement • Also known as the Profit and Loss Statement • Shows the results of a business over a set period of time, usually one quarter (3 months) or one year. Novus Business and IT Training Program 1
- 3. Net Income Net Income = Sales – Expenses Or, said another way, Net Income = Money Coming In – Money going out Novus Business and IT Training Program 2
- 4. Income Statement: Sales Star Hat Store Income Statement Year Ending Year Ending 31-Dec-2011 31-Dec-2010 Sales 100,000 80,000 20% increase Cost of Goods Sold - 65,000 55,000 from 2010 to 2011 Gross Income = 35,000 25,000 Selling General and Administrative Expenses - 15,000 15,000 Operating Income = 20,000 10,000 Other Income and Expenses - 8,000 8,000 Pre-Tax Income = 12,000 2,000 Taxes - 2,400 400 Net Income = 9,600 1,600 3
- 5. Income Statement: Cost of Goods Sold Star Hat Store Income Statement Year Ending Year Ending 31-Dec-2011 31-Dec-2010 Sales 100,000 80,000 Cost of Goods Sold - 65,000 55,000 Gross Income = 35,000 25,000 Selling General and Administrative Expenses - 15,000 15,000 Operating Income = 20,000 10,000 Other Income and Expenses - 8,000 8,000 Pre-Tax Income = 12,000 2,000 Taxes - 2,400 400 Net Income = 9,600 1,600 4
- 6. Income Statement: Gross Income Star Hat Store Income Statement Year Ending Year Ending 31-Dec-2011 31-Dec-2010 Sales 100,000 80,000 Cost of Goods Sold - 65,000 55,000 Gross Income = 35,000 25,000 Selling General and Administrative Expenses - 15,000 15,000 Operating Income = 20,000 10,000 Other Income and Expenses - 8,000 8,000 Pre-Tax Income = 12,000 2,000 Taxes - 2,400 400 Net Income = 9,600 1,600 5
- 7. Income Statement: Gross Margin Star Hat Store Income Statement Year Ending Year Ending 31-Dec-2011 31-Dec-2010 2011 Gross Margin Sales 100,000 80,000 35,000 Cost of Goods Sold - 65,000 55,000 ------------ = 35% 100,000 Gross Income = 35,000 25,000 Selling General and Administrative Expenses - 15,000 15,000 2010 Gross Margin Operating Income = 20,000 10,000 Other Income and Expenses - 8,000 8,000 25,000 ------------ = 31% Pre-Tax Income = 12,000 2,000 80,000 Taxes - 2,400 400 Net Income = 9,600 1,600 6
- 8. Income Statement: SG&A Star Hat Store Income Statement Year Ending Year Ending 31-Dec-2011 31-Dec-2010 Sales 100,000 80,000 Cost of Goods Sold - 65,000 55,000 Gross Income = 35,000 25,000 Selling General and Administrative Expenses - 15,000 15,000 Operating Income = 20,000 10,000 Other Income and Expenses - 8,000 8,000 Pre-Tax Income = 12,000 2,000 Taxes - 2,400 400 Net Income = 9,600 1,600 7
- 9. Income Statement: Operating Income Star Hat Store Income Statement Year Ending Year Ending 31-Dec-2011 31-Dec-2010 Sales 100,000 80,000 Cost of Goods Sold - 65,000 55,000 Gross Income = 35,000 25,000 Selling General and Administrative Expenses - 15,000 15,000 Operating Income = 20,000 10,000 Other Income and Expenses - 8,000 8,000 Pre-Tax Income = 12,000 2,000 Taxes - 2,400 400 Net Income = 9,600 1,600 8
- 10. Income Statement: Other Income and Expenses Star Hat Store Income Statement Year Ending Year Ending 31-Dec-2011 31-Dec-2010 Sales 100,000 80,000 Cost of Goods Sold - 65,000 55,000 Gross Income = 35,000 25,000 Selling General and Administrative Expenses - 15,000 15,000 Operating Income = 20,000 10,000 Other Income and Expenses - 8,000 8,000 Pre-Tax Income = 12,000 2,000 Taxes - 2,400 400 Net Income = 9,600 1,600 9
- 11. Income Statement: Pre-Tax Income Star Hat Store Income Statement Year Ending Year Ending 31-Dec-2011 31-Dec-2010 Sales 100,000 80,000 Cost of Goods Sold - 65,000 55,000 Gross Income = 35,000 25,000 Selling General and Administrative Expenses - 15,000 15,000 Operating Income = 20,000 10,000 Other Income and Expenses - 8,000 8,000 Pre-Tax Income = 12,000 2,000 Taxes - 2,400 400 Net Income = 9,600 1,600 10
- 12. Income Statement: Taxes Star Hat Store Income Statement Year Ending Year Ending 31-Dec-2011 31-Dec-2010 Sales 100,000 80,000 Cost of Goods Sold - 65,000 55,000 Gross Income = 35,000 25,000 Selling General and Administrative Expenses - 15,000 15,000 Operating Income = 20,000 10,000 Other Income and Expenses - 8,000 8,000 Pre-Tax Income = 12,000 2,000 Taxes - 2,400 400 Net Income = 9,600 1,600 11
- 13. Income Statement: Net Income Star Hat Store Income Statement Year Ending Year Ending 31-Dec-2011 31-Dec-2010 Sales 100,000 80,000 Cost of Goods Sold - 65,000 55,000 Gross Income = 35,000 25,000 Selling General and Administrative Expenses - 15,000 15,000 Operating Income = 20,000 10,000 Other Income and Expenses - 8,000 8,000 Pre-Tax Income = 12,000 2,000 Taxes - 2,400 400 Net Income = 9,600 1,600 12