Beginners Guide to TikTok for Search - Rachel Pearson - We are Tilt __ Bright...
Ok state 11 page average december 2013
1. December 2013
Area Delimited by Entire OK State MLS Single-Family Property Type
DECEMBER
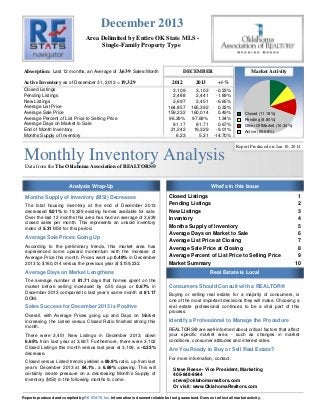
Absorption: Last 12 months, an Average of 3,639 Sales/Month
Active Inventory as of December 31, 2013 = 19,329
Closed Listings
Pending Listings
New Listings
Average List Price
Average Sale Price
Average Percent of List Price to Selling Price
Average Days on Market to Sale
End of Month Inventory
Months Supply of Inventory
Market Activity
2012
2013
+/-%
3,109
2,488
3,697
164,857
159,232
96.39%
81.17
21,242
6.23
3,102
2,441
3,451
165,392
160,014
97.69%
81.71
19,329
5.31
-0.23%
-1.89%
-6.65%
0.32%
0.49%
1.34%
0.67%
-9.01%
-14.70%
Monthly Inventory Analysis
Closed (11.18%)
Pending (8.80%)
Other OffMarket (10.34%)
Active (69.68%)
Report Produced on: Jan 10, 2014
Data from the The Oklahoma Association of REALTORS®
Analysis Wrap-Up
Months Supply of Inventory (MSI) Decreases
The total housing inventory at the end of December 2013
decreased 9.01% to 19,329 existing homes available for sale.
Over the last 12 months this area has had an average of 3,639
closed sales per month. This represents an unsold inventory
index of 5.31 MSI for this period.
Average Sale Prices Going Up
According to the preliminary trends, this market area has
experienced some upward momentum with the increase of
Average Price this month. Prices went up 0.49% in December
2013 to $160,014 versus the previous year at $159,232.
Average Days on Market Lengthens
The average number of 81.71 days that homes spent on the
market before selling increased by 0.55 days or 0.67% in
December 2013 compared to last year’s same month at 81.17
DOM.
Sales Success for December 2013 is Positive
Overall, with Average Prices going up and Days on Market
increasing, the Listed versus Closed Ratio finished strong this
month.
There were 3,451 New Listings in December 2013, down
6.65% from last year at 3,697. Furthermore, there were 3,102
Closed Listings this month versus last year at 3,109, a -0.23%
decrease.
Closed versus Listed trends yielded a 89.9% ratio, up from last
year’s December 2013 at 84.1%, a 6.89% upswing. This will
certainly create pressure on a decreasing Month’s Supply of
Inventory (MSI) in the following months to come.
What's in this Issue
Closed Listings
Pending Listings
New Listings
Inventory
Months Supply of Inventory
Average Days on Market to Sale
Average List Price at Closing
Average Sale Price at Closing
Average Percent of List Price to Selling Price
Market Summary
1
2
3
4
5
6
7
8
9
10
Real Estate is Local
Consumers Should Consult with a REALTOR®
Buying or selling real estate, for a majority of consumers, is
one of the most important decisions they will make. Choosing a
real estate professional continues to be a vital part of this
process.
Identify a Professional to Manage the Procedure
REALTORS® are well-informed about critical factors that affect
your specific market area - such as changes in market
conditions, consumer attitudes and interest rates.
Are You Ready to Buy or Sell Real Estate?
For more information, contact:
Steve Reese - Vice President, Marketing
405-848-9944
steve@oklahomarealtors.com
Or visit: www.OklahomaRealtors.com
Reports produced and compiled by RE STATS Inc. Information is deemed reliable but not guaranteed. Does not reflect all market activity.
2. Monthly Inventory Analysis
Data from the The Oklahoma Association of
REALTORS®
December 2013
Closed Sales as of Jan 10, 2014
Closed Listings
Report Produced on: Jan 10, 2014
Area Delimited by Entire OK State MLS - Single-Family Property Type
DECEMBER
2009
2010
2011
YEAR TO DATE (YTD)
2012
2013
3,109
3,102
2,879
2,632
2009
38,198
2,552
2010
2011
2012
2013
43,672
40,941
34,633
35,322
1 Year
-0.23%
2 Year
+7.75%
1 Year
+6.67%
2 Year
+23.64%
5 YEAR MARKET ACTIVITY TRENDS
5yr DEC AVG = 2,855
High
Jul 2013 = 4,625
Low
Jan 2010 = 1,719
5,000
4,000
3,000
3 MONTHS
O 3,573
C
T
Closed Listings
N 3,105
O
V -13.10%
Closed Listings
this
month at 3,102,
above the 5 yr DEC D 3,102
E
average of 2,855
C -0.10%
2,000
1,000
0
Jun 2009Dec 2009Jun 2010Dec 2010Jun 2011Dec 2011Jun 2012Dec 2012Jun 2013
CLOSED LISTINGS & BEDROOMS DISTRIBUTION BY PRICE
Distribution of Closed Listings by Price Range
%
AVDOM
2 Beds
3 Beds
4 Beds
5 Beds+
116
3.74%
79.6
64
43
8
1
$25,001
$75,000
525
16.92%
80.5
174
304
43
4
$75,001
$100,000
Ready to Buy or Sell Real Estate?
Contact an experienced REALTOR
$25,000
and less
335
10.80%
79.6
78
225
29
3
$100,001
$150,000
819
26.40%
78.1
137
573
100
9
$150,001
$200,000
556
17.92%
86.6
71
311
161
13
$200,001
$275,000
393
12.67%
84.8
42
145
184
22
$275,001
and up
358
11.54%
83.5
27
85
194
52
Total Closed Units:
Total Closed Volume:
Average Closed Price:
3,102
496,363,340
$160,014
81.7
593
1686
719
104
66.70M 231.39M 164.51M
33.76M
$112,486 $137,241 $228,801 $324,637
Reports produced and compiled by RE STATS Inc. Information is deemed reliable but not guaranteed. Does not reflect all market activity.
Steve Reese
405-848-9944
steve@oklahomarealtors.com
pp. 1
3. Monthly Inventory Analysis
Data from the The Oklahoma Association of
REALTORS®
December 2013
Pending Listings as of Jan 10, 2014
Pending Listings
Report Produced on: Jan 10, 2014
Area Delimited by Entire OK State MLS - Single-Family Property Type
DECEMBER
2009
2,050
2011
2012
2013
2,488
2,022
2010
YEAR TO DATE (YTD)
2,441
2,212
2009
38,186
2010
2011
2012
2013
44,414
41,408
34,384
35,641
1 Year
-1.89%
2 Year
+10.35%
1 Year
+7.26%
2 Year
+24.61%
5 YEAR MARKET ACTIVITY TRENDS
5yr DEC AVG = 2,243
High
Apr 2010 = 4,937
Low
Dec 2009 = 2,022
5,000
4,000
3,000
3 MONTHS
O 3,534
C
T
Pending Listings
N 3,021
O
V -14.52%
Pending Listings
this
month at 2,441,
above the 5 yr DEC D 2,441
E
average of 2,243
C -19.20%
2,000
1,000
0
Jun 2009Dec 2009Jun 2010Dec 2010Jun 2011Dec 2011Jun 2012Dec 2012Jun 2013
PENDING LISTINGS & BEDROOMS DISTRIBUTION BY PRICE
Distribution of Pending Listings by Price Range
%
AVDOM
2 Beds
3 Beds
4 Beds
5 Beds+
110
4.51%
73.0
57
47
6
0
$25,001
$50,000
244
10.00%
65.4
84
141
15
4
$50,001
$100,000
Ready to Buy or Sell Real Estate?
Contact an experienced REALTOR
$25,000
and less
527
21.59%
81.4
120
355
50
2
$100,001
$150,000
577
23.64%
79.5
85
403
86
3
$150,001
$200,000
416
17.04%
83.6
60
229
111
16
$200,001
$275,000
302
12.37%
79.3
34
126
133
9
$275,001
and up
265
10.86%
93.6
18
58
147
42
Total Pending Units:
Total Pending Volume:
Average Listing Price:
2,441
389,245,301
$158,467
93.6
458
1359
548
76
49.24M 177.81M 128.73M
33.46M
$107,515 $130,838 $234,911 $440,308
Reports produced and compiled by RE STATS Inc. Information is deemed reliable but not guaranteed. Does not reflect all market activity.
Steve Reese
405-848-9944
steve@oklahomarealtors.com
pp. 2
4. Monthly Inventory Analysis
Data from the The Oklahoma Association of
REALTORS®
December 2013
New Listings as of Jan 10, 2014
New Listings
Report Produced on: Jan 10, 2014
Area Delimited by Entire OK State MLS - Single-Family Property Type
DECEMBER
2009
2010
YEAR TO DATE (YTD)
2011
2012
2013
2009
2010
2011
68,609
2012
67,832
70,336
4,254
3,888
3,742
3,697
3,451
2013
71,262
65,140
1 Year
-6.65%
2 Year
-7.78%
1 Year
+1.32%
2 Year
+5.06%
5 YEAR MARKET ACTIVITY TRENDS
5yr DEC AVG = 3,806
High
Apr 2010 = 7,793
Low
Dec 2013 = 3,451
8,000
7,000
6,000
5,000
New Listings
4,000
3,000
2,000
1,000
0
Jun 2009Dec 2009Jun 2010Dec 2010Jun 2011Dec 2011Jun 2012Dec 2012Jun 2013
3 MONTHS
O 5,744
C
T
N 4,400
O
V -23.40%
New Listings this
month at 3,451,
below the 5 yr DEC D 3,451
E
average of 3,806
C -21.57%
NEW LISTINGS & BEDROOMS DISTRIBUTION BY PRICE
Distribution of New Listings by Price Range
%
2 Beds
3 Beds
4 Beds
5 Beds+
111
3.22%
47
57
6
1
$25,001
$75,000
676
19.59%
247
376
47
6
$75,001
$100,000
Ready to Buy or Sell Real Estate?
Contact an experienced REALTOR
$25,000
and less
403
11.68%
97
265
37
4
$100,001
$150,000
769
22.28%
107
551
99
12
$150,001
$225,000
706
20.46%
85
414
190
17
$225,001
$325,000
422
12.23%
50
139
208
25
$325,001
and up
364
10.55%
31
75
187
71
Total New Listed Units:
Total New Listed Volume:
Average New Listed Listing Price:
3,451
621,591,908
$159,692
664
1877
774
136
81.67M 265.47M 210.44M
64.00M
$122,999 $141,435 $271,890 $470,615
Reports produced and compiled by RE STATS Inc. Information is deemed reliable but not guaranteed. Does not reflect all market activity.
Steve Reese
405-848-9944
steve@oklahomarealtors.com
pp. 3
5. Monthly Inventory Analysis
Data from the The Oklahoma Association of
REALTORS®
December 2013
Active Inventory as of Jan 10, 2014
Active Inventory
Report Produced on: Jan 10, 2014
Area Delimited by Entire OK State MLS - Single-Family Property Type
END OF DECEMBER
2009
2010
2011
24,049
23,100
19,797
ACTIVE DURING DECEMBER
2012
2009
19,329
2010
2011
29,169
21,230
2013
2012
2013
28,354
26,260
24,422
24,636
1 Year
-8.95%
2 Year
-16.32%
1 Year
-6.18%
2 Year
-13.11%
5 YEAR MARKET ACTIVITY TRENDS
5yr DEC AVG = 21,501
Active Inventory
High
Jul 2011 = 26,762
Low
Dec 2013 = 19,329
30,000
20,000
3 MONTHS
O 22,371
C
T
N 21,189
O
V -5.28%
Inventory this
month at 19,329,
below the 5 yr DEC D 19,329
E
average of 21,501 C -8.78%
10,000
0
Jun 2009Dec 2009
Jun 2010Dec 2010
Jun 2011Dec 2011
Jun 2012Dec 2012
Jun 2013
INVENTORY & BEDROOMS DISTRIBUTION BY PRICE
Distribution of Inventory by Price Range
%
AVDOM
2 Beds
3 Beds
4 Beds
5 Beds+
1,998
10.34%
127.7
1,017
858
110
13
$50,001
$75,000
2,078
10.75%
136.7
817
1,106
138
17
$75,001
$100,000
Ready to Buy or Sell Real Estate?
Contact an experienced REALTOR
$50,000
and less
2,312
11.96%
125.6
646
1,429
212
25
$100,001
$175,000
5,524
28.58%
116.9
977
3,544
922
81
$175,001
$225,000
2,385
12.34%
118.0
375
1,219
732
59
$225,001
$350,000
2,901
15.01%
127.1
404
1,011
1,278
208
$350,001
and up
2,131
11.02%
136.7
229
449
1,000
453
Total Active Inventory by Units:
Total Active Inventory by Volume:
Average Active Inventory Listing Price:
19,329
3,844,830,405
$198,915
125.0
4,465
9,616
4,392
856
615.83M
1.50B
1.28B 451.04M
$137,924 $156,234 $290,441 $526,918
Reports produced and compiled by RE STATS Inc. Information is deemed reliable but not guaranteed. Does not reflect all market activity.
Steve Reese
405-848-9944
steve@oklahomarealtors.com
pp. 4
6. Monthly Inventory Analysis
Data from the The Oklahoma Association of
REALTORS®
December 2013
Active Inventory as of Jan 10, 2014
Months Supply of Inventory
Report Produced on: Jan 10, 2014
Area Delimited by Entire OK State MLS - Single-Family Property Type
MSI FOR DECEMBER
2009
2010
2011
8.3
INDICATORS FOR DECEMBER 2013
2012
Inventory
2013
7.8
Absorption
MSI
MSI %
5.3
18.828%
Months
Supply
of
Inventory
Percent
Months
Supply of
Inventory
43,672
6.2
6.2
Closed
5.3
19,329
1 Year
-14.65%
2 Year
-32.32%
End of
Month
Active
Inventory
Closed
Last
12
Months
5 YEAR MARKET ACTIVITY TRENDS
3,639
Average
Closed per
Month over
12 Months
5yr DEC AVG = 6.8
High
Jun 2011 = 9.7
Low
Dec 2013 = 5.3
Months Supply
10
9
8
7
6
5
4
3
2
1
0
3 MONTHS
O 6.1
C
T
N 5.8
O
V -5.19%
Months Supply this
month at 5.3,
below the 5 yr DEC D 5.3
E
average of 6.8
C -8.76%
Jun 2009 Dec 2009Jun 2010 Dec 2010Jun 2011 Dec 2011Jun 2012 Dec 2012Jun 2013
MONTHS SUPPLY & BEDROOMS DISTRIBUTION BY PRICE
Distribution of Active Inventory by Price Range and MSI
%
MSI
2 Beds
3 Beds
4 Beds
5 Beds+
1,998
10.34%
4.7
5.5
4.2
4.2
3.7
$50,001
$70,000
1,656
8.57%
6.7
8.6
5.8
6.1
5.0
$70,001
$110,000
Ready to Buy or Sell Real Estate?
Contact an experienced REALTOR
$50,000
and less
3,345
17.31%
5.5
6.6
5.0
5.8
8.2
$110,001
$170,000
4,550
23.54%
4.2
4.5
4.0
4.4
7.8
$170,001
$240,000
3,271
16.92%
4.9
5.7
4.9
4.5
5.3
$240,001
$370,000
2,566
13.28%
6.2
8.1
6.5
5.5
7.4
$370,001
and up
1,943
10.05%
10.8
15.4
11.6
9.3
12.5
6.1
4,465
4.8
9,616
5.4
4,392
8.7
856
MSI:
Total Active Inventory:
5.3
19,329
Reports produced and compiled by RE STATS Inc. Information is deemed reliable but not guaranteed. Does not reflect all market activity.
Steve Reese
405-848-9944
steve@oklahomarealtors.com
pp. 5
7. Monthly Inventory Analysis
Data from the The Oklahoma Association of
REALTORS®
December 2013
Closed Sales as of Jan 10, 2014
Average Days on Market to Sale
Report Produced on: Jan 10, 2014
Area Delimited by Entire OK State MLS - Single-Family Property Type
DECEMBER
2009
2010
2011
91
YEAR TO DATE (YTD)
2012
91
2009
2010
82
2011
2012
81
2013
89
81
80
2013
82
82
76
1 Year
+0.67%
2 Year
-9.89%
1 Year
-7.79%
2 Year
-14.39%
5 YEAR MARKET ACTIVITY TRENDS
5yr DEC AVG = 85
Average Days on Market
High
Mar 2011 = 98
Low
Jul 2013 = 69
100
90
80
70
60
50
40
30
20
10
0
3 MONTHS
O 77
C
T
N 78
O
V 1.97%
Average DOM this
month at 82,
below the 5 yr DEC D 82
E
average of 85
C 4.24%
Jun 2009 Dec 2009Jun 2010 Dec 2010Jun 2011 Dec 2011Jun 2012 Dec 2012Jun 2013
AVERAGE DOM OF CLOSED SALES & BEDROOMS DISTRIBUTION BY PRICE
Distribution of Average Days on Market to Sale by Price Range %
AVDOM
2 Beds
3 Beds
4 Beds
5 Beds+
Ready to Buy or Sell Real Estate?
Contact an experienced REALTOR
$25,000
and less
116
3.74%
79.6
89.4
63.1
89.4
84.0
$25,001
$75,000
525
16.92%
80.5
80.1
80.6
85.9
34.3
$75,001
$100,000
335
10.80%
79.6
86.1
77.7
70.1
146.7
$100,001
$150,000
819
26.40%
78.1
83.8
77.9
72.7
67.8
$150,001
$200,000
556
17.92%
86.6
121.1
83.7
77.9
74.3
$200,001
$275,000
393
12.67%
84.8
114.3
72.1
85.2
108.0
$275,001
and up
358
11.54%
83.5
99.3
69.1
86.1
89.3
Average Closed DOM:
Total Closed Units:
Total Closed Volume:
81.7
3,102
496,363,340
90.9
593
66.70M
78.1
1686
231.39M
81.5
719
164.51M
Reports produced and compiled by RE STATS Inc. Information is deemed reliable but not guaranteed. Does not reflect all market activity.
Steve Reese
405-848-9944
steve@oklahomarealtors.com
89.0
104
33.76M
pp. 6
8. Monthly Inventory Analysis
Data from the The Oklahoma Association of
REALTORS®
December 2013
Closed Sales as of Jan 10, 2014
Average List Price at Closing
Report Produced on: Jan 10, 2014
Area Delimited by Entire OK State MLS - Single-Family Property Type
DECEMBER
2009
2010
2011
160,549
148,081
YEAR TO DATE (YTD)
2012
2013
164,857
165,392
155,096
2009
149,205
2010
2011
152,835
155,169
2012
2013
168,414
161,055
1 Year
+0.32%
2 Year
+6.64%
1 Year
+4.57%
2 Year
+8.54%
5 YEAR MARKET ACTIVITY TRENDS
5yr DEC AVG = 159K
Average List Price
High
Jul 2013 = 176,558
Low
Jan 2010 = 139,073
200,000
3 MONTHS
O 161,193
C
T
N 169,971
O
Average LPrice this V 5.45%
month at 165,392,
above the 5 yr DEC D 165,392
E
average of 158,795 C -2.69%
100,000
0
Jun 2009Dec 2009
Jun 2010Dec 2010
Jun 2011Dec 2011
Jun 2012Dec 2012
Jun 2013
AVERAGE LIST PRICE OF CLOSED SALES & BEDROOMS DISTRIBUTION BY PRICE
Distribution of Average List Price at Closing by Price Range
%
AVL$
2 Beds
3 Beds
4 Beds
5 Beds+
111
3.58%
16,805
18,579
20,330
19,063
9,500
$25,001
$75,000
486
15.67%
53,499
51,936
59,726
53,877
56,125
$75,001
$100,000
Ready to Buy or Sell Real Estate?
Contact an experienced REALTOR
$25,000
and less
344
11.09%
89,332
90,686
92,292
91,766
96,633
$100,001
$150,000
791
25.50% 128,322
132,052 130,520 134,773 130,199
$150,001
$200,000
591
19.05% 175,512
185,911 177,787 181,282 178,215
$200,001
$275,000
394
12.70% 235,338
238,411 235,256 243,235 255,619
$275,001
and up
385
12.41% 406,484
415,035 417,385 393,722 484,661
Average List Price:
Total Closed Units:
Total List Volume:
$165,392
3,102
513,045,492
$117,723 $142,032 $234,953 $334,986
593
1686
719
104
69.81M 239.47M 168.93M
34.84M
Reports produced and compiled by RE STATS Inc. Information is deemed reliable but not guaranteed. Does not reflect all market activity.
Steve Reese
405-848-9944
steve@oklahomarealtors.com
pp. 7
9. Monthly Inventory Analysis
Data from the The Oklahoma Association of
REALTORS®
December 2013
Closed Sales as of Jan 10, 2014
Average Sold Price at Closing
Report Produced on: Jan 10, 2014
Area Delimited by Entire OK State MLS - Single-Family Property Type
DECEMBER
2009
2010
2011
153,425
142,617
YEAR TO DATE (YTD)
2012
2013
159,232
160,014
149,094
2009
143,995
2010
2011
147,133
149,037
2012
2013
163,006
155,414
1 Year
+0.49%
2 Year
+7.32%
1 Year
+4.89%
2 Year
+9.37%
5 YEAR MARKET ACTIVITY TRENDS
5yr DEC AVG = 153K
Average Sold Price
High
Jul 2013 = 171,516
Low
Jan 2010 = 133,432
200,000
3 MONTHS
O 155,742
C
T
N 164,033
O
Average SPrice this V 5.32%
month at 160,014,
above the 5 yr DEC D 160,014
E
average of 152,876 C -2.45%
100,000
0
Jun 2009Dec 2009
Jun 2010Dec 2010
Jun 2011Dec 2011
Jun 2012Dec 2012
Jun 2013
AVERAGE SOLD PRICE OF CLOSED SALES & BEDROOMS DISTRIBUTION BY PRICE
Distribution of Average Sold Price at Closing by Price Range
%
AVS$
2 Beds
3 Beds
4 Beds
5 Beds+
116
3.74%
16,276
15,598
17,551
15,697
9,500
$25,001
$75,000
525
16.92%
52,131
48,387
54,563
49,848
54,683
$75,001
$100,000
Ready to Buy or Sell Real Estate?
Contact an experienced REALTOR
$25,000
and less
335
10.80%
88,478
87,741
88,555
89,845
88,667
$100,001
$150,000
819
26.40% 127,233
128,180 126,514 130,117 126,533
$150,001
$200,000
556
17.92% 175,467
176,010 174,497 177,296 173,069
$200,001
$275,000
393
12.67% 234,620
233,500 230,096 237,142 245,486
$275,001
and up
358
11.54% 400,830
391,801 399,965 383,726 470,743
Average Closed Price:
Total Closed Units:
Total Closed Volume:
$160,014
3,102
496,363,340
$112,486 $137,241 $228,801 $324,637
593
1686
719
104
66.70M 231.39M 164.51M
33.76M
Reports produced and compiled by RE STATS Inc. Information is deemed reliable but not guaranteed. Does not reflect all market activity.
Steve Reese
405-848-9944
steve@oklahomarealtors.com
pp. 8
10. Monthly Inventory Analysis
Data from the The Oklahoma Association of
REALTORS®
December 2013
Closed Sales as of Jan 10, 2014
Average Percent of List Price to Selling Price
Report Produced on: Jan 10, 2014
Area Delimited by Entire OK State MLS - Single-Family Property Type
DECEMBER
2009
2010
2011
YEAR TO DATE (YTD)
2012
2013
97.69%
96.05%
95.36%
95.73%
96.39%
2009
2010
2011
2012
2013
96.66%
96.43%
96.06%
96.29%
95.77%
1 Year
+1.34%
2 Year
+2.04%
1 Year
+0.38%
2 Year
+0.94%
5 YEAR MARKET ACTIVITY TRENDS
5yr DEC AVG=96.24%
Average List/Sell Price
High
Dec 2013 = 97.69%
Low
Jan 2011 = 95.22%
98
97
3 MONTHS
O 96.16%
C
T
N 96.23%
O
Average List/Sell this V 0.07%
month at 97.69%,
above the 5 yr DEC D 97.69%
E
average of 96.24% C 1.51%
96
95
Jun 2009 Dec 2009Jun 2010 Dec 2010Jun 2011 Dec 2011Jun 2012 Dec 2012Jun 2013
AVERAGE L/S% OF CLOSED SALES & BEDROOMS DISTRIBUTION BY PRICE
Distribution of $avgmed L/S % by Price Range
%
AVL/S%
2 Beds
3 Beds
4 Beds
5 Beds+
116
3.74% 90.56% 91.51% 90.71% 80.99%100.00%
$25,001
$75,000
525
16.92% 99.77% 95.76%102.54% 96.54% 97.91%
$75,001
$100,000
Ready to Buy or Sell Real Estate?
Contact an experienced REALTOR
$25,000
and less
335
10.80% 96.67% 96.96% 96.33% 99.10% 91.72%
$100,001
$150,000
819
26.40% 97.02% 97.19% 97.03% 96.66% 97.27%
$150,001
$200,000
556
17.92% 97.81% 95.79% 98.26% 97.87% 97.27%
$200,001
$275,000
393
12.67% 97.71% 98.10% 97.96% 97.61% 96.26%
$275,001
and up
358
11.54% 99.20% 95.66% 96.97% 97.99%109.23%
Average List/Sell Ratio:
Total Closed Units:
Total Closed Volume:
97.70%
3,102
496,363,340
95.95%
593
66.70M
98.07%
1686
231.39M
97.45%
719
164.51M
Reports produced and compiled by RE STATS Inc. Information is deemed reliable but not guaranteed. Does not reflect all market activity.
Steve Reese
405-848-9944
steve@oklahomarealtors.com
102.93%
104
33.76M
pp. 9
11. Monthly Inventory Analysis
Data from the The Oklahoma Association of
REALTORS®
December 2013
Inventory as of Jan 10, 2014
Market Summary
Report Produced on: Jan 10, 2014
Area Delimited by Entire OK State MLS - Single-Family Property Type
Inventory
Inventory
Market Activity
New Listings
3,451 = 14.01%
Closed Sales
3,102 = 11.18%
Start Inventory
21,189
Pending Sales
2,441 = 8.80%
Total Inventory
Units
24,640
Volume
$4,822,779,849
Other Off Market
2,869 = 10.34%
Active Inventory
19,329 = 69.68%
DECEMBER
Absorption: Last 12 months, an Average of 3,639 Sales/Month
Pending Listings
3,102
2,441
3,451
165,392
160,014
97.69%
81.71
19,329
5.31
-0.23%
-1.89%
-6.65%
0.32%
0.49%
1.34%
0.67%
-9.01%
-14.70%
164,857
2,488
-6.65%
43,672
44,414
71,262
168,414
163,006
96.66%
76.07
19,329
5.31
40,941
41,408
70,336
161,055
155,414
96.29%
82.50
21,242
6.23
+/-%
6.67%
7.26%
1.32%
4.57%
4.89%
0.38%
-7.79%
-9.01%
-14.70%
2012
2013
165,392
159,232
-1.89%
+0.32%
2012
2013
Monthly Supply of Inventory
2013
Sale Price
2,441
INVENTORY
2012
AVERAGE PRICES
List Price
3,451
21,242
+/-%
2012
2013
DECEMBER MARKET
Active Inventory
2013
3,109
2,488
3,697
164,857
159,232
96.39%
81.17
21,242
6.23
Closed Sales
Pending Sales
New Listings
Average List Price
Average Sale Price
Average Percent of List Price to Selling Price
Average Days on Market to Sale
Monthly Inventory
Months Supply of Inventory
3,697
Year To Date
2012
Active Inventory as of December 31, 2013 = 19,329
New Listings
Market Activity
+0.49%
AVERAGE L/S% & DOM
% of List to Sale Price
6.23
5.31
-9.01%
96.39%
-14.70%
81.71
81.17
+1.34%
+0.67%
Reports produced and compiled by RE STATS Inc. Information is deemed reliable but not guaranteed. Does not reflect all market activity.
Steve Reese
405-848-9944
2012
2013
Days on Market to Sale
97.69%
19,329
160,014
steve@oklahomarealtors.com
pp. 10