

Recomendados
Más contenido relacionado
Último
Último (20)
Destacado
Destacado (20)
October 2013 Housing Sales Statistics
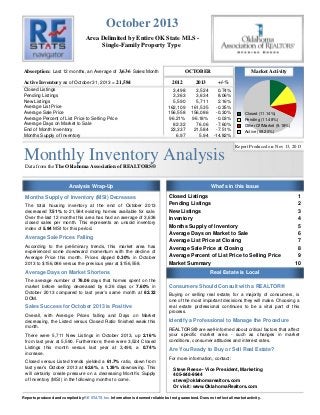
- 1. October 2013 Area Delimited by Entire OK State MLS Single-Family Property Type OCTOBER Absorption: Last 12 months, an Average of 3,636 Sales/Month Active Inventory as of October 31, 2013 = 21,584 Closed Listings Pending Listings New Listings Average List Price Average Sale Price Average Percent of List Price to Selling Price Average Days on Market to Sale End of Month Inventory Months Supply of Inventory Market Activity 2012 2013 +/-% 3,498 3,363 5,590 162,109 156,558 96.21% 82.32 23,337 6.97 3,524 3,634 5,711 161,535 156,086 96.18% 76.06 21,584 5.94 0.74% 8.06% 2.16% -0.35% -0.30% -0.03% -7.60% -7.51% -14.82% Monthly Inventory Analysis Closed (11.14%) Pending (11.48%) Other OffMarket (9.18%) Active (68.20%) Report Produced on: Nov 13, 2013 Data from the The Oklahoma Association of REALTORS® Analysis Wrap-Up Months Supply of Inventory (MSI) Decreases The total housing inventory at the end of October 2013 decreased 7.51% to 21,584 existing homes available for sale. Over the last 12 months this area has had an average of 3,636 closed sales per month. This represents an unsold inventory index of 5.94 MSI for this period. Average Sale Prices Falling According to the preliminary trends, this market area has experienced some downward momentum with the decline of Average Price this month. Prices dipped 0.30% in October 2013 to $156,086 versus the previous year at $156,558. Average Days on Market Shortens The average number of 76.06 days that homes spent on the market before selling decreased by 6.26 days or 7.60% in October 2013 compared to last year’s same month at 82.32 DOM. Sales Success for October 2013 is Positive Overall, with Average Prices falling and Days on Market decreasing, the Listed versus Closed Ratio finished weak this month. There were 5,711 New Listings in October 2013, up 2.16% from last year at 5,590. Furthermore, there were 3,524 Closed Listings this month versus last year at 3,498, a 0.74% increase. Closed versus Listed trends yielded a 61.7% ratio, down from last year’s October 2013 at 62.6%, a 1.39% downswing. This will certainly create pressure on a decreasing Month’s Supply of Inventory (MSI) in the following months to come. What's in this Issue Closed Listings Pending Listings New Listings Inventory Months Supply of Inventory Average Days on Market to Sale Average List Price at Closing Average Sale Price at Closing Average Percent of List Price to Selling Price Market Summary 1 2 3 4 5 6 7 8 9 10 Real Estate is Local Consumers Should Consult with a REALTOR® Buying or selling real estate, for a majority of consumers, is one of the most important decisions they will make. Choosing a real estate professional continues to be a vital part of this process. Identify a Professional to Manage the Procedure REALTORS® are well-informed about critical factors that affect your specific market area - such as changes in market conditions, consumer attitudes and interest rates. Are You Ready to Buy or Sell Real Estate? For more information, contact: Steve Reese - Vice President, Marketing 405-848-9944 steve@oklahomarealtors.com Or visit: www.OklahomaRealtors.com Reports produced and compiled by RE STATS Inc. Information is deemed reliable but not guaranteed. Does not reflect all market activity.
- 2. Monthly Inventory Analysis Data from the The Oklahoma Association of REALTORS® October 2013 Closed Sales as of Nov 12, 2013 Closed Listings Report Produced on: Nov 13, 2013 Area Delimited by Entire OK State MLS - Single-Family Property Type OCTOBER 2009 2010 2011 YEAR TO DATE (YTD) 2,501 2013 3,498 3,628 2012 2009 3,524 32,251 2,833 2010 2011 2012 2013 37,375 34,681 29,781 29,816 1 Year +0.74% 2 Year +24.39% 1 Year +7.77% 2 Year +25.35% 5 YEAR MARKET ACTIVITY TRENDS 5yr OCT AVG = 3,197 High Jul 2013 = 4,617 Low Jan 2010 = 1,719 5,000 4,000 3,000 3 MONTHS A 4,321 U G Closed Listings S 3,704 E P -14.28% Closed Listings this month at 3,524, above the 5 yr OCT O 3,524 C average of 3,197 T -4.86% 2,000 1,000 0 Jun 2009 Dec 2009Jun 2010 Dec 2010Jun 2011 Dec 2011Jun 2012 Dec 2012Jun 2013 CLOSED LISTINGS & BEDROOMS DISTRIBUTION BY PRICE Distribution of Closed Listings by Price Range % AVDOM 2 Beds 3 Beds 4 Beds 5 Beds+ 141 4.00% 86.9 73 55 11 2 $25,001 $75,000 660 18.73% 74.7 216 401 41 2 $75,001 $100,000 Ready to Buy or Sell Real Estate? Contact an experienced REALTOR $25,000 and less 413 11.72% 82.0 91 288 30 4 $100,001 $150,000 851 24.15% 69.0 168 588 88 7 $150,001 $200,000 625 17.74% 71.9 98 345 170 12 $200,001 $275,000 460 13.05% 75.5 58 187 191 24 $275,001 and up 374 10.61% 91.8 30 106 191 47 Total Closed Units: Total Closed Volume: Average Closed Price: 3,524 550,046,038 $156,086 76.1 734 1970 722 98 82.79M 262.40M 170.36M 34.49M $112,796 $133,197 $235,959 $351,980 Reports produced and compiled by RE STATS Inc. Information is deemed reliable but not guaranteed. Does not reflect all market activity. Steve Reese 405-848-9944 steve@oklahomarealtors.com pp. 1
- 3. Monthly Inventory Analysis Data from the The Oklahoma Association of REALTORS® October 2013 Pending Listings as of Nov 12, 2013 Pending Listings Report Produced on: Nov 13, 2013 Area Delimited by Entire OK State MLS - Single-Family Property Type OCTOBER 2009 2010 2011 YEAR TO DATE (YTD) 2,282 2013 3,363 3,401 2012 2009 2010 2011 3,634 2013 39,196 36,069 33,945 2,746 2012 30,159 30,790 1 Year +8.06% 2 Year +32.34% 1 Year +8.67% 2 Year +27.30% 5 YEAR MARKET ACTIVITY TRENDS 5yr OCT AVG = 3,085 High Apr 2010 = 4,937 Low Dec 2009 = 2,022 5,000 4,000 3,000 3 MONTHS A 4,094 U G Pending Listings S 3,409 E P -16.73% Pending Listings this month at 3,634, above the 5 yr OCT O 3,634 C average of 3,085 T 6.60% 2,000 1,000 0 Jun 2009 Dec 2009Jun 2010 Dec 2010Jun 2011 Dec 2011Jun 2012 Dec 2012Jun 2013 PENDING LISTINGS & BEDROOMS DISTRIBUTION BY PRICE Distribution of Pending Listings by Price Range % AVDOM 2 Beds 3 Beds 4 Beds 5 Beds+ 328 9.03% 74.0 159 137 28 4 $40,001 $70,000 385 10.59% 68.8 138 223 21 3 $70,001 $110,000 Ready to Buy or Sell Real Estate? Contact an experienced REALTOR $40,000 and less 659 18.13% 78.8 135 463 57 4 $110,001 $150,000 772 21.24% 72.9 120 532 111 9 $150,001 $200,000 659 18.13% 73.6 71 384 183 21 $200,001 $280,000 469 12.91% 77.9 53 198 204 14 $280,001 and up 362 9.96% 81.8 29 89 185 59 Total Pending Units: Total Pending Volume: Average Listing Price: 3,634 580,416,643 $142,507 82.7 705 2026 789 114 76.51M 276.36M 180.22M 47.32M $108,531 $136,408 $228,411 $415,110 Reports produced and compiled by RE STATS Inc. Information is deemed reliable but not guaranteed. Does not reflect all market activity. Steve Reese 405-848-9944 steve@oklahomarealtors.com pp. 2
- 4. Monthly Inventory Analysis Data from the The Oklahoma Association of REALTORS® October 2013 New Listings as of Nov 12, 2013 New Listings Report Produced on: Nov 13, 2013 Area Delimited by Entire OK State MLS - Single-Family Property Type OCTOBER 2009 5,276 2012 2013 5,590 5,114 2010 YEAR TO DATE (YTD) 2011 5,711 2010 2011 59,913 5,314 2009 59,424 56,973 2012 2013 62,052 63,342 1 Year +2.16% 2 Year +7.47% 1 Year +2.08% 2 Year +6.59% 5 YEAR MARKET ACTIVITY TRENDS 5yr OCT AVG = 5,401 High Apr 2010 = 7,793 Low Dec 2012 = 3,698 8,000 7,000 6,000 5,000 New Listings 4,000 3,000 2,000 1,000 0 Jun 2009 Dec 2009Jun 2010 Dec 2010Jun 2011 Dec 2011Jun 2012 Dec 2012Jun 2013 3 MONTHS A 6,359 U G S 5,471 E P -13.96% New Listings this month at 5,711, above the 5 yr OCT O 5,711 C average of 5,401 T 4.39% NEW LISTINGS & BEDROOMS DISTRIBUTION BY PRICE Distribution of New Listings by Price Range % 2 Beds 3 Beds 4 Beds 5 Beds+ 176 3.08% 86 79 8 3 $25,001 $75,000 987 17.28% 413 493 69 12 $75,001 $100,000 Ready to Buy or Sell Real Estate? Contact an experienced REALTOR $25,000 and less 657 11.50% 174 412 65 6 $100,001 $150,000 1,294 22.66% 215 896 172 11 $150,001 $225,000 1,285 22.50% 164 730 367 24 $225,001 $325,000 699 12.24% 69 281 307 42 $325,001 and up 613 10.73% 71 139 309 94 Total New Listed Units: Total New Listed Volume: Average New Listed Listing Price: 5,711 1,058,138,559 $161,378 1192 3030 1297 192 152.89M 461.17M 356.94M 87.15M $128,260 $152,200 $275,203 $453,893 Reports produced and compiled by RE STATS Inc. Information is deemed reliable but not guaranteed. Does not reflect all market activity. Steve Reese 405-848-9944 steve@oklahomarealtors.com pp. 3
- 5. Monthly Inventory Analysis Data from the The Oklahoma Association of REALTORS® October 2013 Active Inventory as of Nov 12, 2013 Active Inventory Report Produced on: Nov 13, 2013 Area Delimited by Entire OK State MLS - Single-Family Property Type END OF OCTOBER 2009 2010 2011 25,224 ACTIVE DURING OCTOBER 2012 25,467 23,325 20,744 2013 2009 2011 30,770 21,584 2010 31,325 2012 2013 29,543 28,126 26,548 1 Year -7.46% 2 Year -15.25% 1 Year -4.80% 2 Year -10.21% 5 YEAR MARKET ACTIVITY TRENDS 5yr OCT AVG = 23,269 Active Inventory High Jul 2011 = 26,759 Low Dec 2009 = 19,798 30,000 20,000 3 MONTHS A 22,933 U G S 22,426 E P -2.21% Inventory this month at 21,584, below the 5 yr OCT O 21,584 C average of 23,269 T -3.75% 10,000 0 Jun 2009Dec 2009Jun 2010Dec 2010Jun 2011Dec 2011Jun 2012Dec 2012Jun 2013 INVENTORY & BEDROOMS DISTRIBUTION BY PRICE Distribution of Inventory by Price Range % AVDOM 2 Beds 3 Beds 4 Beds 5 Beds+ 2,064 9.56% 118.4 1,068 868 113 15 $50,001 $75,000 2,233 10.35% 119.1 869 1,194 152 18 $75,001 $100,000 Ready to Buy or Sell Real Estate? Contact an experienced REALTOR $50,000 and less 2,586 11.98% 111.4 728 1,606 229 23 $100,001 $175,000 6,403 29.67% 102.6 1,167 4,058 1,080 98 $175,001 $225,000 2,686 12.44% 103.8 416 1,348 857 65 $225,001 $375,000 3,473 16.09% 112.3 473 1,176 1,568 256 $375,001 and up 2,139 9.91% 119.7 216 440 977 506 Total Active Inventory by Units: Total Active Inventory by Volume: Average Active Inventory Listing Price: 21,584 4,336,562,787 $200,916 110.3 4,937 10,690 4,976 981 680.65M 1.68B 1.44B 536.98M $137,868 $157,143 $289,202 $547,382 Reports produced and compiled by RE STATS Inc. Information is deemed reliable but not guaranteed. Does not reflect all market activity. Steve Reese 405-848-9944 steve@oklahomarealtors.com pp. 4
- 6. Monthly Inventory Analysis Data from the The Oklahoma Association of REALTORS® October 2013 Active Inventory as of Nov 12, 2013 Months Supply of Inventory Report Produced on: Nov 13, 2013 Area Delimited by Entire OK State MLS - Single-Family Property Type MSI FOR OCTOBER 2009 2010 2011 8.5 INDICATORS FOR OCTOBER 2013 2012 Inventory 2013 8.8 Absorption MSI MSI % 5.9 16.847% Months Supply of Inventory Percent Months Supply of Inventory 43,634 7.0 6.7 Closed 5.9 21,584 1 Year -14.78% 2 Year -32.67% End of Month Active Inventory Closed Last 12 Months 5 YEAR MARKET ACTIVITY TRENDS 3,636 Average Closed per Month over 12 Months 5yr OCT AVG = 7.4 High Jun 2011 = 9.7 Low Oct 2013 = 5.9 Months Supply 10 9 8 7 6 5 4 3 2 1 0 Jun 2009 Dec 2009 Jun 2010 Dec 2010 Jun 2011 Dec 2011 Jun 2012 Dec 2012 Jun 2013 3 MONTHS A 6.4 U G S 6.2 E P -3.35% Months Supply this month at 5.9, below the 5 yr OCT O 5.9 C average of 7.4 T -3.81% MONTHS SUPPLY & BEDROOMS DISTRIBUTION BY PRICE Distribution of Active Inventory by Price Range and MSI % MSI 2 Beds 3 Beds 4 Beds 5 Beds+ 2,064 9.56% 4.8 5.7 4.1 4.3 4.0 $50,001 $80,000 2,797 12.96% 7.0 8.8 6.2 6.4 7.3 $80,001 $110,000 Ready to Buy or Sell Real Estate? Contact an experienced REALTOR $50,000 and less 2,745 12.72% 6.0 6.6 5.7 6.6 8.7 $110,001 $170,000 5,310 24.60% 4.9 5.4 4.5 5.4 12.0 $170,001 $240,000 3,620 16.77% 5.5 6.4 5.5 5.1 5.4 $240,001 $370,000 2,834 13.13% 6.8 8.4 7.1 6.1 8.2 $370,001 and up 2,214 10.26% 12.3 17.2 12.8 10.4 15.3 6.7 5.4 4,937 10,690 6.2 4,976 10.3 981 MSI: Total Active Inventory: 5.9 21,584 Reports produced and compiled by RE STATS Inc. Information is deemed reliable but not guaranteed. Does not reflect all market activity. Steve Reese 405-848-9944 steve@oklahomarealtors.com pp. 5
- 7. Monthly Inventory Analysis Data from the The Oklahoma Association of REALTORS® October 2013 Closed Sales as of Nov 12, 2013 Average Days on Market to Sale Report Produced on: Nov 13, 2013 Area Delimited by Entire OK State MLS - Single-Family Property Type OCTOBER 2009 2010 2011 90 88 77 YEAR TO DATE (YTD) 2012 2013 2009 2010 2011 2012 2013 89 83 82 76 83 80 75 1 Year -7.60% 2 Year -13.29% 1 Year -9.26% 2 Year -15.08% 5 YEAR MARKET ACTIVITY TRENDS 5yr OCT AVG = 83 Average Days on Market High Mar 2011 = 98 Low Jul 2013 = 69 100 90 80 70 60 50 40 30 20 10 0 3 MONTHS A 73 U G S 72 E P -1.89% Average DOM this month at 76, below the 5 yr OCT O 76 C average of 83 T 5.53% Jun 2009 Dec 2009 Jun 2010 Dec 2010 Jun 2011 Dec 2011 Jun 2012 Dec 2012 Jun 2013 AVERAGE DOM OF CLOSED SALES & BEDROOMS DISTRIBUTION BY PRICE Distribution of Average Days on Market to Sale by Price Range % AVDOM 2 Beds 3 Beds 4 Beds 5 Beds+ Ready to Buy or Sell Real Estate? Contact an experienced REALTOR $25,000 and less 141 4.00% 86.9 96.5 78.8 63.1 92.0 $25,001 $75,000 660 18.73% 74.7 80.0 73.6 57.8 47.0 $75,001 $100,000 413 11.72% 82.0 92.4 77.3 86.8 144.3 $100,001 $150,000 851 24.15% 69.0 87.0 64.6 63.7 67.6 $150,001 $200,000 625 17.74% 71.9 94.2 65.7 65.6 154.7 $200,001 $275,000 460 13.05% 75.5 80.4 76.0 70.2 101.8 $275,001 and up 374 10.61% 91.8 123.6 84.2 95.3 74.5 Average Closed DOM: Total Closed Units: Total Closed Volume: 76.1 3,524 550,046,038 88.5 734 82.79M 71.0 1970 262.40M 74.8 722 170.36M Reports produced and compiled by RE STATS Inc. Information is deemed reliable but not guaranteed. Does not reflect all market activity. Steve Reese 405-848-9944 steve@oklahomarealtors.com 93.1 98 34.49M pp. 6
- 8. Monthly Inventory Analysis Data from the The Oklahoma Association of REALTORS® October 2013 Closed Sales as of Nov 12, 2013 Average List Price at Closing Report Produced on: Nov 13, 2013 Area Delimited by Entire OK State MLS - Single-Family Property Type OCTOBER 2009 2010 2011 YEAR TO DATE (YTD) 145,706 2013 162,109 155,343 2012 161,535 151,074 2009 2010 2011 2012 2013 168,606 149,512 152,026 155,478 160,044 1 Year -0.35% 2 Year +6.92% 1 Year +5.35% 2 Year +8.44% 5 YEAR MARKET ACTIVITY TRENDS 5yr OCT AVG = 155K Average List Price High Aug 2013 = 176,591 Low Jan 2010 = 139,073 200,000 3 MONTHS A 176,591 U G S 167,384 E Average LPrice this P -5.21% month at 161,535, above the 5 yr OCT O 161,535 C average of 155,153 T -3.49% 100,000 0 Jun 2009Dec 2009Jun 2010Dec 2010Jun 2011Dec 2011Jun 2012Dec 2012Jun 2013 AVERAGE LIST PRICE OF CLOSED SALES & BEDROOMS DISTRIBUTION BY PRICE Distribution of Average List Price at Closing by Price Range % AVL$ 2 Beds 3 Beds 4 Beds 5 Beds+ 107 3.04% 17,464 21,127 24,188 18,291 8,750 $25,001 $75,000 649 18.42% 52,555 54,566 56,634 51,260 47,500 $75,001 $100,000 Ready to Buy or Sell Real Estate? Contact an experienced REALTOR $25,000 and less 406 11.52% 88,885 93,429 91,846 94,280 98,100 $100,001 $150,000 876 24.86% 127,747 130,915 129,007 134,020 135,325 $150,001 $200,000 625 17.74% 175,573 177,641 175,562 180,960 186,500 $200,001 $275,000 465 13.20% 235,895 238,027 237,618 241,860 243,040 $275,001 and up 396 11.24% 418,822 381,767 373,082 425,405 578,696 Average List Price: Total Closed Units: Total List Volume: $161,535 3,524 569,248,091 $117,836 $137,512 $242,570 $374,713 734 1970 722 98 86.49M 270.90M 175.14M 36.72M Reports produced and compiled by RE STATS Inc. Information is deemed reliable but not guaranteed. Does not reflect all market activity. Steve Reese 405-848-9944 steve@oklahomarealtors.com pp. 7
- 9. Monthly Inventory Analysis Data from the The Oklahoma Association of REALTORS® October 2013 Closed Sales as of Nov 12, 2013 Average Sold Price at Closing Report Produced on: Nov 13, 2013 Area Delimited by Entire OK State MLS - Single-Family Property Type OCTOBER 2009 2010 2011 YEAR TO DATE (YTD) 140,837 2013 156,558 149,000 2012 156,086 145,017 2009 2010 2011 2012 2013 163,240 144,289 146,473 149,357 154,397 1 Year -0.30% 2 Year +7.63% 1 Year +5.73% 2 Year +9.30% 5 YEAR MARKET ACTIVITY TRENDS 5yr OCT AVG = 149K Average Sold Price High Jul 2013 = 171,542 Low Jan 2010 = 133,432 200,000 3 MONTHS A 170,259 U G S 162,432 E Average SPrice this P -4.60% month at 156,086, above the 5 yr OCT O 156,086 C average of 149,500 T -3.91% 100,000 0 Jun 2009Dec 2009Jun 2010Dec 2010Jun 2011Dec 2011Jun 2012Dec 2012Jun 2013 AVERAGE SOLD PRICE OF CLOSED SALES & BEDROOMS DISTRIBUTION BY PRICE Distribution of Average Sold Price at Closing by Price Range % AVS$ 2 Beds 3 Beds 4 Beds 5 Beds+ 141 4.00% 17,465 16,936 18,661 17,182 5,500 $25,001 $75,000 660 18.73% 51,748 50,529 52,721 48,593 53,000 $75,001 $100,000 Ready to Buy or Sell Real Estate? Contact an experienced REALTOR $25,000 and less 413 11.72% 88,429 87,932 88,363 90,525 88,725 $100,001 $150,000 851 24.15% 126,281 126,111 125,900 129,282 124,643 $150,001 $200,000 625 17.74% 173,774 172,154 172,600 176,919 176,208 $200,001 $275,000 460 13.05% 233,988 231,128 231,294 236,902 238,701 $275,001 and up 374 10.61% 409,627 372,565 358,052 412,376 538,431 Average Closed Price: Total Closed Units: Total Closed Volume: $156,086 3,524 550,046,038 $112,796 $133,197 $235,959 $351,980 734 1970 722 98 82.79M 262.40M 170.36M 34.49M Reports produced and compiled by RE STATS Inc. Information is deemed reliable but not guaranteed. Does not reflect all market activity. Steve Reese 405-848-9944 steve@oklahomarealtors.com pp. 8
- 10. Monthly Inventory Analysis Data from the The Oklahoma Association of REALTORS® October 2013 Closed Sales as of Nov 12, 2013 Average Percent of List Price to Selling Price Report Produced on: Nov 13, 2013 Area Delimited by Entire OK State MLS - Single-Family Property Type OCTOBER 2009 2010 2011 YEAR TO DATE (YTD) 2012 95.36% 2009 96.21% 96.66% 2013 96.18% 96.41% 95.45% 2010 2011 2012 2013 96.62% 96.28% 96.15% 95.78% 1 Year -0.03% 2 Year +0.76% 1 Year +0.35% 2 Year +0.88% 5 YEAR MARKET ACTIVITY TRENDS 5yr OCT AVG=95.97% Average List/Sell Price High Jun 2013 = 96.99% Low Jan 2011 = 95.22% 97 3 MONTHS A 96.71% U G S 96.46% E Average List/Sell this P -0.27% month at 96.18%, above the 5 yr OCT O 96.18% C average of 95.97% T -0.28% 96 95 Jun 2009 Dec 2009 Jun 2010 Dec 2010 Jun 2011 Dec 2011 Jun 2012 Dec 2012 Jun 2013 AVERAGE L/S% OF CLOSED SALES & BEDROOMS DISTRIBUTION BY PRICE Distribution of $avgmed L/S % by Price Range % AVL/S% 2 Beds 3 Beds 4 Beds 5 Beds+ 141 4.00% 84.18% 82.22% 85.28% 95.63% 62.83% $25,001 $75,000 660 18.73% 93.58% 92.75% 93.67% 96.18%110.89% $75,001 $100,000 Ready to Buy or Sell Real Estate? Contact an experienced REALTOR $25,000 and less 413 11.72% 96.15% 94.56% 96.68% 96.46% 91.52% $100,001 $150,000 851 24.15% 97.68% 96.60% 98.19% 96.60% 93.71% $150,001 $200,000 625 17.74% 98.09% 97.09% 98.57% 97.90% 95.21% $200,001 $275,000 460 13.05% 97.75% 97.26% 97.49% 98.01% 98.82% $275,001 and up 374 10.61% 96.83% 98.05% 96.60% 97.38% 94.32% Average List/Sell Ratio: Total Closed Units: Total Closed Volume: 96.20% 3,524 550,046,038 93.96% 734 82.79M 96.60% 1970 262.40M 97.44% 722 170.36M Reports produced and compiled by RE STATS Inc. Information is deemed reliable but not guaranteed. Does not reflect all market activity. Steve Reese 405-848-9944 steve@oklahomarealtors.com 95.07% 98 34.49M pp. 9
- 11. Monthly Inventory Analysis Data from the The Oklahoma Association of REALTORS® October 2013 Inventory as of Nov 12, 2013 Market Summary Report Produced on: Nov 13, 2013 Area Delimited by Entire OK State MLS - Single-Family Property Type Inventory Inventory Market Activity New Listings 5,711 = 20.29% Closed Sales 3,524 = 11.14% Start Inventory 22,429 Pending Sales 3,634 = 11.48% Total Inventory Units 28,140 Volume $5,489,197,620 Other Off Market 2,905 = 9.18% Active Inventory 21,584 = 68.20% OCTOBER Absorption: Last 12 months, an Average of 3,636 Sales/Month Pending Listings 3,524 3,634 5,711 161,535 156,086 96.18% 76.06 21,584 5.94 0.74% 8.06% 2.16% -0.35% -0.30% -0.03% -7.60% -7.51% -14.82% 162,109 3,363 +2.16% 7.77% 8.67% 2.08% 5.35% 5.73% 0.35% -9.26% -7.51% -14.82% 2012 2013 161,535 -0.35% 2012 2013 6.97 37,375 39,196 63,342 168,606 163,240 96.62% 75.31 21,584 5.94 34,681 36,069 62,052 160,044 154,397 96.28% 83.00 23,337 6.97 +/-% 156,558 +8.06% Monthly Supply of Inventory 2013 Sale Price 3,634 INVENTORY 2012 AVERAGE PRICES List Price 5,711 23,337 +/-% 2012 2013 OCTOBER MARKET Active Inventory 2013 3,498 3,363 5,590 162,109 156,558 96.21% 82.32 23,337 6.97 Closed Sales Pending Sales New Listings Average List Price Average Sale Price Average Percent of List Price to Selling Price Average Days on Market to Sale Monthly Inventory Months Supply of Inventory 5,590 Year To Date 2012 Active Inventory as of October 31, 2013 = 21,584 New Listings Market Activity 156,086 -0.30% AVERAGE L/S% & DOM % of List to Sale Price 96.21% 2012 2013 Days on Market to Sale 82.32 21,584 5.94 96.18% 76.06 -7.51% -14.82% -0.03% -7.60% Reports produced and compiled by RE STATS Inc. Information is deemed reliable but not guaranteed. Does not reflect all market activity. Steve Reese 405-848-9944 steve@oklahomarealtors.com pp. 10