
Recomendados
Recomendados
Más contenido relacionado
La actualidad más candente
La actualidad más candente (16)
Similar a Ocean City High School report card 2013
Similar a Ocean City High School report card 2013 (20)
Más de OceanCityGazette
Más de OceanCityGazette (20)
Último
Último (20)
Ocean City High School report card 2013
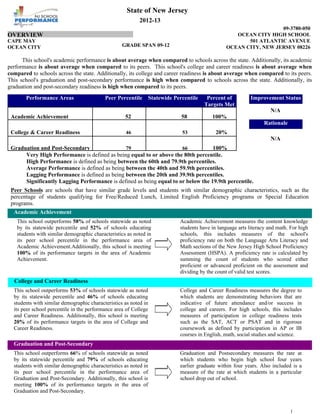
- 1. State of New Jersey 2012-13 09-3780-050 OCEAN CITY HIGH SCHOOL 501 ATLANTIC AVENUE OCEAN CITY, NEW JERSEY 08226 OVERVIEW CAPE MAY OCEAN CITY GRADE SPAN 09-12 1.00 This school's academic performance is about average when compared to schools across the state. Additionally, its academic performance is about average when compared to its peers. This school's college and career readiness is about average when compared to schools across the state. Additionally, its college and career readiness is about average when compared to its peers. This school's graduation and post-secondary performance is high when compared to schools across the state. Additionally, its graduation and post-secondary readiness is high when compared to its peers. Performance Areas Peer Percentile Statewide Percentile Percent of Targets Met Academic Achievement 52 58 100% College & Career Readiness 46 53 Improvement Status 20% N/A Rationale N/A 79 66 100% Graduation and Post-Secondary Very High Performance is defined as being equal to or above the 80th percentile. High Performance is defined as being between the 60th and 79.9th percentiles. Average Performance is defined as being between the 40th and 59.9th percentiles. Lagging Performance is defined as being between the 20th and 39.9th percentiles. Significantly Lagging Performance is defined as being equal to or below the 19.9th percentile. Peer Schools are schools that have similar grade levels and students with similar demographic characteristics, such as the percentage of students qualifying for Free/Reduced Lunch, Limited English Proficiency programs or Special Education programs. Academic Achievement This school outperforms 58% of schools statewide as noted by its statewide percentile and 52% of schools educating students with similar demographic characteristics as noted in its peer school percentile in the performance area of Academic Achievement.Additionally, this school is meeting 100% of its performance targets in the area of Academic Achievement. Academic Achievement measures the content knowledge students have in language arts literacy and math. For high schools, this includes measures of the school's proficiency rate on both the Language Arts Literacy and Math sections of the New Jersey High School Proficiency Assessment (HSPA). A proficiency rate is calculated by summing the count of students who scored either proficient or advanced proficient on the assessment and dividing by the count of valid test scores. College and Career Readiness This school outperforms 53% of schools statewide as noted by its statewide percentile and 46% of schools educating students with similar demographic characteristics as noted in its peer school percentile in the performance area of College and Career Readiness. Additionally, this school is meeting 20% of its performance targets in the area of College and Career Readiness. College and Career Readiness measures the degree to which students are demonstrating behaviors that are indicative of future attendance and/or success in college and careers. For high schools, this includes measures of participation in college readiness tests such as the SAT, ACT or PSAT and in rigorous coursework as defined by participation in AP or IB courses in English, math, social studies and science. Graduation and Post-Secondary This school outperforms 66% of schools statewide as noted by its statewide percentile and 79% of schools educating students with similar demographic characteristics as noted in its peer school percentile in the performance area of Graduation and Post-Secondary. Additionally, this school is meeting 100% of its performance targets in the area of Graduation and Post-Secondary. Graduation and Postsecondary measures the rate at which students who begin high school four years earlier graduate within four years. Also included is a measure of the rate at which students in a particular school drop out of school. 1
- 2. State of New Jersey 2012-13 09-3780-050 OCEAN CITY HIGH SCHOOL 501 ATLANTIC AVENUE OCEAN CITY, NEW JERSEY 08226 DEMOGRAPHIC INFORMATION CAPE MAY OCEAN CITY GRADE SPAN 09-12 Enrollment by Grade, in Full Time Equivalent Language Diversity This graph presents the count of students who were 'on roll' by grade in October of each school year. This table presents the percentage of students who primarily speak each language in their home. 1400 18 Enrollment Count 21 23 330 331 297 320 1200 295 296 2012-13 UG Percent 800 12 0 0.9% Mon-Khmer languages 0.1% Tagalog 0.1% 0.1% Chinese 0.1% Other 0.2% 09 298 289 200 Spanish 10 285 400 98.6% 11 600 English Greek, Modern (1453-) 1000 314 294 2011-12 2012-13 2010-11 318 Total School Enrollment Trends Note: "UG" represents the count of students who are 'on roll' in this school but who are educated in ungraded classrooms, meaning that the classrooms may contain students from multiple grade levels. Total School Enrollment in Full Time Equivalent 2011-12 2012-13 1,258 1,227 Enrollment Trends by Program Participation 20 Percent of Enrollment 16 18 14 15 14 2010-11 12 12 2011-12 2012-13 Enrollment by Gender 8 4 0 This graph presents the count of students by gender who were 'on roll' (FTE) in October of each school year. 3 700 0 0 0 DISABILITY ECONDIS 600 LEP 500 Current Year Enrollment by Program Participation 2012-2013 Students with Disability Economically Disadvantaged Students Limited English Proficient Students Count of Students Percentage of Enrollment 167 14% 222 0.1% Female 300 200 100 18.1% 1 Male 400 2.00 0 2010-11 2010-11 2011-12 2012-13 2011-12 Male 615 607 597 2012-13 Female 627 652 630 2
- 3. State of New Jersey 2012-13 09-3780-050 OCEAN CITY HIGH SCHOOL 501 ATLANTIC AVENUE OCEAN CITY, NEW JERSEY 08226 ACADEMIC ACHIEVEMENT CAPE MAY OCEAN CITY GRADE SPAN 09-12 Academic Achievement measures the content knowledge students have in Language Arts Literacy and Math. In high schools, this includes the outcomes of the New Jersey High School Proficiency Assessment (HSPA). The first column - Schoolwide Performance - in the table below includes measures of the total schoolwide proficiency rate in both Language Arts Literacy and Math across multiple administrations of the assessment. The second column - Peer School Percentile - indicates where the school's proficiency rate compares to its group of peer schools. For example, a school that has a peer school percentile of 65 has a proficiency rate that is higher than 65% of its peer schools. The third column - Statewide Percentile - indicates where the school's proficiency rate compares to schools across the state. For example, a school that has a statewide percentile of 30 has a proficiency rate that is higher than 30% of all schools with HSPA scores statewide. The last column - Percent of Targets Met - presents the percentage of progress targets met as defined by the NJDOE’s NCLB waiver. The Summary row presents the averages of the peer school percentiles, the average of statewide percentiles and the percentage of statewide targets met. Peer Percentile Schoolwide Performance Academic Achievement Indicators State Percentile Percent of Targets Met HSPA Language Arts Proficiency and above 96% 45 51 100% HSPA Math Proficiency and above 92% 58 64 100% 52 58 100% SUMMARY - Academic Achievement NCLB Progress Targets - Language Arts Literacy Proficiency Trends - Language Arts Literacy This table presents the Progress Targets as uniquely calculated for each subgroup in each school under NJDOE’s NCLB waiver. The methodology - as defined by the United States Department of Education - is calculated so that each subgroup will halve the gap between their 2011 proficiency rate and 100% proficiency by 2017. Subgroups Schoolwide White Total Valid Scores 287 265 Pass Rate 95.9 95.9 Target Met Target? YES 90 90 This graph presents the percentage of students who scored in the Advanced Proficient, Proficient and Partially Proficient categories of the statewide Language Arts Literacy assessment over the prior four years. 100 YES Black - - -- Hispanic - - -- 11 19 24 19 76 71 77 80 60 American Indian - - -- 40 Asian - - -- 20 Two or More Races - - -- 0 41 70.8 - - 47 91.5 83 Students with Disability Limited English Proficient Students Economically Disadvantaged Students 75.8 YES* -- 86.7 6 5 5 2009-10 2010-11 2011-12 Advanced Proficient 4 2012-13 Proficient Partially Proficient YES YES* = Met Progress Target (Confidence Interval Applied) Data is presented for subgroups when the count is high enough under NCLB suppression rules. 3
- 4. State of New Jersey 2012-13 09-3780-050 OCEAN CITY HIGH SCHOOL 501 ATLANTIC AVENUE OCEAN CITY, NEW JERSEY 08226 ACADEMIC ACHIEVEMENT CAPE MAY OCEAN CITY GRADE SPAN 09-12 Proficiency Trends - Math NCLB Progress Targets - Math This table presents the Progress Targets as uniquely calculated for each subgroup in each school under NJDOE’s NCLB waiver. The methodology - as defined by the United States Department of Education - is calculated so that each subgroup will halve the gap between their 2011 proficiency rate and 100% proficiency by 2017. Total Valid Pass Met Subgroups Target Scores Rate Target? Schoolwide 287 91.6 90 YES White 265 93.2 Black - - 90 This graph presents the percentage of students who scored in the Advanced Proficient, Proficient and Partially Proficient categories of the statewide Math assessment over the prior four years. YES 100 -- Hispanic - - -- American Indian - - -- - - -- 40 Two or More Races - - -- 41 56.1 29 28 25 59 62 60 67 9 9 12 8 2009-10 2010-11 2011-12 2012-13 Proficient 60 Asian 32 Advanced Proficient 80 Students with Disability Limited English Proficient Students Economically Disadvantaged Students - 76.6 20 YES* - 47 65.7 0 -79.5 YES* Partially Proficient YES* = Met Progress Target(Confidence Interval Applied) Data is presented for subgroups when the count is high enough under NCLB suppression rules. 3.00 Proficiency Outcomes - Biology This table presents the percentage of students who scored in the Advanced Proficient, Proficient and Partially Proficient categories of the New Jersey Biology Competency Test (NJBCT) in the latest school year. Partially Subgroups Advanced Proficient Proficient Schoolwide 24% 49% 27% White 25% 50% - - - This graph presents the percentage of students who scored in the Advanced Proficient, Proficient, and Partially Proficient categories of the Biology Competency Test over the last two years. 25% Black Proficiency Trends - Biology 100 Hispanic - - - - - - 60 Asian - - - - - - 3% 30% 68% - - - 16% 36% 48% 46 43 37 40 2010-11 2011-12 24 40 Two or More Races 17 80 American Indian 17 Students with Disability Limited English Proficient Students Economically Disdvantaged Students Data is presented for subgroups when the count is high enough under NCLB suppression rules. 20 0 49 Advanced Proficient 27 2012-13 Proficient Partially Proficient 4
- 5. State of New Jersey 2012-13 09-3780-050 OCEAN CITY HIGH SCHOOL 501 ATLANTIC AVENUE OCEAN CITY, NEW JERSEY 08226 COLLEGE AND CAREER READINESS CAPE MAY OCEAN CITY GRADE SPAN 09-12 Students in high schools begin to demonstrate college readiness behaviors long before they actually graduate from high school. Among those behaviors are taking college entrance exams and challenging themselves with rigorous course work. The table below presents five such indicators: the percentage of students enrolled in the 12th grade who took the SAT or ACT, the percentage of 10th and 11th graders who took the PSAT, the percentage of students who scored above the SAT benchmark of 1550, the percentage of 11th and 12th graders who took at least one AP or IB test in English, math, social studies or science, and the percentage of those AP or IB tests that were scored a 3 or higher. The first column - Schoolwide Performance - represents the outcomes for these particular inidcators in the school. The second column - Peer School Percentile - indicates how the school's performance compares to its group of peer schools. For example, a school whose peer school percentile is 65 in SAT participation has a higher SAT Participation than 65% of its peer group. The third column Statewide Percentile - indicates how the school's performance compares to schools across the state. The fourth column - Statewide Target - provides the statewide targets for each of these indicators. The last column - Met Target? - indicates whether the School Performance met or exceeded the statewide target. The Summary row presents the averages of the peer school percentiles, the average of statewide percentiles and the percentage of statewide targets met. College and Career Readiness Indicators Schoolwide Performance Percent of Students Participating in SAT or ACT Peer Percentile Statewide Percentile Statewide Target Met Target? 84% YES 29 32 60% NO 26 55 40% NO 24% 90 72 35% NO 67% 16 48 75% NO 46 Percent of Students Taking at least one AP Test or IB Test in English, Math, Social Studies or Science Percent of AP Tests >= 3 or IB Test >= 4 in English, Math, Social Studies or Science 80% 39% Percent of Students Scoring Above 1550 on SAT 57 38% Percent of Students Participating in PSAT 68 53 Summary 20% College Readiness Test Participation AP/IB Participation - 'Unique' Students The first column of the table below presents the percentage of students enrolled in the 12th grade who took the SAT or ACT and the percentage of students enrolled in 10th and 11th grade who took the PSAT. The second column provides the average across the school's peer group for these two metrics. The table below presents the proportion of 'unique' students enrolled in at least 11th and 12th grade i.e, each student is counted once regardless of how many AP or IB courses he/she may take. The table also presents the proportion of how many 'unique' students took at least one AP or IB test to the school's enrollment in 11th and 12th grade. 2012-13 Percent of Students Peer State School Taking Avg. Avg. One or More Course 53.8% 31.0% 32.8% 2012-13 Percent of Students School Participating in SAT 75.6% 75.3% 36.0% Participating in PSAT State Avg. 79.8% Participating in ACT Peer Avg. 37.7% 20.6% 57.1% 52.5% Participation Trends - SAT Testing This graph presents the participation rate in the SAT over the last four years. Participation Rate 100 60 AP /IB Test Results 2012-13 74 82 82 School 80 Peer Avg. State Avg. Percent of AP Tests >= 3 or IB Test >= 4 20 0 35.6% 21.9% 26.8% At least one AP or IB Test in English, Math, Social Studies or Science 24.3% 17.7% 18.9% Note: Students who are enrolled in AP/IB coursework or take AP/IB tests in grades other than 11th and 12th are included in the numerator of this calculation. This table presents the percentage of all AP/IB tests taken by students enrolled in the school that were scored AP >= 3 and scored IB >= 4. 80 40 One or More Test 2009-10 2010-11 2011-12 Year 2012-13 71.1% 76.8% 74.6% Percent of Scores in AP >= 3 or IB >= 4 in English, Math, Social Studies or Science 67.4% 79.0% 75.1% 5
- 6. State of New Jersey 2012-13 09-3780-050 OCEAN CITY HIGH SCHOOL 501 ATLANTIC AVENUE OCEAN CITY, NEW JERSEY 08226 COLLEGE AND CAREER READINESS CAPE MAY OCEAN CITY GRADE SPAN 09-12 AP/IB Courses Offered Scholastic Assessment Test (SAT) Results This table presents the percentage of students who achieved a composite SAT score of 1550 or higher. The SAT benchmark score of 1550 (Critical Reading, Mathematics and Writing Score combined) indicates a 65 percent likelihood of achieveing a B- average or higher during the first year of college, which in turn has been found by the College Board's research to be indicative of a high likelihood of college success and completion. This table presents the count of students enrolled in each AP/IB course offered in this school in the first column. The second column presents the count of tests taken in each AP/IB course. The numbers may not match as some students do not take the test in the same year as they take the course and some students may take the course without taking the test or vice versa. Students Enrolled Students Tested AP U.S. History 135 48 AP Psychology 120 97 AP Statistics 65 50 AP U.S. Government and Politics 45 37 AP Biology 44 31 AP Calculus AB 40 33 AP English Language and Composition 37 34 AP Chemistry 32 26 AP English Literature and Composition 31 23 AP Studio Art -- 2D Design 22 14 AP Human Geography 17 12 AP World History 13 10 AP Physics B 13 11 AP Calculus BC 10 10 AP Spanish Language 9 9 AP Computer Science A 6 6 AP/IB Course Name 2012-13 School Percent of Students Scoring Above 1550 on SAT Peer Avg. 39.2% 44.5% State Avg. 43.9% SAT Benchmark Trends This chart presents the percentage of students who achieved a composite SAT score of 1550 or higher over the past four years. 100 % above 1550 80 PERCENT SAT ABOVE 1550 60 40 20 0 46.2 40.0 40.2 39.2 2009-10 2010-11 2011-12 2012-13 Year Composite SAT Score This chart presents the average composite SAT score from the last academic year for students enrolled in this school as well as the average scores achieved in Critical Reading, Mathematics and Writing. The averages from this school’s peer group are also presented. School Peer Avg. 2012-13 State Avg. Composite SAT Score 1,479 1,534 1,512 Critical Reading 488 505 495 Mathematics 512 525 521 Writing 479 504 496 This chart presents the scores achieved in Critical Reading, Mathematics and Writing by the students at the 25th percentile, the 50th percentile and the 75th percentile of the school's distribution of SAT scores. 2012-13 Critical Reading Mathematics Writing 75th Percentile 550 580 540 50th Percentile 480 510 470 25th Percentile 430 440 410 6
- 7. State of New Jersey 2012-13 09-3780-050 OCEAN CITY HIGH SCHOOL 501 ATLANTIC AVENUE OCEAN CITY, NEW JERSEY 08226 COLLEGE AND CAREER READINESS CAPE MAY OCEAN CITY GRADE SPAN 09-12 4.00 Visual and Performing Arts The chart below contains the percentage of students who were enrolled in at least one Dance, Drama/Theater, Music or Visual Arts class in this school. The last row shows the percentage of students who were enrolled in any Visual and Performing Arts classes in the school. Percent of Students Enrolled Dance Drama/Theater School State N/R 1.8% 1.7% 3.5% Music 21.0% 16.7% Visual Arts 32.6% 30.2% Total: All Visual and Performing Arts 50.2% 47.3% N/R - Data Not Reported 7
- 8. State of New Jersey 2012-13 09-3780-050 OCEAN CITY HIGH SCHOOL 501 ATLANTIC AVENUE OCEAN CITY, NEW JERSEY 08226 GRADUATION AND POSTSECONDARY CAPE MAY OCEAN CITY GRADE SPAN 09-12 This section of the performance report presents data about graduation, dropout and post-secondary attendance. The graduation rate is calculated according to the NCLB Cohort methodology as required by the United States Department of Education. Dropout rates are calculated from student-level data submitted by districts for students officially classified as dropouts. The dropout rate is the count of students who dropout in an academic year divided by the school's total enrollment. The first column - Schoolwide Performance - represents the outcomes for these particular indicators in this school. The second column - Peer School Percentile - indicates how the school’s performance compares to its group of peer schools. For example, a school whose peer percentile is 65 in Graduation Rate has a higher Graduation Rate than 65% of its peer group. The third column - Statewide Percentile - indicates how the school’s performance compares to schools across the state. The fourth column - Statewide Target - provides the statewide targets for each of these indicators. The Statewide Target for Graduation Rate was established pursuant to NJDOE’s NCLB Accountability Workbook. The last column - Met Target - indicates whether the School Performance met or exceeded the statewide target. The Summary row presents the averages of the peer school percentile, the average of statewide percentile and the percentage of statewide targets met. Graduation & Post Secondary Indicators Schoolwide Performance Peer Percentile Statewide Percentile Statewide Targets Met Target Overall Graduation Rate 96% 84 71 75% YES Dropout Rate 0.3% 74 61 2% YES 79 66 SUMMARY - Graduation & Post-Secondary Dropout Rate by Subgroup Graduation Rate by Subgroup This table presents for all NCLB-identified subgroups the “4year Adjusted Graduation Rate.” This rate calculates the percentage of students who are awarded a regular, high school diploma within four years of becoming a first-time ninth grader. The rate is adjusted to account for students who ‘transfer-in’ and for students who are verified as ‘transfers-out'. School 100% This table presents for all NCLB-identified subgroups the Dropout rate. This rate calculates the percentage of students who are classified as dropouts divided by the school's total enrollment and by each subgroup enrollment. School State Target State Target Schoolwide .3% 96% White .4% Black - Black 0% Hispanic - Hispanic 0% American Indian - American Indian - Asian - Asian - Native Hawaiian - Native Hawaiian - Two or More Races - Two or More Races - Schoolwide 96% White Students with Disability Limited English Proficient Students Economically Disadvantaged Students 86% 92% 75% Students with Disability Limited English Proficient Students Economically Disadvantaged Students 2% 0% 0% 8
- 9. State of New Jersey 2012-13 09-3780-050 OCEAN CITY HIGH SCHOOL 501 ATLANTIC AVENUE OCEAN CITY, NEW JERSEY 08226 GRADUATION AND POSTSECONDARY CAPE MAY OCEAN CITY GRADE SPAN 09-12 Extended Year Graduation Rate Graduation Pathway Rates This chart presents the percentage of high school graduates who graduated by passing both sections of the HSPA, who were exempt from passing the HSPA, or who demonstrated proficiency through an alternative pathway such as through the Alternative High School Assessment, achievement of the ‘Just Proficient Mean’ or an appeal process. The chart below presents the 4-year and 5-year graduation rate for the prior school year’s cohort in addition to the 4-year graduation rate for last year’s cohort. Class of 4-year Rate 5-year Rate 2011 98% 2012 99% 97% 2013 EXEMPT 6.9 OTHER 3.3 97% 96% HSPA 89.8 HSPA OTHER EXEMPT Postsecondary Enrollment Rates 5.00 This chart presents the enrollment rates of this school’s high school graduates, 16-months after high school graduation. The data is from the National Student Clearinghouse which reports that it collects student-level enrollment data from 95% of Institutions of Higher Education nationwide. The last columns indicate, for the schoolwide total and each subgroup, the percentage of postsecondary enrollees that were enrolled in either a 2 year or a 4 year institution. Percent Enrolled Percent in 2 Year Percent in 4 Year 76% 37.9% 62.1% White 76.4% 35.6% 64.4% Black - - - Hispanic - - - Asian - - - American Indian - - - Native Hawaiian - - - Two or More Races - - - 73.3% 26.7% Schoolwide Students with Disability 60% Limited English Proficient Students - - - Economically Disadvantaged Students - - 9
- 10. State of New Jersey 2012-13 09-3780-050 OCEAN CITY HIGH SCHOOL 501 ATLANTIC AVENUE OCEAN CITY, NEW JERSEY 08226 WITHIN SCHOOL ACHIEVEMENT GAP CAPE MAY OCEAN CITY GRADE SPAN 09-12 6.00 This section of the performance report presents data about the achievement gap that exists within a school - as measured by the difference between the students’ scale scores at the 25th and 75th percentile in the school, the so-called Interquartile Range (IQR). Taken together with an understanding of the overall and average achievement levels in the school, the IQR furthers an understanding of the range of student outcomes that exist in a school. A school gap smaller than the state gap indicates that the school’s range of student outcomes is narrower than the state’s while a school gap larger than the state gap indicates that the school’s range of student outcomes is larger than the state’s. High School Grade Level - 11 HSPA Language Arts 25th %ile vs 75th%ile This table presents the scale scores associated with students at the bottom (0th percentile), the 25th percentile, the 50th percentile, the 75th percentile and the top (99th percentile) of school's distribution. Percentile School Scaled Score State Scaled Score HSPA Math 25th %ile vs 75th%ile This table presents the scale scores associated with students at the bottom (0th percentile), the 25th percentile, the 50th percentile, the 75th percentile and the top (99th percentile) of school's distribution. Percentile School Scaled Score State Scaled Score 99th 264 291 99th 269 300 75th 245 247 75th 250 251 50th 236 237 50th 235 231 25th 227 222 25th 214 209 0th 147 100 0th 162 136 Scaled Score Gap Scaled Score Gap - School - State 25th vs 75th Gap 18 25 Scaled Score Gap Scaled Score Gap - School - State 25th vs 75th Gap 36 42 10
- 11. State of New Jersey 2012-13 09-3780-050 OCEAN CITY HIGH SCHOOL 501 ATLANTIC AVENUE OCEAN CITY, NEW JERSEY 08226 SCHOOL CLIMATE CAPE MAY OCEAN CITY GRADE SPAN 09-12 Length of School Day This table presents the amount of time a school is in session for a typical student on a normal school day. 7.00 Instructional Time This table presents the amount of time that a typical student is engaged in instructional activities under the supervision of a certified teacher. School 2012-13 2012-13 School Full Time 5 Hrs. 50 Mins. Shared Time 6 Hrs. 45 Mins. 2 Hrs. 45 Mins. Student Suspension Rate This table presents the percentage of students who were suspended one or more times during the school year. Student Expulsions This table presents the number of students who were expelled from the school and district during the school year. School 2012-13 10.6% School 2012-13 0 Student to Staff Ratio This table presents the count of students per faculty member or administrator in the school. All staff are counted in full-time equivalents. 2012-13 School Faculty 8 Administrators 245 11
- 12. OCEAN CITY HIGH SCHOOL 09-3780-050 SCHOOL PEER GROUP This table presents the list of peer schools in alphabetical order by county name that was created specifically for this school (highlighted in yellow). Peer schools are drawn from across the state and represent schools that have similar grade configurations and that are educating students of similar demographic characteristics, as measured by enrollment in Free/Reduced Lunch Programs, Limited English Proficiency or Special Education Programs. COUNTY NAME DISTRICT NAME SCHOOL NAME HASBROUCK HEIGHTS BORO HASBROUCK HEIGHTS HIGH BERGEN SCHOOL CHEROKEE HIGH SCHOOL BURLINGTON LENAPE REGIONAL CDS GRAD CODE ESPAN FRPL LEP 03-2080-050 09-12 15.2% 0.4% SpED 11.8% 05-2610-040 09-12 10.7% 0.4% 17.0% BURLINGTON LENAPE REGIONAL LENAPE HIGH SCHOOL 05-2610-050 09-12 14.6% 0.4% 13.1% BURLINGTON NORTHERN BURLINGTON REG EASTERN CAMDEN COUNTY CAMDEN REG HADDON HEIGHTS BORO CAMDEN NORTHERN BURLINGTON COUNTY 05-3690-050 09-12 REGIONAL HIGH SCHOOL EASTERN REGIONAL HIGH SCHOOL 07-1255-050 09-12 11.7% 0.4% 15.1% 10.9% 0.5% 11.3% HADDON HEIGHTS JR-SR HS 07-1880-050 07-12 16.4% 0.0% 11.4% CAMDEN HADDON TWP HADDON TOWNSHIP HIGH SCHOOL 07-1890-050 09-12 14.1% 0.8% 14.6% CAPE MAY OCEAN CITY OCEAN CITY HIGH SCHOOL 09-3780-050 09-12 18.0% 0.1% 13.2% ESSEX MONTCLAIR TOWN MONTCLAIR HIGH SCHOOL 13-3310-050 09-12 20.1% 0.3% 16.6% KINGSWAY REGIONAL HIGH SCHOOL PITMAN HIGH SCHOOL 15-2440-050 09-12 15.7% 0.4% 13.0% 15-4140-050 09-12 17.0% 0.0% 16.1% 16.4% 0.0% 14.2% 10.7% 0.7% 11.4% GLOUCESTER KINGSWAY REGIONAL GLOUCESTER PITMAN BORO GLOUCESTER WASHINGTON TWP MIDDLESEX SOUTH BRUNSWICK TWP WASHINGTON TOWNSHIP HIGH 15-5500-010 09-12 SCHOOL SOUTH BRUNSWICK HIGH SCHOOL 23-4860-050 09-12 MIDDLESEX SPOTSWOOD BORO SPOTSWOOD HIGH SCHOOL 23-4970-040 09-12 14.9% 0.5% 12.8% MONMOUTH HAZLET TWP RARITAN HIGH SCHOOL 25-2105-050 09-12 12.3% 0.4% 14.8% MONMOUTH MANASQUAN BORO MANASQUAN HIGH SCHOOL 25-2930-050 09-12 11.1% 0.5% 11.4% MONMOUTH MIDDLETOWN TWP 25-3160-050 09-12 16.8% 0.4% 14.6% MONMOUTH WALL TWP MIDDLETOWN HIGH SCHOOL NORTH WALL HIGH SCHOOL 25-5420-050 09-12 11.5% 0.5% 13.3% MORRIS JEFFERSON TWP 27-2380-020 09-12 12.3% 0.3% 13.9% MORRIS MOUNT OLIVE TWP JEFFERSON TOWNSHIP HIGH SCHOOL MOUNT OLIVE HIGH SCHOOL 27-3450-010 09-12 13.4% 0.7% 15.9% OCEAN BRICK TWP 29-0530-025 09-12 20.0% 0.0% 17.1% OCEAN LACEY TWP BRICK TOWNSHIP MEMORIAL HIGH SCHOOL LACEY TOWNSHIP HIGH SCHOOL 29-2480-020 09-12 20.0% 0.0% 15.7% OCEAN TOMS RIVER REGIONAL TOMS RIVER HIGH SCHOOL EAST 29-5190-030 09-12 16.2% 0.5% 11.4% OCEAN TOMS RIVER REGIONAL TOMS RIVER HIGH SCHOOL NORTH 29-5190-040 09-12 18.0% 0.5% 10.1% PASSAIC LAKELAND REGIONAL 31-2510-050 09-12 15.7% 0.0% 13.5% 31-5650-040 09-12 13.3% 0.2% 20.2% 33-5910-050 09-12 20.3% 0.4% 10.6% 37-3590-050 09-12 16.3% 0.0% 12.1% SUSSEX LAKELAND REGIONAL HIGH SCHOOL WEST MILFORD TWP WEST MILFORD TOWNSHIP HIGH SCHOOL WOODSTOWN-PILESGROVE WOODSTOWN HIGH SCHOOL REG NEWTON TOWN NEWTON HIGH SCHOOL SUSSEX VERNON TWP VERNON TOWNSHIP HIGH SCHOOL 37-5360-020 09-12 15.1% 0.3% 16.0% SUSSEX WALLKILL VALLEY REGIONAL WARREN HILLS REGIONAL WALLKILL VALLEY REGIONAL HIGH SCHOOL WARREN HILLS REGIONAL SCHOOL DISTRICT 37-5435-060 09-12 18.3% 0.1% 18.4% 41-5465-050 09-12 17.1% 0.4% 14.4% PASSAIC SALEM WARREN 12