SlideShare una empresa de Scribd logo
1 de 18
Descargar para leer sin conexión
State of New Jersey
2012-13
OVERVIEW
CAPE MAY
OCEAN CITY

09-3780-060
OCEAN CITY INTERMEDIATE SCHOOL
19TH & BAY AVE
OCEAN CITY, NEW JERSEY 08226
1

GRADE SPAN 04-08

This school's academic performance is high when compared to schools across the state. Additionally, its academic
performance is very high when compared to its peers. This school's college and career readiness lags in comparison to schools
across the state. Additionally, its college and career readiness lags in comparison to its peers. This school's student growth
performance is very high when compared to schools across the state. Additionally, its student growth performance is very high
when compared to its peers.
Performance Areas
Peer Percentile
Improvement Status
Statewide Percentile Percent of
Targets Met
N/A
96
64
90%
Academic Achievement
Rationale
College and Career Readiness

36

27

50%

N/A

96
90
100%
Student Growth
Very High Performance is defined as being equal to or above the 80th percentile.
High Performance is defined as being between the 60th and 79.9th percentiles.
Average Performance is defined as being between the 40th and 59.9th percentiles.
Lagging Performance is defined as being between the 20th and 39.9th percentiles.
Significantly Lagging Performance is defined as being equal to or below the 19.9th percentile.
Peer Schools are schools that have similar grade levels and students with similar demographic characteristics, such as the
percentage of students qualifying for Free/Reduced Lunch, Limited English Proficiency programs or Special Education
programs.
Academic Achievement
This school outperforms 64% of schools statewide as noted
by its statewide percentile and 96% of schools educating
students with similar demographic characteristics as noted in
its peer school percentile in the performance area of
Academic Achievement. Additionally, this school is meeting
90% of its performance targets in the area of Academic
Achievement.

Academic Achievement measures the content knowledge
students have in language arts literacy and math. For
elementary and middle schools, this includes measures of
the school's proficiency rate on both the Language Arts
Literacy and Math sections of the New Jersey Assessment
of Skills and Knowledge (NJ ASK). A proficiency rate is
calculated by summing the count of students who scored
either proficient or advanced proficient on the assessment
and dividing by the count of valid test scores.

College and Career Readiness
This school outperforms 27% of schools statewide as noted
by its statewide percentile and 36% of schools educating
students with similar demographic characteristics as noted in
its peer school percentile in the performance area of College
and Career Readiness. Additionally, this school is meeting
50% of its performance targets in the area of College and
Career Readiness.

College and Career readiness measures the degree to
which students are demonstrating behaviors that are
indicative of future attendance and/or success in college
and careers. For all elementary and middle schools, this
includes a measurement of how many students are
chronically absent. For schools with middle school
grades, it also includes a measurement of how many
students take Algebra I in eighth grade.

Student Growth
This school outperforms 90% of schools statewide as noted
by its statewide percentile and 96% of schools educating
students with similar demographic characteristics as noted in
its peer school percentile in the performance area of Student
Growth. Additionally, this school is meeting 100%
percentage of its performance targets in the area of Student
Growth.

Student Growth measures the performance of students
from one year to the next on the New Jersey
Assessment of Skills and Knowledge (NJ ASK) in
Language Arts Literacy and Math when compared to
students with a similar history of performance on
NJASK.

1
State of New Jersey
2012-13
DEMOGRAPHIC INFORMATION
CAPE MAY
OCEAN CITY

09-3780-060
OCEAN CITY INTERMEDIATE SCHOOL
19TH & BAY AVE
OCEAN CITY, NEW JERSEY 08226

GRADE SPAN 04-08

Language Diversity
This table presents the percentage of students who
primarily speak each language in their home.
2012-13

Percent

English

93.1%

Spanish

6.0%

Chinese

0.2%

German

0.2%

Philippine languages

0.2%

Vietnamese

0.2%

Note: "UG" represents the count of students who are 'on
roll' (FTE) in this school but who are educated in ungraded
classrooms, meaning that the classrooms may contain
students from multiple grade levels.

Total School Enrollment in Full Time Equivalent
2011-12
470
2012-13
487

Enrollment Trends by Program Participation
35

32

31

Percent of Enrollment

30
25
20

23 23

2010-11

19

2011-12

15

15

Enrollment by Gender

2012-13

This graph presents the count of students by gender who were 'on
roll' (FTE) in October of each school year.
280

10
5

1 0 0
DISABILITY

ECONDIS

240

LEP

200

Male

160

0

Female

Current Year Enrollment by Program Participation
2012-2013

Students with Disability
Economically Disadvantaged
Students
Limited English Proficient
Students

Count of
Students

Percentage of
Enrollment

91

19%

155

120
80
40

31.8%

0

0.0%
2

0

2010-11

2010-11
2011-12
2012-13

2011-12

Male
234
235
240

2012-13

Female
247
235
247
2
State of New Jersey
2012-13
ACADEMIC ACHIEVEMENT
CAPE MAY
OCEAN CITY

09-3780-060
OCEAN CITY INTERMEDIATE SCHOOL
19TH & BAY AVE
OCEAN CITY, NEW JERSEY 08226

GRADE SPAN 04-08

Academic Achievement measures the content knowledge students have in language arts literacy and math. In elementary and
middle school, this includes the outcomes of the New Jersey Assessment of Skills and Knowledge (NJASK). The first column Schoolwide Performance - in the table below includes measures of the total schoolwide proficiency rate in both language arts literacy
and math. The second column - Peer School Percentile - indicates where the school’s proficiency rate compares to its group of peer
schools. For example, a school that has a peer school percentile rank of 65 has a proficiency rate that is higher than 65% of its peer
schools. The third column - Statewide Percentile - indicates where the school’s proficiency rate compares to schools across the state.
For example, a school that has a statewide percentile of 30 has a proficiency rate that is higher than 30% of all schools with NJASK
scores statewide. The last column - Percent of Targets Met - presents the percentage of progress targets met as defined by the
NJDOE’s NCLB waiver.
The Summary row presents the averages of the peer school percentiles, the average of statewide percentiles and the percentage
of statewide targets met.
Peer
Percentile

Schoolwide
Performance

Academic Achievement Indicators

State
Percentile

Percent of Targets
Met

NJASK Language Arts Proficiency and above

72%

91

52

80%

NJASK Math Proficiency and above

83%

100

75

100%

SUMMARY - Academic Achievement
NCLB Progress Targets - Language Arts Literacy

96

This table presents the Progress Targets as uniquely calculated for each
subgroup in each school under NJDOE’s NCLB waiver. The methodology
- as defined by the United States Department of Education - is calculated so
that each subgroup will halve the gap between their 2011 proficiency rate
and 100% proficiency by 2017.
Subgroups
Total Valid
Pass
Target Met
Scores
Rate
Target?
Schoolwide
402
71.9
76.4
NO

64
90%
Proficiency Trends - Language Arts Literacy

This graph presents the percentage of students who scored in
the Advanced Proficient, Proficient and Partially Proficient
categories of the statewide Language Arts Literacy assessment
over the prior four years.

White

317

77

Black

-

-

46

47.8

American Indian

-

-

--

Asian

-

-

--

40

Two or More Races

-

-

--

20

74

44.6

YES*

0

Hispanic

Students with Disability

80.1

YES*

100

--

11

11

11

7

59

61

59

64

30

28

30

28

2009-10

2010-11

2011-12

2012-13

Advanced Proficient

Proficient

80

61.7

54.4

YES*

Limited English Proficient
-Students
Economically
129
53.5
59.5
YES*
Disadvantaged Students
YES* = Met Progress Target(Confidence Interval Applied)
Data is presented for subgroups when the count is high enough under
NCLB suppression rules.

60

Partially Proficient

3
State of New Jersey
2012-13
ACADEMIC ACHIEVEMENT
CAPE MAY
OCEAN CITY

09-3780-060
OCEAN CITY INTERMEDIATE SCHOOL
19TH & BAY AVE
OCEAN CITY, NEW JERSEY 08226

GRADE SPAN 04-08

NCLB Progress Targets - Math

Proficiency Trends - Math

This table presents the Progress Targets as uniquely calculated for each
subgroup in each school under NJDOE’s NCLB waiver. The methodology
- as defined by the United States Department of Education - is calculated so
that each subgroup will halve the gap between their 2011 proficiency rate
and 100% proficiency by 2017.
Subgroups
Total Valid Pass
Target Met
Scores
Rate
Target?
Schoolwide

402

83

84.4

YES*

White

317

87

88.1

YES*

Black

-

-

46

69.6

American Indian

-

-

--

Asian

-

-

--

Two or More Races

-

-

This graph presents the percentage of students who scored in
the Advanced Proficient, Proficient and Partially Proficient
categories of the statewide Math assessment over the prior four
years.

--

Hispanic

100

72.2

80

YES*

32

35

41

40

46

46

40

43

21

--

19

19

17

2009-10

2010-11

2011-12

2012-13

Advanced Proficient

Proficient

60
40
20

Students with Disability

74

62.2

62.5

YES*

Limited English Proficient
-Students
Economically
129
72.1
69.5 YES
Disadvantaged Students
YES* = Met Progress Target(Confidence Interval Applied)

0

Partially Proficient

Data is presented for subgroups when the count is high enough under
NCLB suppression rules.

4
State of New Jersey
2012-13
ACADEMIC ACHIEVEMENT
CAPE MAY
OCEAN CITY

09-3780-060
OCEAN CITY INTERMEDIATE SCHOOL
19TH & BAY AVE
OCEAN CITY, NEW JERSEY 08226

GRADE SPAN 04-08

NJASK Results - Language Arts Literacy Grade Level - 04
This table presents the grade level proficiency results, as measured by
NJASK, in Advanced Proficient, Proficient, and Partially Proficient
categories for all appropriate subgroups.
Advanced Proficient Partially
Subgroups
Proficient
Proficient
Schoolwide
9%
51%
40%
White

10%

57%

33%

Black

-

-

-

0%

33%

67%

American Indian

-

-

-

Asian

-

-

-

-

-

11%

37%

53%

-

-

This graph presents the grade level outcomes in the categories
of Advanced Proficient, Proficient, and Partially Proficient
over the last four years.

-

Two or More Races

NJASK Proficiency Trends - Language Arts Literacy Grade Level - 04

-

Hispanic

Students with Disability
Limited English Proficient Students

Economically Disadvantaged
0%
32%
68%
Students
Data is presented for subgroups when the count is high enough under
NCLB suppression rules.

NJASK Results - Language Arts Literacy Grade Level - 05
This table presents the grade level proficiency results, as measured by
NJASK, in Advanced Proficient, Proficient, and Partially Proficient
categories for all appropriate subgroups.
Advanced Proficient Partially
Subgroups
Proficient
Proficient
Schoolwide
3%
59%
39%
White

3%

62%

34%

Black

-

-

-

Hispanic

-

-

-

American Indian

-

-

-

Asian

-

-

-

-

-

0%

27%

73%

-

-

4

5

9

62

51

80
46
60
40
50

20
0

40

33
2009-10

2010-11

Advanced Proficient

2012-13

Proficient

Partially Proficient

NJASK Proficiency Trends - Language Arts Literacy Grade Level - 05
This graph presents the grade level outcomes in the categories
of Advanced Proficient, Proficient, and Partially Proficient
over the last four years.

-

Two or More Races

100

-

Students with Disability
Limited English Proficient Students

Economically Disadvantaged
0%
43%
57%
Students
Data is presented for subgroups when the count is high enough under
NCLB suppression rules.

100

4

80
51

1

3

3

62

59

34

39

2011-12

2012-13

48

60
40
20
0

45

51

2009-10

2010-11

Advanced Proficient

Proficient

Partially Proficient

5
State of New Jersey
2012-13
ACADEMIC ACHIEVEMENT
CAPE MAY
GRADE SPAN 04-08
OCEAN CITY
NJASK Results - Language Arts Literacy Grade Level - 06
This table presents the grade level proficiency results, as measured by
NJASK, in Advanced Proficient, Proficient, and Partially Proficient
categories for all appropriate subgroups.
Advanced Proficient Partially
Subgroups
Proficient
Proficient
Schoolwide
5%
71%
24%
White

6%

82%

12%

Black

-

-

-

0%

38%

62%

Hispanic
American Indian

-

-

-

Asian

-

-

-

-

-

0%

47%

53%

-

-

This graph presents the grade level outcomes in the categories
of Advanced Proficient, Proficient, and Partially Proficient
over the last four years.

100

2

4

69

67

4

5

80
50

-

Two or More Races

09-3780-060
OCEAN CITY INTERMEDIATE SCHOOL
19TH & BAY AVE
OCEAN CITY, NEW JERSEY 08226
NJASK Proficiency Trends - Language Arts Literacy Grade Level - 06

-

Students with Disability
Limited English Proficient Students

Economically Disadvantaged
0%
45%
55%
Students
Data is presented for subgroups when the count is high enough under
NCLB suppression rules.

NJASK Results - Language Arts Literacy Grade Level - 07
This table presents the grade level proficiency results, as measured by
NJASK, in Advanced Proficient, Proficient, and Partially Proficient
categories for all appropriate subgroups.
Advanced Proficient Partially
Subgroups
Proficient
Proficient
Schoolwide
13%
59%
28%
White

13%

60%

28%

Black

-

-

-

Hispanic

-

-

-

American Indian

-

-

-

Asian

-

-

-

-

-

0%

36%

64%

-

-

71

40
20
0

46
28

29

2009-10

2010-11

Advanced Proficient

24
2011-12

2012-13

Proficient

Partially Proficient

NJASK Proficiency Trends - Language Arts Literacy Grade Level - 07
This graph presents the grade level outcomes in the categories
of Advanced Proficient, Proficient, and Partially Proficient
over the last four years.

-

Two or More Races

60

-

Students with Disability
Limited English Proficient Students

Economically Disadvantaged
8%
52%
40%
Students
Data is presented for subgroups when the count is high enough under
NCLB suppression rules.

100
14

12

16

13

60

60

55

59

26

28

28

28

2009-10

2010-11

2011-12

2012-13

80
60
40
20
0

Advanced Proficient

Proficient

Partially Proficient

6
State of New Jersey
2012-13
09-3780-060
OCEAN CITY INTERMEDIATE SCHOOL
19TH & BAY AVE
OCEAN CITY, NEW JERSEY 08226
NJASK Proficiency Trends - Language Arts Literacy Grade Level - 08

ACADEMIC ACHIEVEMENT
CAPE MAY
GRADE SPAN 04-08
OCEAN CITY
NJASK Results - Language Arts Literacy Grade Level - 08
This table presents the grade level proficiency results, as measured by
NJASK, in Advanced Proficient, Proficient, and Partially Proficient
categories for all appropriate subgroups.
Advanced Proficient Partially
Subgroups
Proficient
Proficient
Schoolwide
8%
83%
9%
White

10%

Black

83%

This graph presents the grade level outcomes in the categories
of Advanced Proficient, Proficient, and Partially Proficient
over the last four years.

100

7%

-

-

-

Hispanic

-

-

-

American Indian

-

-

-

Asian

-

-

Two or More Races

-

-

-

0%

62%

38%

-

-

-

26

-

Students with Disability
Limited English Proficient Students

80

29

8

21

60
40

83

66

64

65

7
2009-10

8
2010-11

20
0

Economically Disadvantaged
0%
91%
9%
Students
Data is presented for subgroups when the count is high enough under
NCLB suppression rules.

Advanced Proficient

14

9

2011-12

2012-13

Proficient

Partially Proficient

2013 National Assessment Educational Progress (NAEP)
The National Assessment of Educational Progress (NAEP) is the largest national assessment of what our nation’s students know and
can do. NAEP assesses fourth-, eighth-, and twelfth-grade students in subjects such as reading, mathematics, science, and writing. The
reporting of NAEP scores on state report cards is a federal mandate. The results of NAEP are also published as the Nation’s Report
Card, and are available for the nation, states, and, in some cases, urban districts. The NAEP scores on the report card include grades
four and eight 2013 reading and math scores for New Jersey which are the last scores published. For subgroup outcomes, visit :
http://www.nj.gov/education/pr/1213/naep/naep4read.html For more information, visit <http://nces.ed.gov/nationsreportcard/>

Grade 4 Reading

State/Nation

Below Basic

Proficiency Percentages
Basic
Proficient

Advanced

All Students

State (NJ)

25

33

30

12

All Students

Nation

32

33

27

8

2013 National Assessment Educational Progress (NAEP)
The National Assessment of Educational Progress (NAEP) is the largest national assessment of what our nation’s students know and
can do. NAEP assesses fourth-, eighth-, and twelfth-grade students in subjects such as reading, mathematics, science, and writing. The
reporting of NAEP scores on state report cards is a federal mandate. The results of NAEP are also published as the Nation’s Report
Card, and are available for the nation, states, and, in some cases, urban districts. The NAEP scores on the report card include grades
four and eight 2013 reading and math scores for New Jersey which are the last scores published. For subgroup outcomes, visit :
http://www.nj.gov/education/pr/1213/naep/naep8read.html
For more information, visit <http://nces.ed.gov/nationsreportcard/>

Grade 8 Reading
All Students

State/Nation
State (NJ)

All Students

Nation

Below Basic
15
22

Proficiency Percentages
Basic
Proficient
39
40
42

32

Advanced
7
4

7
State of New Jersey
2012-13
ACADEMIC ACHIEVEMENT
CAPE MAY
OCEAN CITY

09-3780-060
OCEAN CITY INTERMEDIATE SCHOOL
19TH & BAY AVE
OCEAN CITY, NEW JERSEY 08226

GRADE SPAN 04-08

NJASK Proficiency Trends - Math - Grade Level - 04

NJASK Results - MATH Grade Level - 04

This table presents the grade level proficiency results, as measured by
NJASK, in Advanced Proficient, Proficient, and Partially Proficient
This graph presents the grade level outcomes in the categories
categories for all appropriate subgroups.
of Advanced Proficient, Proficient, and Partially Proficient
Advanced
Partially over the last four years.
Proficient
Proficient
Proficient
Subgroups
Schoolwide
45%
38%
17%
White

53%

35%

12%

Black

-

-

-

13%

53%

33%

American Indian

-

-

-

Asian

-

-

-

40

Two or More Races

-

-

-

20

32%

53%

16%

-

-

-

14%

55%

32%

Hispanic

Students with Disability
Limited English Proficient Students
Economically Disadvantaged Students

100
80

32

37

45

60
49

46

38

19
0

17

17

2009-10

2010-11

2012-13

Advanced Proficient

Proficient

Partially Proficient

Data is presented for subgroups when the count is high enough under
NCLB suppression rules.

NJASK Results - MATH Grade Level - 05

NJASK Proficiency Trends - Math - Grade Level - 05

This table presents the grade level proficiency results, as measured by
NJASK, in Advanced Proficient, Proficient, and Partially Proficient
This graph presents the grade level outcomes in the categories
categories for all appropriate subgroups.
of Advanced Proficient, Proficient, and Partially Proficient
Advanced
Partially over the last four years.
Proficient
Proficient
Proficient
Subgroups
Schoolwide
48%
40%
12%
White

48%

46%

7%

Black

-

-

-

Hispanic

-

-

-

American Indian

-

-

-

Asian

-

-

-

40

Two or More Races

-

-

-

20

27%

27%

45%

-

-

-

39%

32%

29%

Students with Disability
Limited English Proficient Students
Economically Disadvantaged Students

100
80

32

38

46

48

40

40

16

14

12

2010-11

2011-12

2012-13

60

0

42

26
2009-10

46

Advanced Proficient

Proficient

Partially Proficient

Data is presented for subgroups when the count is high enough under
NCLB suppression rules.
8
State of New Jersey
2012-13
ACADEMIC ACHIEVEMENT
CAPE MAY
GRADE SPAN 04-08
OCEAN CITY
NJASK Results - MATH Grade Level - 06

09-3780-060
OCEAN CITY INTERMEDIATE SCHOOL
19TH & BAY AVE
OCEAN CITY, NEW JERSEY 08226
NJASK Proficiency Trends - Math - Grade Level - 06

This table presents the grade level proficiency results, as measured by
NJASK, in Advanced Proficient, Proficient, and Partially Proficient
This graph presents the grade level outcomes in the categories
categories for all appropriate subgroups.
of Advanced Proficient, Proficient, and Partially Proficient
Advanced
Partially over the last four years.
Proficient
Proficient
Proficient
Subgroups
Schoolwide
37%
51%
13%
White

45%

47%

8%

Black

-

-

-

15%

69%

15%

American Indian

-

-

-

Asian

-

-

-

40

Two or More Races

-

-

-

20

18%

47%

35%

-

-

-

19%

55%

26%

Hispanic

Students with Disability
Limited English Proficient Students
Economically Disadvantaged Students

100
80

30

27

56

57

46

15

16

20

2009-10

2010-11

2011-12

34

37

60

0

Advanced Proficient

51

13
2012-13

Proficient

Partially Proficient

Data is presented for subgroups when the count is high enough under
NCLB suppression rules.

NJASK Results - MATH Grade Level - 07

NJASK Proficiency Trends - Math - Grade Level - 07

This table presents the grade level proficiency results, as measured by
NJASK, in Advanced Proficient, Proficient, and Partially Proficient
This graph presents the grade level outcomes in the categories
categories for all appropriate subgroups.
of Advanced Proficient, Proficient, and Partially Proficient
Advanced
Partially over the last four years.
Proficient
Proficient
Proficient
Subgroups
Schoolwide
33%
41%
27%
White

32%

44%

24%

Black

-

-

-

Hispanic

-

-

-

American Indian

-

-

-

100
80
60

Asian

-

-

-

-

-

-

20

14%

21%

64%

-

-

-

24%

40%

36%

42

28

27

33

47

46

41

24

27

27

2010-11

2011-12

2012-13

40

Two or More Races

26

Students with Disability
Limited English Proficient Students
Economically Disadvantaged Students

0

32
2009-10

Advanced Proficient

Proficient

Partially Proficient

Data is presented for subgroups when the count is high enough under
NCLB suppression rules.
9
State of New Jersey
2012-13
ACADEMIC ACHIEVEMENT
CAPE MAY
GRADE SPAN 04-08
OCEAN CITY
NJASK Results - MATH Grade Level - 08

09-3780-060
OCEAN CITY INTERMEDIATE SCHOOL
19TH & BAY AVE
OCEAN CITY, NEW JERSEY 08226
NJASK Proficiency Trends - Math - Grade Level - 08

This table presents the grade level proficiency results, as measured by
NJASK, in Advanced Proficient, Proficient, and Partially Proficient
This graph presents the grade level outcomes in the categories
categories for all appropriate subgroups.
of Advanced Proficient, Proficient, and Partially Proficient
Advanced
Partially over the last four years.
Proficient
Proficient
Proficient
Subgroups
Schoolwide
39%
45%
16%
White

43%

43%

14%

Black

-

-

-

100
80

39

-

-

-

-

-

Asian

-

-

-

-

-

-

54%

38%

-

-

-

30%

52%

38

19

18

16

2009-10

2010-11

2011-12

2012-13

17%

53

20

8%

43

40

Two or More Races

43

-

American Indian

41

16

Hispanic

Students with Disability
Limited English Proficient Students
Economically Disadvantaged Students

60

0

29

Advanced Proficient

45

Proficient

Partially Proficient

Data is presented for subgroups when the count is high enough under
NCLB suppression rules.

2013 National Assessment Educational Progress (NAEP)
The National Assessment of Educational Progress (NAEP) is the largest national assessment of what our nation’s students know and can
do. NAEP assesses fourth-, eighth-, and twelfth-grade students in subjects such as reading, mathematics, science, and writing. The
reporting of NAEP scores on state report cards is a federal mandate. The results of NAEP are also published as the Nation’s Report Card,
and are available for the nation, states, and, in some cases, urban districts. The NAEP scores on the report card include grades four and
eight 2013 reading and math scores for New Jersey which are the last scores published. For subgroup outcomes, visit :
http://www.nj.gov/education/pr/1213/naep/naep4math.html For more information, visit <http://nces.ed.gov/nationsreportcard/>

Grade 4 Math

State/Nation

Proficiency Percentages

Below Basic

Basic

Proficient Advanced

All Students

State (NJ)

13

38

39

10

All Students

Nation

17

41

34

8

2013 National Assessment Educational Progress (NAEP)
The National Assessment of Educational Progress (NAEP) is the largest national assessment of what our nation’s students know and can
do. NAEP assesses fourth-, eighth-, and twelfth-grade students in subjects such as reading, mathematics, science, and writing. The
reporting of NAEP scores on state report cards is a federal mandate. The results of NAEP are also published as the Nation’s Report Card,
and are available for the nation, states, and, in some cases, urban districts. The NAEP scores on the report card include grades four and
eight 2013 reading and math scores for New Jersey which are the last scores published.For subgroup outcomes, visit :
http://www.nj.gov/education/pr/1213/naep/naep8math.html For more information, visit <http://nces.ed.gov/nationsreportcard/>

Grade 8 Math

State/Nation

Proficiency Percentages

Below Basic

Basic

Proficient Advanced

All Students

State (NJ)

18

34

33

16

All Students

Nation

26

38

27

9
10
State of New Jersey
2012-13
ACADEMIC ACHIEVEMENT
CAPE MAY
OCEAN CITY

GRADE SPAN 04-08

NJASK Results - Science Grade Level - 04
This table presents the grade level proficiency results, as measured by
3
NJASK, in Advanced Proficient, Proficient, and Partially Proficient
categories for all appropriate subgroups.
Advanced
Partially
Proficient
Subgroups
Proficient
Proficient
Schoolwide
55%
35%
10%

09-3780-060
OCEAN CITY INTERMEDIATE SCHOOL
19TH & BAY AVE
OCEAN CITY, NEW JERSEY 08226
NJASK Proficiency Trends - Science - Grade Level - 04
This graph presents the grade level outcomes in the categories
of Advanced Proficient, Proficient, and Partially Proficient
over the last four years.

100

White

63%

27%

10%

Black

-

-

-

33%

53%

13%

60

American Indian

-

-

-

40

Asian

-

-

-

Two or More Races

-

-

-

Hispanic

Students with Disability

47%

37%

16%

80

39

55

61

58

0

Limited English Proficient
Students
Economically Disadvantaged
32%
50%
18%
Students
Data is presented for subgroups when the count is high enough under
NCLB suppression rules.

35

31

20

10
2012-13

8
2010-11

3
2009-10

Advanced Proficient

Proficient

Partially Proficient

NJASK Results - Science Grade Level - 08

NJASK Proficiency Trends - Science - Grade Level - 08

This table presents the grade level proficiency results, as measured by
NJASK, in Advanced Proficient, Proficient, and Partially Proficient
categories for all appropriate subgroups.
Advanced
Partially
Proficient
Subgroups
Proficient
Proficient
Schoolwide
35%
53%
12%

This graph presents the grade level outcomes in the categories
of Advanced Proficient, Proficient, and Partially Proficient
over the last four years.

100

White

41%

52%

7%

Black

-

-

-

Hispanic

-

-

-

60

American Indian

-

-

-

40

Asian

-

-

-

Two or More Races

-

-

80

-

Students with Disability

23%

54%

23%

Limited English Proficient
Students
Economically Disadvantaged
30%
52%
17%
Students
Data is presented for subgroups when the count is high enough under
NCLB suppression rules.

20
0

49

38

49

35

53

53

40

9
2010-11

12

12

2011-12

2012-13

Advanced Proficient

Proficient

45
5
2009-10

Partially Proficient

11
State of New Jersey
2012-13
COLLEGE AND CAREER READINESS
CAPE MAY
OCEAN CITY

09-3780-060
OCEAN CITY INTERMEDIATE SCHOOL
19TH & BAY AVE
OCEAN CITY, NEW JERSEY 08226

GRADE SPAN 04-08

Students in both elementary and middles schools begin to demonstrate college readiness behaviors long before they even enter
high school. Among the behaviors that research has shown to be indicative of success and college and career readiness are regularly
attending school and challenging themselves with rigorous course work. First, the table presents the percentage of students, as
measured against the school’s enrollment in eighth grade, who were reported via NJSMART as being enrolled in Algebra I. The table
also presents the percentage of students who were chronically absent during the prior school year. A chronically absent student is a
student who was not present for any reason for more than 10% of the total days possible for that individual student.
The first column - Schoolwide Performance - represents the outcomes for these particular indicators in this school. The second
column - Peer School Percentile - indicates how the school’s performance compares to its group of peer schools. For example, a school
whose peer school is 65 in Algebra I Enrollment has a higher Algebra I Enrollment than 65% of its peer group. The third column Statewide Percentile - indicates how the school’s performance compares to schools across the state. The fourth column - Statewide
Target - provides the statewide targets for each of these indicators. The last column - Met Target? - indicates whether the School
Performance met or exceeded the statewide target.
The Summary row presents the averages of the peer school percentiles, the average of statewide percentiles and the percentage
of statewide targets met.

College and Career Readiness
Indicators

School
Performance

Peer
Percentile

Students taking Algebra (%)

25%

65

51

20%

YES

Chronic Absenteeism (%)

30%

6

3

6%

NO

36

27

Summary

Statewide
Percentile

Met Target?

50%

Algebra I

Absenteeism

This table presents the percentage of eighth graders who
were reported in the Algebra I course code in NJSMART
and the percentage of those students who earned a C or
higher in the course.
2012-13

Statewide
Target

School
25%

Algebra grade (C or better)

95%

40

38

35
30

Percent Absent

Students taking Algebra I

The chart below presents the percentage of students who were
absent in each category of absence: 0 absences, 1- 5 absences,
6 - 10 absences, 11 - 15 absences, and more than 15 absences.
An absence is defined as being ‘not present’ and includes the
days missed regardless of whether they were determined to be
excused or unexcused by the school.

25

22

20

20

19

15
10
5
0

2
0 Absences

1-5 Absences

6-10 Absences 11-15 Absences 15+ Absences

Absences

0 Absences

1-5 Absences

11-15 Absences

6-10 Absences

15+ Absences

12
State of New Jersey
2012-13
STUDENT GROWTH
CAPE MAY
OCEAN CITY

09-3780-060
OCEAN CITY INTERMEDIATE SCHOOL
19TH & BAY AVE
OCEAN CITY, NEW JERSEY 08226

GRADE SPAN 04-08

This section of the performance report presents data about student growth, utilizing the Student Growth Percentile
Methodology (SGP). SGP creates a measure of how students progressed in grades 4 through 8 in NJ ASK Language Arts
Literacy and Math when compared to other students with a similar NJ ASK test score history. A short video explaining the
methodology can be found here: http://www.state.nj.us/education/njsmart/performance/
The first column - Schoolwide Performance - presents the schoolwide median growth score in either Language Arts 5
Literacy or Math for all students in the school. The second column - Peer Percentile - indicates how the school’s growth
performance compares to its group of peer schools. The third column - Statewide Percentile - indicates how a school compares
to schools across the state. The last column - Met Target? - indicates whether the school’s performance met or exceeded the
target.
The summary row presents the averages of the peer school percentiles, the averages of statewide percentiles, the
percentage of statewide targets met.
Student Growth Indicators

Schoolwide
Performance

Peer
Percentile

Statewide
Target

Statewide
Percentile

Met Target?

Student Growth on Language Arts

58

97

87

35

YES

Student Growth on Math

63

94

92

35

YES

96

90

100%

Student Growth
This table presents for all students with growth scores the interaction between their proficiency level on NJASK and their growth
scores. For example, in the top left cell the percentage of students who are both partially proficient AND also demonstrating low
growth is displayed.

Language Arts

Math

GROWTH
Low

Typical

GROWTH
Low

Typical

6%

Partially
Proficient

8%

5%

4%

21%

31%

Proficient

13%

13%

17%

2%

5%

Advanced
Proficient

3%

10%

27%

Partially
Proficient

15%

7%

Proficient

14%

Advanced
Proficient

0%

High

High

Low Growth is defined as an Student Growth Percentile score less than 35.
Typical Growth is defined as an Student Growth Percentile score between 35 and 65.
High Growth is defined as a Student Growth Percentile score higher than 65.

13
State of New Jersey
2012-13
WITHIN SCHOOL ACHIEVEMENT GAP
CAPE MAY
OCEAN CITY

09-3780-060
OCEAN CITY INTERMEDIATE SCHOOL
19TH & BAY AVE
OCEAN CITY, NEW JERSEY 08226

GRADE SPAN 04-08

This section of the performance report presents data about the achievement gap that exists within a school - as measured
by the difference between the students’ scale scores at the 25th and 75th percentile in the school, the so-called Interquartile
Range (IQR). Taken together with an understanding of the overall and average achievement levels in the school, the IQR furthers
an understanding of the range of student outcomes that exist in a school. A school gap smaller than the state gap indicates that
the school’s range of student outcomes is narrower than the state’s while a school gap larger than the state gap indicates that the
school’s range of student outcomes is larger than the state’s.

Grade Level - 04

Grade Level - 04

NJ ASK Language Arts 25th %ile vs 75th%ile
This table presents the scale scores associated with students
at the bottom (0th percentile), the 25th percentile, the 50th
percentile, the 75th percentile and the top (99th percentile)
of school's distribution.
Percentile

School Scale Score

State Scale Score

NJ ASK Math 25th %ile vs 75th%ile
This table presents the scale scores associated with students
at the bottom (0th percentile), the 25th percentile, the 50th
percentile, the 75th percentile and the top (99th percentile) of
school's distribution.
Percentile

School Scale Score

State Scale Score

99th

259

300

99th

300

300

75th

225

225

75th

271

260

50th

206

206

50th

239

229

25th

186

183

25th

205

201

0th

132

100

0th

106

100

Scale Score Gap - Scale Score Gap School
State
25th vs 75th Gap

39

Scale Score Gap - Scale Score Gap School
State
25th vs 75th Gap

42

Grade Level - 05

School Scale Score

59

Grade Level - 05

NJ ASK Language Arts 25th %ile vs 75th%ile
This table presents the scale scores associated with students
at the bottom (0th percentile), the 25th percentile, the 50th
percentile, the 75th percentile and the top (99th percentile)
of school's distribution.
Percentile

66

State Scale Score

NJ ASK Math 25th %ile vs 75th%ile
This table presents the scale scores associated with students
at the bottom (0th percentile), the 25th percentile, the 50th
percentile, the 75th percentile and the top (99th percentile) of
school's distribution.
Percentile

School Scale Score

State Scale Score

99th

252

300

99th

300

300

75th

221

224

75th

278

268

50th

202

205

50th

248

237

25th

190

187

25th

226

205

0th

151

100

0th

143

100

Scale Score Gap - Scale Score Gap School
State
25th vs 75th Gap

31

37

Scale Score Gap - Scale Score Gap School
State
25th vs 75th Gap

52

63

14
State of New Jersey
2012-13
WITHIN SCHOOL ACHIEVEMENT GAP
CAPE MAY
OCEAN CITY

09-3780-060
OCEAN CITY INTERMEDIATE SCHOOL
19TH & BAY AVE
OCEAN CITY, NEW JERSEY 08226

GRADE SPAN 04-08

Grade Level - 06

Grade Level - 06

NJ ASK Language Arts 25th %ile vs 75th%ile
This table presents the scale scores associated with students
at the bottom (0th percentile), the 25th percentile, the 50th
percentile, the 75th percentile and the top (99th percentile)
of school's distribution.
Percentile

School Scale Score

State Scale Score

NJ ASK Math 25th %ile vs 75th%ile
This table presents the scale scores associated with students
at the bottom (0th percentile), the 25th percentile, the 50th
percentile, the 75th percentile and the top (99th percentile) of
school's distribution.
Percentile

School Scale Score

State Scale Score

99th

257

300

99th

300

300

75th

228

225

75th

261

252

50th

214

209

50th

236

225

25th

197

191

25th

213

201

0th

162

100

0th

137

100

Scale Score Gap - Scale Score Gap State
School
25th vs 75th Gap

31

Scale Score Gap - Scale Score Gap State
School
25th vs 75th Gap

34

Grade Level - 07

School Scale Score

51

Grade Level - 07

NJ ASK Language Arts 25th %ile vs 75th%ile
This table presents the scale scores associated with students
at the bottom (0th percentile), the 25th percentile, the 50th
percentile, the 75th percentile and the top (99th percentile)
of school's distribution.
Percentile

48

State Scale Score

NJ ASK Math 25th %ile vs 75th%ile
This table presents the scale scores associated with students
at the bottom (0th percentile), the 25th percentile, the 50th
percentile, the 75th percentile and the top (99th percentile) of
school's distribution.
Percentile

School Scale Score

State Scale Score

99th

264

300

99th

300

300

75th

235

231

75th

251

250

50th

214

211

50th

220

213

25th

200

189

25th

197

183

0th

140

100

0th

151

100

Scale Score Gap - Scale Score Gap School
State
25th vs 75th Gap

35

42

Scale Score Gap - Scale Score Gap School
State
25th vs 75th Gap

54

67

15
State of New Jersey
2012-13
WITHIN SCHOOL ACHIEVEMENT GAP
CAPE MAY
OCEAN CITY

09-3780-060
OCEAN CITY INTERMEDIATE SCHOOL
19TH & BAY AVE
OCEAN CITY, NEW JERSEY 08226

GRADE SPAN 04-08

Grade Level - 08

Grade Level - 08

NJ ASK Language Arts 25th %ile vs 75th%ile
This table presents the scale scores associated with students
at the bottom (0th percentile), the 25th percentile, the 50th
percentile, the 75th percentile and the top (99th percentile)
of school's distribution.
Percentile

School Scale Score

State Scale Score

NJ ASK Math 25th %ile vs 75th%ile
This table presents the scale scores associated with students
at the bottom (0th percentile), the 25th percentile, the 50th
percentile, the 75th percentile and the top (99th percentile) of
school's distribution.
Percentile

School Scale Score

State Scale Score

99th

266

300

99th

300

300

75th

236

236

75th

260

255

50th

224

220

50th

233

219

25th

213

205

25th

207

188

0th

173

100

0th

154

100

Scale Score Gap - Scale Score Gap State
School
25th vs 75th Gap

23

31

Scale Score Gap - Scale Score Gap State
School
25th vs 75th Gap

53

67

16
State of New Jersey
2012-13
SCHOOL CLIMATE
CAPE MAY
OCEAN CITY

09-3780-060
OCEAN CITY INTERMEDIATE SCHOOL
19TH & BAY AVE
OCEAN CITY, NEW JERSEY 08226

GRADE SPAN 04-08

Length of School Day

Instructional Time

This table presents the amount of time a
school is in session for a typical student on a
normal school day.

7

This table presents the amount of time
that a typical student is engaged in
instructional
activities
under
the
supervision of a certified teacher.

School

2012-13

School

6 Hrs. 40 Mins.

Full Time

6 Hrs. 10 Mins.

Shared Time

2012-13

0 Hrs. 0 Mins.

Student Suspension Rate
This table presents the percentage of students
who were suspended one or more times
during the school year.

Student Expulsions
This table presents the number of students
who were expelled from the school and
district during the school year.

School
2012-13

1.2%

School
2012-13

0

Student to Staff Ratio
This table presents the count of students per
faculty member or administrator in the school.
All staff are counted in full-time equivalents.

2012-13

School

Faculty

9

Administrators

487

17
OCEAN CITY INTERMEDIATE SCHOOL
09-3780-060
SCHOOL PEER GROUP
This table presents the list of peer schools in alphabetical order by county name that was created specifically for this school
(highlighted in yellow). Peer schools are drawn from across the state and represent schools that have similar grade configurations
and that are educating students of similar demographic characteristics, as measured by enrollment in Free/Reduced Lunch
Programs, Limited English Proficiency or Special Education Programs.

ATLANTIC

EGG HARBOR TWP

ALDER AVENUE MIDDLE SCHOOL

CDS
GRAD
CODE ESPAN FRPL LEP
01-1310-038 06-08 45.2% 1.6%

ATLANTIC

FOLSOM BORO

FOLSOM ELEMENTARY SCHOOL

01-1540-050 PK-08 35.3% 0.2%

16.2%

ATLANTIC

HAMMONTON TOWN

HAMMONTON MIDDLE SCHOOL

01-1960-060 06-08

38.3% 1.5%

17.9%

ATLANTIC

SOMERS POINT CITY

01-4800-055 KG-08 55.5% 4.0%

14.2%

BERGEN

ELMWOOD PARK

JORDAN ROAD ELEMENTARY
SCHOOL
MEMORIAL MIDDLE SCHOOL

03-1345-060 06-08

43.2% 2.6%

17.5%

BERGEN

MOONACHIE BORO

ROBERT L. CRAIG SCHOOL

03-3350-060 PK-08 47.4% 2.1%

14.4%

BERGEN

TEANECK TWP

THOMAS JEFFERSON MIDDLE
03-5150-070 05-08
SCHOOL
SAMUEL M RIDGWAY MIDDLE
05-1280-070 05-08
SCHOOL
FLORENCE RIVERFRONT SCHOOL 05-1520-055 04-08

40.6% 1.4%

19.4%

41.4% 1.9%

14.7%

36.8% 0.3%

12.7%

BELL OAKS UPPER ELEMENTARY
SCHOOL
MERCHANTVILLE ELEMENTARY
SCHOOL
MARY E. VOLZ ELEMENTARY
SCHOOL
OCEAN CITY INTERMEDIATE
SCHOOL
HOPEWELL CREST

45.5% 2.5%

16.8%

07-3110-060 PK-08 34.0% 0.0%

13.1%

07-4590-040 PK-08 38.2% 0.8%

16.3%

09-3780-060 04-08

31.8% 0.0%

18.7%

11-2270-060 KG-08 31.8% 0.8%

22.1%

MYRON L. POWELL ELEMENTARY 11-2570-030 PK-08 56.2% 3.4%
SCHOOL
WILLIAMSTOWN MIDDLE SCHOOL 15-3280-110 05-08 33.7% 0.2%

10.5%

12.2%

COUNTY NAME

DISTRICT NAME

BURLINGTON EDGEWATER PARK TWP
BURLINGTON FLORENCE TWP
CAMDEN

BELLMAWR BORO

CAMDEN

MERCHANTVILLE BORO

CAMDEN

RUNNEMEDE BORO

CAPE MAY

OCEAN CITY

CUMBERLAND HOPEWELL TWP
CUMBERLAND LAWRENCE TWP
GLOUCESTER MONROE TWP

SCHOOL NAME

07-0260-015 05-08

HUDSON

JERSEY CITY

RAFAEL DE J. CORDERO SCHOOL

HUDSON

NORTH BERGEN TWP

FRANKLIN ELEMENTARY SCHOOL 17-3610-060 01-08

HUNTERDON HAMPTON BORO

17-2390-300 PK-08 49.9% 3.0%

SpED
11.8%

16.8%

62.8% 5.8%

16.0%

HAMPTON BOROUGH PUBLIC
SCHOOL
GILMORE J FISHER MIDDLE

19-1970-050 PK-08 33.3% 0.0%

14.8%

21-1430-060 06-08

40.5% 1.5%

17.6%

RICHARD C CROCKETT MIDDLE
SCHOOL
THEODORE SCHOR MIDDLE
SCHOOL
SOUTH RIVER MIDDLE SCHOOL

21-1950-083 06-08

41.5% 1.3%

15.7%

23-4130-057 06-08

40.9% 1.0%

14.7%

23-4920-055 06-08

45.8% 2.6%

15.6%

35.2% 0.3%

16.6%

31.9% 0.1%

17.7%

42.3% 2.2%

15.7%

33-4075-055 06-08

32.5% 0.0%

19.9%

MERCER

EWING TWP

MERCER

HAMILTON TWP

MIDDLESEX

PISCATAWAY TWP

MIDDLESEX

SOUTH RIVER BORO

OCEAN

MANCHESTER TWP

OCEAN

TOMS RIVER REGIONAL

PASSAIC

WOODLAND PARK

MANCHESTER TOWNSHIP MIDDLE 29-2940-045 06-08
SCHOOL
TOMS RIVER INTERMEDIATE
29-5190-061 06-08
SCHOOL SOUTH
MEMORIAL MIDDLE SCHOOL
31-5690-070 05-08

SALEM

PENNSVILLE

PENNSVILLE MIDDLE SCHOOL

SALEM

33-5910-070 05-08

31.4% 0.0%

19.2%

SOMERSET

WOODSTOWN-PILESGROVE WOODSTOWN MIDDLE SCHOOL
REG
FRANKLIN TWP
FRANKLIN MIDDLE SCHOOL

35-1610-160 07-08

48.4% 3.5%

15.7%

SOMERSET

SOMERVILLE BORO

SOMERVILLE MIDDLE SCHOOL

35-4820-055 06-08

43.4% 2.1%

15.1%

UNION

LINDEN CITY

MYLES J. MCMANUS MIDDLE
SCHOOL

39-2660-060 06-08

47.1% 2.2%

12.5%

18

Más contenido relacionado

La actualidad más candente

Verona prof dev presentation singleton elad 540
Verona prof dev presentation singleton elad 540Verona prof dev presentation singleton elad 540
Verona prof dev presentation singleton elad 540Tracey Singleton
 
The Grove Newsletter January 2011
The Grove Newsletter January 2011The Grove Newsletter January 2011
The Grove Newsletter January 2011Lisa_McVey
 
Lakeside Middle School ESSA Presentation February 2018
Lakeside Middle School ESSA Presentation February 2018Lakeside Middle School ESSA Presentation February 2018
Lakeside Middle School ESSA Presentation February 2018Spike Cook
 
Achieve Closing the Expectations Gap 2014
Achieve Closing the Expectations Gap 2014Achieve Closing the Expectations Gap 2014
Achieve Closing the Expectations Gap 2014Achieve, Inc.
 
R M S T I T L E I P L A N
R M S T I T L E I P L A NR M S T I T L E I P L A N
R M S T I T L E I P L A NKathyRees
 
Titirangi Primary School Charter March 2015
Titirangi Primary School Charter March 2015Titirangi Primary School Charter March 2015
Titirangi Primary School Charter March 2015TitirangiPrimarySchool
 
Accountability reports slidedoc final
Accountability reports slidedoc finalAccountability reports slidedoc final
Accountability reports slidedoc finalSREB
 
Mayor's Performance Framework current
Mayor's Performance Framework currentMayor's Performance Framework current
Mayor's Performance Framework currentChristine Marson
 
Young Lives school surveys update August16
Young Lives school surveys update August16Young Lives school surveys update August16
Young Lives school surveys update August16Young Lives Oxford
 
Standards and Assessments: Benchmarking State Implementation of College- and ...
Standards and Assessments: Benchmarking State Implementation of College- and ...Standards and Assessments: Benchmarking State Implementation of College- and ...
Standards and Assessments: Benchmarking State Implementation of College- and ...SREB
 
Fall TLT board report 9 2012
Fall TLT board report 9 2012Fall TLT board report 9 2012
Fall TLT board report 9 2012ISD191
 
MURSD 2012 MCAS Results & Accountability Status
MURSD 2012 MCAS Results & Accountability StatusMURSD 2012 MCAS Results & Accountability Status
MURSD 2012 MCAS Results & Accountability Statusjpm66
 
Benchmarking perspectives recs
Benchmarking perspectives recsBenchmarking perspectives recs
Benchmarking perspectives recsSREB
 
A Leak in the Teacher Pipeline? Employment Rates for Initially-Prepared Teach...
A Leak in the Teacher Pipeline? Employment Rates for Initially-Prepared Teach...A Leak in the Teacher Pipeline? Employment Rates for Initially-Prepared Teach...
A Leak in the Teacher Pipeline? Employment Rates for Initially-Prepared Teach...Analisa Sorrells
 
Accountability: Benchmarking Implementation of College- and Career-Readiness ...
Accountability: Benchmarking Implementation of College- and Career-Readiness ...Accountability: Benchmarking Implementation of College- and Career-Readiness ...
Accountability: Benchmarking Implementation of College- and Career-Readiness ...SREB
 
BG Comm Portfolio 2009
BG Comm Portfolio 2009BG Comm Portfolio 2009
BG Comm Portfolio 2009bgrebow
 
Educar en el s XXI. UIMP 2013. Evaluation Evidence on English Education Polic...
Educar en el s XXI. UIMP 2013. Evaluation Evidence on English Education Polic...Educar en el s XXI. UIMP 2013. Evaluation Evidence on English Education Polic...
Educar en el s XXI. UIMP 2013. Evaluation Evidence on English Education Polic...Instituto Nacional de Evaluación Educativa
 
Developing quality growth goals step 2 creating goals using the smart process
Developing quality growth goals step 2 creating goals using the smart processDeveloping quality growth goals step 2 creating goals using the smart process
Developing quality growth goals step 2 creating goals using the smart processAnil Kumar Yadav
 
AN INVESTIGATION INTO THE EFFECTIVENESS OF THE CURRICULUM AND ASSESSMENT POLI...
AN INVESTIGATION INTO THE EFFECTIVENESS OF THE CURRICULUM AND ASSESSMENT POLI...AN INVESTIGATION INTO THE EFFECTIVENESS OF THE CURRICULUM AND ASSESSMENT POLI...
AN INVESTIGATION INTO THE EFFECTIVENESS OF THE CURRICULUM AND ASSESSMENT POLI...IJITE
 

La actualidad más candente (20)

KochandcoIIMK
KochandcoIIMKKochandcoIIMK
KochandcoIIMK
 
Verona prof dev presentation singleton elad 540
Verona prof dev presentation singleton elad 540Verona prof dev presentation singleton elad 540
Verona prof dev presentation singleton elad 540
 
The Grove Newsletter January 2011
The Grove Newsletter January 2011The Grove Newsletter January 2011
The Grove Newsletter January 2011
 
Lakeside Middle School ESSA Presentation February 2018
Lakeside Middle School ESSA Presentation February 2018Lakeside Middle School ESSA Presentation February 2018
Lakeside Middle School ESSA Presentation February 2018
 
Achieve Closing the Expectations Gap 2014
Achieve Closing the Expectations Gap 2014Achieve Closing the Expectations Gap 2014
Achieve Closing the Expectations Gap 2014
 
R M S T I T L E I P L A N
R M S T I T L E I P L A NR M S T I T L E I P L A N
R M S T I T L E I P L A N
 
Titirangi Primary School Charter March 2015
Titirangi Primary School Charter March 2015Titirangi Primary School Charter March 2015
Titirangi Primary School Charter March 2015
 
Accountability reports slidedoc final
Accountability reports slidedoc finalAccountability reports slidedoc final
Accountability reports slidedoc final
 
Mayor's Performance Framework current
Mayor's Performance Framework currentMayor's Performance Framework current
Mayor's Performance Framework current
 
Young Lives school surveys update August16
Young Lives school surveys update August16Young Lives school surveys update August16
Young Lives school surveys update August16
 
Standards and Assessments: Benchmarking State Implementation of College- and ...
Standards and Assessments: Benchmarking State Implementation of College- and ...Standards and Assessments: Benchmarking State Implementation of College- and ...
Standards and Assessments: Benchmarking State Implementation of College- and ...
 
Fall TLT board report 9 2012
Fall TLT board report 9 2012Fall TLT board report 9 2012
Fall TLT board report 9 2012
 
MURSD 2012 MCAS Results & Accountability Status
MURSD 2012 MCAS Results & Accountability StatusMURSD 2012 MCAS Results & Accountability Status
MURSD 2012 MCAS Results & Accountability Status
 
Benchmarking perspectives recs
Benchmarking perspectives recsBenchmarking perspectives recs
Benchmarking perspectives recs
 
A Leak in the Teacher Pipeline? Employment Rates for Initially-Prepared Teach...
A Leak in the Teacher Pipeline? Employment Rates for Initially-Prepared Teach...A Leak in the Teacher Pipeline? Employment Rates for Initially-Prepared Teach...
A Leak in the Teacher Pipeline? Employment Rates for Initially-Prepared Teach...
 
Accountability: Benchmarking Implementation of College- and Career-Readiness ...
Accountability: Benchmarking Implementation of College- and Career-Readiness ...Accountability: Benchmarking Implementation of College- and Career-Readiness ...
Accountability: Benchmarking Implementation of College- and Career-Readiness ...
 
BG Comm Portfolio 2009
BG Comm Portfolio 2009BG Comm Portfolio 2009
BG Comm Portfolio 2009
 
Educar en el s XXI. UIMP 2013. Evaluation Evidence on English Education Polic...
Educar en el s XXI. UIMP 2013. Evaluation Evidence on English Education Polic...Educar en el s XXI. UIMP 2013. Evaluation Evidence on English Education Polic...
Educar en el s XXI. UIMP 2013. Evaluation Evidence on English Education Polic...
 
Developing quality growth goals step 2 creating goals using the smart process
Developing quality growth goals step 2 creating goals using the smart processDeveloping quality growth goals step 2 creating goals using the smart process
Developing quality growth goals step 2 creating goals using the smart process
 
AN INVESTIGATION INTO THE EFFECTIVENESS OF THE CURRICULUM AND ASSESSMENT POLI...
AN INVESTIGATION INTO THE EFFECTIVENESS OF THE CURRICULUM AND ASSESSMENT POLI...AN INVESTIGATION INTO THE EFFECTIVENESS OF THE CURRICULUM AND ASSESSMENT POLI...
AN INVESTIGATION INTO THE EFFECTIVENESS OF THE CURRICULUM AND ASSESSMENT POLI...
 

Similar a Ocean City Intermediate School report card 2013

Ocean City Primary School report card 2013-14
Ocean City Primary School report card 2013-14Ocean City Primary School report card 2013-14
Ocean City Primary School report card 2013-14OceanCityGazette
 
Ocean city intermediate school report card 2011 2012
Ocean city intermediate school report card 2011 2012Ocean city intermediate school report card 2011 2012
Ocean city intermediate school report card 2011 2012OceanCityGazette
 
Ocean city high school report card 2011 2012
Ocean city high school report card 2011 2012Ocean city high school report card 2011 2012
Ocean city high school report card 2011 2012OceanCityGazette
 
Ed6157 sp11leadershiptechresearcha cumspton
Ed6157 sp11leadershiptechresearcha cumsptonEd6157 sp11leadershiptechresearcha cumspton
Ed6157 sp11leadershiptechresearcha cumsptonAlana Cumpston
 
PSE 2014 Results
PSE 2014 ResultsPSE 2014 Results
PSE 2014 ResultsAdele Ramos
 
Readiness Matters: The Impact of College Readiness on College Persistence and...
Readiness Matters: The Impact of College Readiness on College Persistence and...Readiness Matters: The Impact of College Readiness on College Persistence and...
Readiness Matters: The Impact of College Readiness on College Persistence and...National Partnership for Educational Access
 
The Literacy First Framework -- Success Stories
The Literacy First Framework -- Success StoriesThe Literacy First Framework -- Success Stories
The Literacy First Framework -- Success Storiescatapultlearn
 
2013 ccrpi indicators 10.11.13
2013 ccrpi indicators 10.11.132013 ccrpi indicators 10.11.13
2013 ccrpi indicators 10.11.13jwalts
 
Pipeline math
Pipeline mathPipeline math
Pipeline mathharrindl
 
Pipelinebasicskillsmath2
Pipelinebasicskillsmath2Pipelinebasicskillsmath2
Pipelinebasicskillsmath2harrindl
 
Measuring student academic growth through Value Added methodology: An introd...
Measuring student academic growth through Value Added methodology:  An introd...Measuring student academic growth through Value Added methodology:  An introd...
Measuring student academic growth through Value Added methodology: An introd...F Jenkins
 
Leveraging MAP Data to Improve Instruction
Leveraging MAP Data to Improve InstructionLeveraging MAP Data to Improve Instruction
Leveraging MAP Data to Improve InstructionAmanda DeCardy
 
002709_2011-2012_BUILD
002709_2011-2012_BUILD002709_2011-2012_BUILD
002709_2011-2012_BUILDStephen Fujii
 
MAP Parent Presentation - Universal American School
MAP Parent Presentation - Universal American SchoolMAP Parent Presentation - Universal American School
MAP Parent Presentation - Universal American Schooluasdubai
 

Similar a Ocean City Intermediate School report card 2013 (20)

Ocean City Primary School report card 2013-14
Ocean City Primary School report card 2013-14Ocean City Primary School report card 2013-14
Ocean City Primary School report card 2013-14
 
School_Quality_Guide_2014_EMS_X125
School_Quality_Guide_2014_EMS_X125School_Quality_Guide_2014_EMS_X125
School_Quality_Guide_2014_EMS_X125
 
Ocean city intermediate school report card 2011 2012
Ocean city intermediate school report card 2011 2012Ocean city intermediate school report card 2011 2012
Ocean city intermediate school report card 2011 2012
 
Ocean city high school report card 2011 2012
Ocean city high school report card 2011 2012Ocean city high school report card 2011 2012
Ocean city high school report card 2011 2012
 
K12
K12K12
K12
 
Ed6157 sp11leadershiptechresearcha cumspton
Ed6157 sp11leadershiptechresearcha cumsptonEd6157 sp11leadershiptechresearcha cumspton
Ed6157 sp11leadershiptechresearcha cumspton
 
PSE 2014 Results
PSE 2014 ResultsPSE 2014 Results
PSE 2014 Results
 
AP_report
AP_reportAP_report
AP_report
 
Readiness Matters: The Impact of College Readiness on College Persistence and...
Readiness Matters: The Impact of College Readiness on College Persistence and...Readiness Matters: The Impact of College Readiness on College Persistence and...
Readiness Matters: The Impact of College Readiness on College Persistence and...
 
The Literacy First Framework -- Success Stories
The Literacy First Framework -- Success StoriesThe Literacy First Framework -- Success Stories
The Literacy First Framework -- Success Stories
 
2013 ccrpi indicators 10.11.13
2013 ccrpi indicators 10.11.132013 ccrpi indicators 10.11.13
2013 ccrpi indicators 10.11.13
 
Lori PR 2012-13
Lori PR 2012-13Lori PR 2012-13
Lori PR 2012-13
 
NAEP release
NAEP releaseNAEP release
NAEP release
 
Pipeline math
Pipeline mathPipeline math
Pipeline math
 
Pipelinebasicskillsmath2
Pipelinebasicskillsmath2Pipelinebasicskillsmath2
Pipelinebasicskillsmath2
 
Measuring student academic growth through Value Added methodology: An introd...
Measuring student academic growth through Value Added methodology:  An introd...Measuring student academic growth through Value Added methodology:  An introd...
Measuring student academic growth through Value Added methodology: An introd...
 
Leveraging MAP Data to Improve Instruction
Leveraging MAP Data to Improve InstructionLeveraging MAP Data to Improve Instruction
Leveraging MAP Data to Improve Instruction
 
002709_2011-2012_BUILD
002709_2011-2012_BUILD002709_2011-2012_BUILD
002709_2011-2012_BUILD
 
MAP Parent Presentation - Universal American School
MAP Parent Presentation - Universal American SchoolMAP Parent Presentation - Universal American School
MAP Parent Presentation - Universal American School
 
New Orleans
New OrleansNew Orleans
New Orleans
 

Más de OceanCityGazette

Ocean City Council agenda March 26, 2015
Ocean City Council agenda March 26, 2015Ocean City Council agenda March 26, 2015
Ocean City Council agenda March 26, 2015OceanCityGazette
 
Ocean City Council agenda Feb. 26, 2015
Ocean City Council agenda Feb. 26, 2015Ocean City Council agenda Feb. 26, 2015
Ocean City Council agenda Feb. 26, 2015OceanCityGazette
 
2015 Ocean City municipal budget presentation Feb. 19, 2015
2015 Ocean City municipal budget presentation Feb. 19, 20152015 Ocean City municipal budget presentation Feb. 19, 2015
2015 Ocean City municipal budget presentation Feb. 19, 2015OceanCityGazette
 
Ocean City Council agenda Feb. 12, 2015
Ocean City Council agenda Feb. 12, 2015Ocean City Council agenda Feb. 12, 2015
Ocean City Council agenda Feb. 12, 2015OceanCityGazette
 
Ocean City's 2015 capital plan presentation
Ocean City's 2015 capital plan presentationOcean City's 2015 capital plan presentation
Ocean City's 2015 capital plan presentationOceanCityGazette
 
Ocean City NJ road rating map
Ocean City NJ road rating mapOcean City NJ road rating map
Ocean City NJ road rating mapOceanCityGazette
 
Ocean City capital plan presentation summary 2015
Ocean City capital plan presentation summary 2015Ocean City capital plan presentation summary 2015
Ocean City capital plan presentation summary 2015OceanCityGazette
 
Ocean City Council agenda Jan. 8, 2015
Ocean City Council agenda Jan. 8, 2015Ocean City Council agenda Jan. 8, 2015
Ocean City Council agenda Jan. 8, 2015OceanCityGazette
 
Ocean City Council agenda Dec. 29, 2014
Ocean City Council agenda Dec. 29, 2014Ocean City Council agenda Dec. 29, 2014
Ocean City Council agenda Dec. 29, 2014OceanCityGazette
 
Ocean City Council agenda Dec. 18, 2014
Ocean City Council agenda Dec. 18, 2014Ocean City Council agenda Dec. 18, 2014
Ocean City Council agenda Dec. 18, 2014OceanCityGazette
 
Ocean City Wildwood dredge spoils agreement Dec. 4, 2014
Ocean City Wildwood dredge spoils agreement Dec. 4, 2014Ocean City Wildwood dredge spoils agreement Dec. 4, 2014
Ocean City Wildwood dredge spoils agreement Dec. 4, 2014OceanCityGazette
 
Ocean City Special Improvement District budget 2015
Ocean City Special Improvement District budget 2015Ocean City Special Improvement District budget 2015
Ocean City Special Improvement District budget 2015OceanCityGazette
 
Ocean City Council agenda, Dec. 4, 2014
Ocean City Council agenda, Dec. 4, 2014Ocean City Council agenda, Dec. 4, 2014
Ocean City Council agenda, Dec. 4, 2014OceanCityGazette
 
Ocean City Council agenda, Nov. 13, 2014
Ocean City Council agenda, Nov. 13, 2014Ocean City Council agenda, Nov. 13, 2014
Ocean City Council agenda, Nov. 13, 2014OceanCityGazette
 
Ocean City Council agenda Oct. 23, 2014
Ocean City Council agenda Oct. 23, 2014Ocean City Council agenda Oct. 23, 2014
Ocean City Council agenda Oct. 23, 2014OceanCityGazette
 
Executive Order 163 Drug Addiction Task Force
Executive Order 163 Drug Addiction Task ForceExecutive Order 163 Drug Addiction Task Force
Executive Order 163 Drug Addiction Task ForceOceanCityGazette
 
Ocean City Council agenda Oct. 9, 2014
Ocean City Council agenda Oct. 9, 2014Ocean City Council agenda Oct. 9, 2014
Ocean City Council agenda Oct. 9, 2014OceanCityGazette
 
Ocean City Council agenda Sept. 25, 2014
Ocean City Council agenda Sept. 25, 2014Ocean City Council agenda Sept. 25, 2014
Ocean City Council agenda Sept. 25, 2014OceanCityGazette
 
Ocean City turf field proposal
Ocean City turf field proposalOcean City turf field proposal
Ocean City turf field proposalOceanCityGazette
 

Más de OceanCityGazette (20)

Ocean City Council agenda March 26, 2015
Ocean City Council agenda March 26, 2015Ocean City Council agenda March 26, 2015
Ocean City Council agenda March 26, 2015
 
Ocean City Council agenda Feb. 26, 2015
Ocean City Council agenda Feb. 26, 2015Ocean City Council agenda Feb. 26, 2015
Ocean City Council agenda Feb. 26, 2015
 
2015 Ocean City municipal budget presentation Feb. 19, 2015
2015 Ocean City municipal budget presentation Feb. 19, 20152015 Ocean City municipal budget presentation Feb. 19, 2015
2015 Ocean City municipal budget presentation Feb. 19, 2015
 
Ocean City Council agenda Feb. 12, 2015
Ocean City Council agenda Feb. 12, 2015Ocean City Council agenda Feb. 12, 2015
Ocean City Council agenda Feb. 12, 2015
 
Ocean City's 2015 capital plan presentation
Ocean City's 2015 capital plan presentationOcean City's 2015 capital plan presentation
Ocean City's 2015 capital plan presentation
 
Ocean City NJ road rating map
Ocean City NJ road rating mapOcean City NJ road rating map
Ocean City NJ road rating map
 
Ocean City capital plan presentation summary 2015
Ocean City capital plan presentation summary 2015Ocean City capital plan presentation summary 2015
Ocean City capital plan presentation summary 2015
 
Ocean City Council agenda Jan. 8, 2015
Ocean City Council agenda Jan. 8, 2015Ocean City Council agenda Jan. 8, 2015
Ocean City Council agenda Jan. 8, 2015
 
Ocean City Council agenda Dec. 29, 2014
Ocean City Council agenda Dec. 29, 2014Ocean City Council agenda Dec. 29, 2014
Ocean City Council agenda Dec. 29, 2014
 
Ocean City Council agenda Dec. 18, 2014
Ocean City Council agenda Dec. 18, 2014Ocean City Council agenda Dec. 18, 2014
Ocean City Council agenda Dec. 18, 2014
 
Ocean City Wildwood dredge spoils agreement Dec. 4, 2014
Ocean City Wildwood dredge spoils agreement Dec. 4, 2014Ocean City Wildwood dredge spoils agreement Dec. 4, 2014
Ocean City Wildwood dredge spoils agreement Dec. 4, 2014
 
Ocean City Special Improvement District budget 2015
Ocean City Special Improvement District budget 2015Ocean City Special Improvement District budget 2015
Ocean City Special Improvement District budget 2015
 
Ocean City Council agenda, Dec. 4, 2014
Ocean City Council agenda, Dec. 4, 2014Ocean City Council agenda, Dec. 4, 2014
Ocean City Council agenda, Dec. 4, 2014
 
Ocean City Council agenda, Nov. 13, 2014
Ocean City Council agenda, Nov. 13, 2014Ocean City Council agenda, Nov. 13, 2014
Ocean City Council agenda, Nov. 13, 2014
 
Ocean City Council agenda Oct. 23, 2014
Ocean City Council agenda Oct. 23, 2014Ocean City Council agenda Oct. 23, 2014
Ocean City Council agenda Oct. 23, 2014
 
S2460 signing statement
S2460 signing statementS2460 signing statement
S2460 signing statement
 
Executive Order 163 Drug Addiction Task Force
Executive Order 163 Drug Addiction Task ForceExecutive Order 163 Drug Addiction Task Force
Executive Order 163 Drug Addiction Task Force
 
Ocean City Council agenda Oct. 9, 2014
Ocean City Council agenda Oct. 9, 2014Ocean City Council agenda Oct. 9, 2014
Ocean City Council agenda Oct. 9, 2014
 
Ocean City Council agenda Sept. 25, 2014
Ocean City Council agenda Sept. 25, 2014Ocean City Council agenda Sept. 25, 2014
Ocean City Council agenda Sept. 25, 2014
 
Ocean City turf field proposal
Ocean City turf field proposalOcean City turf field proposal
Ocean City turf field proposal
 

Último

IndiaWest: Your Trusted Source for Today's Global News
IndiaWest: Your Trusted Source for Today's Global NewsIndiaWest: Your Trusted Source for Today's Global News
IndiaWest: Your Trusted Source for Today's Global NewsIndiaWest2
 
15042024_First India Newspaper Jaipur.pdf
15042024_First India Newspaper Jaipur.pdf15042024_First India Newspaper Jaipur.pdf
15042024_First India Newspaper Jaipur.pdfFIRST INDIA
 
Global Terrorism and its types and prevention ppt.
Global Terrorism and its types and prevention ppt.Global Terrorism and its types and prevention ppt.
Global Terrorism and its types and prevention ppt.NaveedKhaskheli1
 
Experience the Future of the Web3 Gaming Trend
Experience the Future of the Web3 Gaming TrendExperience the Future of the Web3 Gaming Trend
Experience the Future of the Web3 Gaming TrendFabwelt
 
57 Bidens Annihilation Nation Policy.pdf
57 Bidens Annihilation Nation Policy.pdf57 Bidens Annihilation Nation Policy.pdf
57 Bidens Annihilation Nation Policy.pdfGerald Furnkranz
 
Rohan Jaitley: Central Gov't Standing Counsel for Justice
Rohan Jaitley: Central Gov't Standing Counsel for JusticeRohan Jaitley: Central Gov't Standing Counsel for Justice
Rohan Jaitley: Central Gov't Standing Counsel for JusticeAbdulGhani778830
 
complaint-ECI-PM-media-1-Chandru.pdfra;;prfk
complaint-ECI-PM-media-1-Chandru.pdfra;;prfkcomplaint-ECI-PM-media-1-Chandru.pdfra;;prfk
complaint-ECI-PM-media-1-Chandru.pdfra;;prfkbhavenpr
 
16042024_First India Newspaper Jaipur.pdf
16042024_First India Newspaper Jaipur.pdf16042024_First India Newspaper Jaipur.pdf
16042024_First India Newspaper Jaipur.pdfFIRST INDIA
 

Último (8)

IndiaWest: Your Trusted Source for Today's Global News
IndiaWest: Your Trusted Source for Today's Global NewsIndiaWest: Your Trusted Source for Today's Global News
IndiaWest: Your Trusted Source for Today's Global News
 
15042024_First India Newspaper Jaipur.pdf
15042024_First India Newspaper Jaipur.pdf15042024_First India Newspaper Jaipur.pdf
15042024_First India Newspaper Jaipur.pdf
 
Global Terrorism and its types and prevention ppt.
Global Terrorism and its types and prevention ppt.Global Terrorism and its types and prevention ppt.
Global Terrorism and its types and prevention ppt.
 
Experience the Future of the Web3 Gaming Trend
Experience the Future of the Web3 Gaming TrendExperience the Future of the Web3 Gaming Trend
Experience the Future of the Web3 Gaming Trend
 
57 Bidens Annihilation Nation Policy.pdf
57 Bidens Annihilation Nation Policy.pdf57 Bidens Annihilation Nation Policy.pdf
57 Bidens Annihilation Nation Policy.pdf
 
Rohan Jaitley: Central Gov't Standing Counsel for Justice
Rohan Jaitley: Central Gov't Standing Counsel for JusticeRohan Jaitley: Central Gov't Standing Counsel for Justice
Rohan Jaitley: Central Gov't Standing Counsel for Justice
 
complaint-ECI-PM-media-1-Chandru.pdfra;;prfk
complaint-ECI-PM-media-1-Chandru.pdfra;;prfkcomplaint-ECI-PM-media-1-Chandru.pdfra;;prfk
complaint-ECI-PM-media-1-Chandru.pdfra;;prfk
 
16042024_First India Newspaper Jaipur.pdf
16042024_First India Newspaper Jaipur.pdf16042024_First India Newspaper Jaipur.pdf
16042024_First India Newspaper Jaipur.pdf
 

Ocean City Intermediate School report card 2013

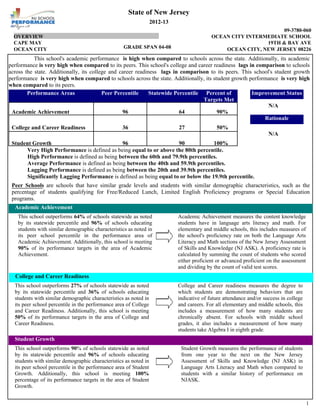
  • 1. State of New Jersey 2012-13 OVERVIEW CAPE MAY OCEAN CITY 09-3780-060 OCEAN CITY INTERMEDIATE SCHOOL 19TH & BAY AVE OCEAN CITY, NEW JERSEY 08226 1 GRADE SPAN 04-08 This school's academic performance is high when compared to schools across the state. Additionally, its academic performance is very high when compared to its peers. This school's college and career readiness lags in comparison to schools across the state. Additionally, its college and career readiness lags in comparison to its peers. This school's student growth performance is very high when compared to schools across the state. Additionally, its student growth performance is very high when compared to its peers. Performance Areas Peer Percentile Improvement Status Statewide Percentile Percent of Targets Met N/A 96 64 90% Academic Achievement Rationale College and Career Readiness 36 27 50% N/A 96 90 100% Student Growth Very High Performance is defined as being equal to or above the 80th percentile. High Performance is defined as being between the 60th and 79.9th percentiles. Average Performance is defined as being between the 40th and 59.9th percentiles. Lagging Performance is defined as being between the 20th and 39.9th percentiles. Significantly Lagging Performance is defined as being equal to or below the 19.9th percentile. Peer Schools are schools that have similar grade levels and students with similar demographic characteristics, such as the percentage of students qualifying for Free/Reduced Lunch, Limited English Proficiency programs or Special Education programs. Academic Achievement This school outperforms 64% of schools statewide as noted by its statewide percentile and 96% of schools educating students with similar demographic characteristics as noted in its peer school percentile in the performance area of Academic Achievement. Additionally, this school is meeting 90% of its performance targets in the area of Academic Achievement. Academic Achievement measures the content knowledge students have in language arts literacy and math. For elementary and middle schools, this includes measures of the school's proficiency rate on both the Language Arts Literacy and Math sections of the New Jersey Assessment of Skills and Knowledge (NJ ASK). A proficiency rate is calculated by summing the count of students who scored either proficient or advanced proficient on the assessment and dividing by the count of valid test scores. College and Career Readiness This school outperforms 27% of schools statewide as noted by its statewide percentile and 36% of schools educating students with similar demographic characteristics as noted in its peer school percentile in the performance area of College and Career Readiness. Additionally, this school is meeting 50% of its performance targets in the area of College and Career Readiness. College and Career readiness measures the degree to which students are demonstrating behaviors that are indicative of future attendance and/or success in college and careers. For all elementary and middle schools, this includes a measurement of how many students are chronically absent. For schools with middle school grades, it also includes a measurement of how many students take Algebra I in eighth grade. Student Growth This school outperforms 90% of schools statewide as noted by its statewide percentile and 96% of schools educating students with similar demographic characteristics as noted in its peer school percentile in the performance area of Student Growth. Additionally, this school is meeting 100% percentage of its performance targets in the area of Student Growth. Student Growth measures the performance of students from one year to the next on the New Jersey Assessment of Skills and Knowledge (NJ ASK) in Language Arts Literacy and Math when compared to students with a similar history of performance on NJASK. 1
  • 2. State of New Jersey 2012-13 DEMOGRAPHIC INFORMATION CAPE MAY OCEAN CITY 09-3780-060 OCEAN CITY INTERMEDIATE SCHOOL 19TH & BAY AVE OCEAN CITY, NEW JERSEY 08226 GRADE SPAN 04-08 Language Diversity This table presents the percentage of students who primarily speak each language in their home. 2012-13 Percent English 93.1% Spanish 6.0% Chinese 0.2% German 0.2% Philippine languages 0.2% Vietnamese 0.2% Note: "UG" represents the count of students who are 'on roll' (FTE) in this school but who are educated in ungraded classrooms, meaning that the classrooms may contain students from multiple grade levels. Total School Enrollment in Full Time Equivalent 2011-12 470 2012-13 487 Enrollment Trends by Program Participation 35 32 31 Percent of Enrollment 30 25 20 23 23 2010-11 19 2011-12 15 15 Enrollment by Gender 2012-13 This graph presents the count of students by gender who were 'on roll' (FTE) in October of each school year. 280 10 5 1 0 0 DISABILITY ECONDIS 240 LEP 200 Male 160 0 Female Current Year Enrollment by Program Participation 2012-2013 Students with Disability Economically Disadvantaged Students Limited English Proficient Students Count of Students Percentage of Enrollment 91 19% 155 120 80 40 31.8% 0 0.0% 2 0 2010-11 2010-11 2011-12 2012-13 2011-12 Male 234 235 240 2012-13 Female 247 235 247 2
  • 3. State of New Jersey 2012-13 ACADEMIC ACHIEVEMENT CAPE MAY OCEAN CITY 09-3780-060 OCEAN CITY INTERMEDIATE SCHOOL 19TH & BAY AVE OCEAN CITY, NEW JERSEY 08226 GRADE SPAN 04-08 Academic Achievement measures the content knowledge students have in language arts literacy and math. In elementary and middle school, this includes the outcomes of the New Jersey Assessment of Skills and Knowledge (NJASK). The first column Schoolwide Performance - in the table below includes measures of the total schoolwide proficiency rate in both language arts literacy and math. The second column - Peer School Percentile - indicates where the school’s proficiency rate compares to its group of peer schools. For example, a school that has a peer school percentile rank of 65 has a proficiency rate that is higher than 65% of its peer schools. The third column - Statewide Percentile - indicates where the school’s proficiency rate compares to schools across the state. For example, a school that has a statewide percentile of 30 has a proficiency rate that is higher than 30% of all schools with NJASK scores statewide. The last column - Percent of Targets Met - presents the percentage of progress targets met as defined by the NJDOE’s NCLB waiver. The Summary row presents the averages of the peer school percentiles, the average of statewide percentiles and the percentage of statewide targets met. Peer Percentile Schoolwide Performance Academic Achievement Indicators State Percentile Percent of Targets Met NJASK Language Arts Proficiency and above 72% 91 52 80% NJASK Math Proficiency and above 83% 100 75 100% SUMMARY - Academic Achievement NCLB Progress Targets - Language Arts Literacy 96 This table presents the Progress Targets as uniquely calculated for each subgroup in each school under NJDOE’s NCLB waiver. The methodology - as defined by the United States Department of Education - is calculated so that each subgroup will halve the gap between their 2011 proficiency rate and 100% proficiency by 2017. Subgroups Total Valid Pass Target Met Scores Rate Target? Schoolwide 402 71.9 76.4 NO 64 90% Proficiency Trends - Language Arts Literacy This graph presents the percentage of students who scored in the Advanced Proficient, Proficient and Partially Proficient categories of the statewide Language Arts Literacy assessment over the prior four years. White 317 77 Black - - 46 47.8 American Indian - - -- Asian - - -- 40 Two or More Races - - -- 20 74 44.6 YES* 0 Hispanic Students with Disability 80.1 YES* 100 -- 11 11 11 7 59 61 59 64 30 28 30 28 2009-10 2010-11 2011-12 2012-13 Advanced Proficient Proficient 80 61.7 54.4 YES* Limited English Proficient -Students Economically 129 53.5 59.5 YES* Disadvantaged Students YES* = Met Progress Target(Confidence Interval Applied) Data is presented for subgroups when the count is high enough under NCLB suppression rules. 60 Partially Proficient 3
  • 4. State of New Jersey 2012-13 ACADEMIC ACHIEVEMENT CAPE MAY OCEAN CITY 09-3780-060 OCEAN CITY INTERMEDIATE SCHOOL 19TH & BAY AVE OCEAN CITY, NEW JERSEY 08226 GRADE SPAN 04-08 NCLB Progress Targets - Math Proficiency Trends - Math This table presents the Progress Targets as uniquely calculated for each subgroup in each school under NJDOE’s NCLB waiver. The methodology - as defined by the United States Department of Education - is calculated so that each subgroup will halve the gap between their 2011 proficiency rate and 100% proficiency by 2017. Subgroups Total Valid Pass Target Met Scores Rate Target? Schoolwide 402 83 84.4 YES* White 317 87 88.1 YES* Black - - 46 69.6 American Indian - - -- Asian - - -- Two or More Races - - This graph presents the percentage of students who scored in the Advanced Proficient, Proficient and Partially Proficient categories of the statewide Math assessment over the prior four years. -- Hispanic 100 72.2 80 YES* 32 35 41 40 46 46 40 43 21 -- 19 19 17 2009-10 2010-11 2011-12 2012-13 Advanced Proficient Proficient 60 40 20 Students with Disability 74 62.2 62.5 YES* Limited English Proficient -Students Economically 129 72.1 69.5 YES Disadvantaged Students YES* = Met Progress Target(Confidence Interval Applied) 0 Partially Proficient Data is presented for subgroups when the count is high enough under NCLB suppression rules. 4
  • 5. State of New Jersey 2012-13 ACADEMIC ACHIEVEMENT CAPE MAY OCEAN CITY 09-3780-060 OCEAN CITY INTERMEDIATE SCHOOL 19TH & BAY AVE OCEAN CITY, NEW JERSEY 08226 GRADE SPAN 04-08 NJASK Results - Language Arts Literacy Grade Level - 04 This table presents the grade level proficiency results, as measured by NJASK, in Advanced Proficient, Proficient, and Partially Proficient categories for all appropriate subgroups. Advanced Proficient Partially Subgroups Proficient Proficient Schoolwide 9% 51% 40% White 10% 57% 33% Black - - - 0% 33% 67% American Indian - - - Asian - - - - - 11% 37% 53% - - This graph presents the grade level outcomes in the categories of Advanced Proficient, Proficient, and Partially Proficient over the last four years. - Two or More Races NJASK Proficiency Trends - Language Arts Literacy Grade Level - 04 - Hispanic Students with Disability Limited English Proficient Students Economically Disadvantaged 0% 32% 68% Students Data is presented for subgroups when the count is high enough under NCLB suppression rules. NJASK Results - Language Arts Literacy Grade Level - 05 This table presents the grade level proficiency results, as measured by NJASK, in Advanced Proficient, Proficient, and Partially Proficient categories for all appropriate subgroups. Advanced Proficient Partially Subgroups Proficient Proficient Schoolwide 3% 59% 39% White 3% 62% 34% Black - - - Hispanic - - - American Indian - - - Asian - - - - - 0% 27% 73% - - 4 5 9 62 51 80 46 60 40 50 20 0 40 33 2009-10 2010-11 Advanced Proficient 2012-13 Proficient Partially Proficient NJASK Proficiency Trends - Language Arts Literacy Grade Level - 05 This graph presents the grade level outcomes in the categories of Advanced Proficient, Proficient, and Partially Proficient over the last four years. - Two or More Races 100 - Students with Disability Limited English Proficient Students Economically Disadvantaged 0% 43% 57% Students Data is presented for subgroups when the count is high enough under NCLB suppression rules. 100 4 80 51 1 3 3 62 59 34 39 2011-12 2012-13 48 60 40 20 0 45 51 2009-10 2010-11 Advanced Proficient Proficient Partially Proficient 5
  • 6. State of New Jersey 2012-13 ACADEMIC ACHIEVEMENT CAPE MAY GRADE SPAN 04-08 OCEAN CITY NJASK Results - Language Arts Literacy Grade Level - 06 This table presents the grade level proficiency results, as measured by NJASK, in Advanced Proficient, Proficient, and Partially Proficient categories for all appropriate subgroups. Advanced Proficient Partially Subgroups Proficient Proficient Schoolwide 5% 71% 24% White 6% 82% 12% Black - - - 0% 38% 62% Hispanic American Indian - - - Asian - - - - - 0% 47% 53% - - This graph presents the grade level outcomes in the categories of Advanced Proficient, Proficient, and Partially Proficient over the last four years. 100 2 4 69 67 4 5 80 50 - Two or More Races 09-3780-060 OCEAN CITY INTERMEDIATE SCHOOL 19TH & BAY AVE OCEAN CITY, NEW JERSEY 08226 NJASK Proficiency Trends - Language Arts Literacy Grade Level - 06 - Students with Disability Limited English Proficient Students Economically Disadvantaged 0% 45% 55% Students Data is presented for subgroups when the count is high enough under NCLB suppression rules. NJASK Results - Language Arts Literacy Grade Level - 07 This table presents the grade level proficiency results, as measured by NJASK, in Advanced Proficient, Proficient, and Partially Proficient categories for all appropriate subgroups. Advanced Proficient Partially Subgroups Proficient Proficient Schoolwide 13% 59% 28% White 13% 60% 28% Black - - - Hispanic - - - American Indian - - - Asian - - - - - 0% 36% 64% - - 71 40 20 0 46 28 29 2009-10 2010-11 Advanced Proficient 24 2011-12 2012-13 Proficient Partially Proficient NJASK Proficiency Trends - Language Arts Literacy Grade Level - 07 This graph presents the grade level outcomes in the categories of Advanced Proficient, Proficient, and Partially Proficient over the last four years. - Two or More Races 60 - Students with Disability Limited English Proficient Students Economically Disadvantaged 8% 52% 40% Students Data is presented for subgroups when the count is high enough under NCLB suppression rules. 100 14 12 16 13 60 60 55 59 26 28 28 28 2009-10 2010-11 2011-12 2012-13 80 60 40 20 0 Advanced Proficient Proficient Partially Proficient 6
  • 7. State of New Jersey 2012-13 09-3780-060 OCEAN CITY INTERMEDIATE SCHOOL 19TH & BAY AVE OCEAN CITY, NEW JERSEY 08226 NJASK Proficiency Trends - Language Arts Literacy Grade Level - 08 ACADEMIC ACHIEVEMENT CAPE MAY GRADE SPAN 04-08 OCEAN CITY NJASK Results - Language Arts Literacy Grade Level - 08 This table presents the grade level proficiency results, as measured by NJASK, in Advanced Proficient, Proficient, and Partially Proficient categories for all appropriate subgroups. Advanced Proficient Partially Subgroups Proficient Proficient Schoolwide 8% 83% 9% White 10% Black 83% This graph presents the grade level outcomes in the categories of Advanced Proficient, Proficient, and Partially Proficient over the last four years. 100 7% - - - Hispanic - - - American Indian - - - Asian - - Two or More Races - - - 0% 62% 38% - - - 26 - Students with Disability Limited English Proficient Students 80 29 8 21 60 40 83 66 64 65 7 2009-10 8 2010-11 20 0 Economically Disadvantaged 0% 91% 9% Students Data is presented for subgroups when the count is high enough under NCLB suppression rules. Advanced Proficient 14 9 2011-12 2012-13 Proficient Partially Proficient 2013 National Assessment Educational Progress (NAEP) The National Assessment of Educational Progress (NAEP) is the largest national assessment of what our nation’s students know and can do. NAEP assesses fourth-, eighth-, and twelfth-grade students in subjects such as reading, mathematics, science, and writing. The reporting of NAEP scores on state report cards is a federal mandate. The results of NAEP are also published as the Nation’s Report Card, and are available for the nation, states, and, in some cases, urban districts. The NAEP scores on the report card include grades four and eight 2013 reading and math scores for New Jersey which are the last scores published. For subgroup outcomes, visit : http://www.nj.gov/education/pr/1213/naep/naep4read.html For more information, visit <http://nces.ed.gov/nationsreportcard/> Grade 4 Reading State/Nation Below Basic Proficiency Percentages Basic Proficient Advanced All Students State (NJ) 25 33 30 12 All Students Nation 32 33 27 8 2013 National Assessment Educational Progress (NAEP) The National Assessment of Educational Progress (NAEP) is the largest national assessment of what our nation’s students know and can do. NAEP assesses fourth-, eighth-, and twelfth-grade students in subjects such as reading, mathematics, science, and writing. The reporting of NAEP scores on state report cards is a federal mandate. The results of NAEP are also published as the Nation’s Report Card, and are available for the nation, states, and, in some cases, urban districts. The NAEP scores on the report card include grades four and eight 2013 reading and math scores for New Jersey which are the last scores published. For subgroup outcomes, visit : http://www.nj.gov/education/pr/1213/naep/naep8read.html For more information, visit <http://nces.ed.gov/nationsreportcard/> Grade 8 Reading All Students State/Nation State (NJ) All Students Nation Below Basic 15 22 Proficiency Percentages Basic Proficient 39 40 42 32 Advanced 7 4 7
  • 8. State of New Jersey 2012-13 ACADEMIC ACHIEVEMENT CAPE MAY OCEAN CITY 09-3780-060 OCEAN CITY INTERMEDIATE SCHOOL 19TH & BAY AVE OCEAN CITY, NEW JERSEY 08226 GRADE SPAN 04-08 NJASK Proficiency Trends - Math - Grade Level - 04 NJASK Results - MATH Grade Level - 04 This table presents the grade level proficiency results, as measured by NJASK, in Advanced Proficient, Proficient, and Partially Proficient This graph presents the grade level outcomes in the categories categories for all appropriate subgroups. of Advanced Proficient, Proficient, and Partially Proficient Advanced Partially over the last four years. Proficient Proficient Proficient Subgroups Schoolwide 45% 38% 17% White 53% 35% 12% Black - - - 13% 53% 33% American Indian - - - Asian - - - 40 Two or More Races - - - 20 32% 53% 16% - - - 14% 55% 32% Hispanic Students with Disability Limited English Proficient Students Economically Disadvantaged Students 100 80 32 37 45 60 49 46 38 19 0 17 17 2009-10 2010-11 2012-13 Advanced Proficient Proficient Partially Proficient Data is presented for subgroups when the count is high enough under NCLB suppression rules. NJASK Results - MATH Grade Level - 05 NJASK Proficiency Trends - Math - Grade Level - 05 This table presents the grade level proficiency results, as measured by NJASK, in Advanced Proficient, Proficient, and Partially Proficient This graph presents the grade level outcomes in the categories categories for all appropriate subgroups. of Advanced Proficient, Proficient, and Partially Proficient Advanced Partially over the last four years. Proficient Proficient Proficient Subgroups Schoolwide 48% 40% 12% White 48% 46% 7% Black - - - Hispanic - - - American Indian - - - Asian - - - 40 Two or More Races - - - 20 27% 27% 45% - - - 39% 32% 29% Students with Disability Limited English Proficient Students Economically Disadvantaged Students 100 80 32 38 46 48 40 40 16 14 12 2010-11 2011-12 2012-13 60 0 42 26 2009-10 46 Advanced Proficient Proficient Partially Proficient Data is presented for subgroups when the count is high enough under NCLB suppression rules. 8
  • 9. State of New Jersey 2012-13 ACADEMIC ACHIEVEMENT CAPE MAY GRADE SPAN 04-08 OCEAN CITY NJASK Results - MATH Grade Level - 06 09-3780-060 OCEAN CITY INTERMEDIATE SCHOOL 19TH & BAY AVE OCEAN CITY, NEW JERSEY 08226 NJASK Proficiency Trends - Math - Grade Level - 06 This table presents the grade level proficiency results, as measured by NJASK, in Advanced Proficient, Proficient, and Partially Proficient This graph presents the grade level outcomes in the categories categories for all appropriate subgroups. of Advanced Proficient, Proficient, and Partially Proficient Advanced Partially over the last four years. Proficient Proficient Proficient Subgroups Schoolwide 37% 51% 13% White 45% 47% 8% Black - - - 15% 69% 15% American Indian - - - Asian - - - 40 Two or More Races - - - 20 18% 47% 35% - - - 19% 55% 26% Hispanic Students with Disability Limited English Proficient Students Economically Disadvantaged Students 100 80 30 27 56 57 46 15 16 20 2009-10 2010-11 2011-12 34 37 60 0 Advanced Proficient 51 13 2012-13 Proficient Partially Proficient Data is presented for subgroups when the count is high enough under NCLB suppression rules. NJASK Results - MATH Grade Level - 07 NJASK Proficiency Trends - Math - Grade Level - 07 This table presents the grade level proficiency results, as measured by NJASK, in Advanced Proficient, Proficient, and Partially Proficient This graph presents the grade level outcomes in the categories categories for all appropriate subgroups. of Advanced Proficient, Proficient, and Partially Proficient Advanced Partially over the last four years. Proficient Proficient Proficient Subgroups Schoolwide 33% 41% 27% White 32% 44% 24% Black - - - Hispanic - - - American Indian - - - 100 80 60 Asian - - - - - - 20 14% 21% 64% - - - 24% 40% 36% 42 28 27 33 47 46 41 24 27 27 2010-11 2011-12 2012-13 40 Two or More Races 26 Students with Disability Limited English Proficient Students Economically Disadvantaged Students 0 32 2009-10 Advanced Proficient Proficient Partially Proficient Data is presented for subgroups when the count is high enough under NCLB suppression rules. 9
  • 10. State of New Jersey 2012-13 ACADEMIC ACHIEVEMENT CAPE MAY GRADE SPAN 04-08 OCEAN CITY NJASK Results - MATH Grade Level - 08 09-3780-060 OCEAN CITY INTERMEDIATE SCHOOL 19TH & BAY AVE OCEAN CITY, NEW JERSEY 08226 NJASK Proficiency Trends - Math - Grade Level - 08 This table presents the grade level proficiency results, as measured by NJASK, in Advanced Proficient, Proficient, and Partially Proficient This graph presents the grade level outcomes in the categories categories for all appropriate subgroups. of Advanced Proficient, Proficient, and Partially Proficient Advanced Partially over the last four years. Proficient Proficient Proficient Subgroups Schoolwide 39% 45% 16% White 43% 43% 14% Black - - - 100 80 39 - - - - - Asian - - - - - - 54% 38% - - - 30% 52% 38 19 18 16 2009-10 2010-11 2011-12 2012-13 17% 53 20 8% 43 40 Two or More Races 43 - American Indian 41 16 Hispanic Students with Disability Limited English Proficient Students Economically Disadvantaged Students 60 0 29 Advanced Proficient 45 Proficient Partially Proficient Data is presented for subgroups when the count is high enough under NCLB suppression rules. 2013 National Assessment Educational Progress (NAEP) The National Assessment of Educational Progress (NAEP) is the largest national assessment of what our nation’s students know and can do. NAEP assesses fourth-, eighth-, and twelfth-grade students in subjects such as reading, mathematics, science, and writing. The reporting of NAEP scores on state report cards is a federal mandate. The results of NAEP are also published as the Nation’s Report Card, and are available for the nation, states, and, in some cases, urban districts. The NAEP scores on the report card include grades four and eight 2013 reading and math scores for New Jersey which are the last scores published. For subgroup outcomes, visit : http://www.nj.gov/education/pr/1213/naep/naep4math.html For more information, visit <http://nces.ed.gov/nationsreportcard/> Grade 4 Math State/Nation Proficiency Percentages Below Basic Basic Proficient Advanced All Students State (NJ) 13 38 39 10 All Students Nation 17 41 34 8 2013 National Assessment Educational Progress (NAEP) The National Assessment of Educational Progress (NAEP) is the largest national assessment of what our nation’s students know and can do. NAEP assesses fourth-, eighth-, and twelfth-grade students in subjects such as reading, mathematics, science, and writing. The reporting of NAEP scores on state report cards is a federal mandate. The results of NAEP are also published as the Nation’s Report Card, and are available for the nation, states, and, in some cases, urban districts. The NAEP scores on the report card include grades four and eight 2013 reading and math scores for New Jersey which are the last scores published.For subgroup outcomes, visit : http://www.nj.gov/education/pr/1213/naep/naep8math.html For more information, visit <http://nces.ed.gov/nationsreportcard/> Grade 8 Math State/Nation Proficiency Percentages Below Basic Basic Proficient Advanced All Students State (NJ) 18 34 33 16 All Students Nation 26 38 27 9 10
  • 11. State of New Jersey 2012-13 ACADEMIC ACHIEVEMENT CAPE MAY OCEAN CITY GRADE SPAN 04-08 NJASK Results - Science Grade Level - 04 This table presents the grade level proficiency results, as measured by 3 NJASK, in Advanced Proficient, Proficient, and Partially Proficient categories for all appropriate subgroups. Advanced Partially Proficient Subgroups Proficient Proficient Schoolwide 55% 35% 10% 09-3780-060 OCEAN CITY INTERMEDIATE SCHOOL 19TH & BAY AVE OCEAN CITY, NEW JERSEY 08226 NJASK Proficiency Trends - Science - Grade Level - 04 This graph presents the grade level outcomes in the categories of Advanced Proficient, Proficient, and Partially Proficient over the last four years. 100 White 63% 27% 10% Black - - - 33% 53% 13% 60 American Indian - - - 40 Asian - - - Two or More Races - - - Hispanic Students with Disability 47% 37% 16% 80 39 55 61 58 0 Limited English Proficient Students Economically Disadvantaged 32% 50% 18% Students Data is presented for subgroups when the count is high enough under NCLB suppression rules. 35 31 20 10 2012-13 8 2010-11 3 2009-10 Advanced Proficient Proficient Partially Proficient NJASK Results - Science Grade Level - 08 NJASK Proficiency Trends - Science - Grade Level - 08 This table presents the grade level proficiency results, as measured by NJASK, in Advanced Proficient, Proficient, and Partially Proficient categories for all appropriate subgroups. Advanced Partially Proficient Subgroups Proficient Proficient Schoolwide 35% 53% 12% This graph presents the grade level outcomes in the categories of Advanced Proficient, Proficient, and Partially Proficient over the last four years. 100 White 41% 52% 7% Black - - - Hispanic - - - 60 American Indian - - - 40 Asian - - - Two or More Races - - 80 - Students with Disability 23% 54% 23% Limited English Proficient Students Economically Disadvantaged 30% 52% 17% Students Data is presented for subgroups when the count is high enough under NCLB suppression rules. 20 0 49 38 49 35 53 53 40 9 2010-11 12 12 2011-12 2012-13 Advanced Proficient Proficient 45 5 2009-10 Partially Proficient 11
  • 12. State of New Jersey 2012-13 COLLEGE AND CAREER READINESS CAPE MAY OCEAN CITY 09-3780-060 OCEAN CITY INTERMEDIATE SCHOOL 19TH & BAY AVE OCEAN CITY, NEW JERSEY 08226 GRADE SPAN 04-08 Students in both elementary and middles schools begin to demonstrate college readiness behaviors long before they even enter high school. Among the behaviors that research has shown to be indicative of success and college and career readiness are regularly attending school and challenging themselves with rigorous course work. First, the table presents the percentage of students, as measured against the school’s enrollment in eighth grade, who were reported via NJSMART as being enrolled in Algebra I. The table also presents the percentage of students who were chronically absent during the prior school year. A chronically absent student is a student who was not present for any reason for more than 10% of the total days possible for that individual student. The first column - Schoolwide Performance - represents the outcomes for these particular indicators in this school. The second column - Peer School Percentile - indicates how the school’s performance compares to its group of peer schools. For example, a school whose peer school is 65 in Algebra I Enrollment has a higher Algebra I Enrollment than 65% of its peer group. The third column Statewide Percentile - indicates how the school’s performance compares to schools across the state. The fourth column - Statewide Target - provides the statewide targets for each of these indicators. The last column - Met Target? - indicates whether the School Performance met or exceeded the statewide target. The Summary row presents the averages of the peer school percentiles, the average of statewide percentiles and the percentage of statewide targets met. College and Career Readiness Indicators School Performance Peer Percentile Students taking Algebra (%) 25% 65 51 20% YES Chronic Absenteeism (%) 30% 6 3 6% NO 36 27 Summary Statewide Percentile Met Target? 50% Algebra I Absenteeism This table presents the percentage of eighth graders who were reported in the Algebra I course code in NJSMART and the percentage of those students who earned a C or higher in the course. 2012-13 Statewide Target School 25% Algebra grade (C or better) 95% 40 38 35 30 Percent Absent Students taking Algebra I The chart below presents the percentage of students who were absent in each category of absence: 0 absences, 1- 5 absences, 6 - 10 absences, 11 - 15 absences, and more than 15 absences. An absence is defined as being ‘not present’ and includes the days missed regardless of whether they were determined to be excused or unexcused by the school. 25 22 20 20 19 15 10 5 0 2 0 Absences 1-5 Absences 6-10 Absences 11-15 Absences 15+ Absences Absences 0 Absences 1-5 Absences 11-15 Absences 6-10 Absences 15+ Absences 12
  • 13. State of New Jersey 2012-13 STUDENT GROWTH CAPE MAY OCEAN CITY 09-3780-060 OCEAN CITY INTERMEDIATE SCHOOL 19TH & BAY AVE OCEAN CITY, NEW JERSEY 08226 GRADE SPAN 04-08 This section of the performance report presents data about student growth, utilizing the Student Growth Percentile Methodology (SGP). SGP creates a measure of how students progressed in grades 4 through 8 in NJ ASK Language Arts Literacy and Math when compared to other students with a similar NJ ASK test score history. A short video explaining the methodology can be found here: http://www.state.nj.us/education/njsmart/performance/ The first column - Schoolwide Performance - presents the schoolwide median growth score in either Language Arts 5 Literacy or Math for all students in the school. The second column - Peer Percentile - indicates how the school’s growth performance compares to its group of peer schools. The third column - Statewide Percentile - indicates how a school compares to schools across the state. The last column - Met Target? - indicates whether the school’s performance met or exceeded the target. The summary row presents the averages of the peer school percentiles, the averages of statewide percentiles, the percentage of statewide targets met. Student Growth Indicators Schoolwide Performance Peer Percentile Statewide Target Statewide Percentile Met Target? Student Growth on Language Arts 58 97 87 35 YES Student Growth on Math 63 94 92 35 YES 96 90 100% Student Growth This table presents for all students with growth scores the interaction between their proficiency level on NJASK and their growth scores. For example, in the top left cell the percentage of students who are both partially proficient AND also demonstrating low growth is displayed. Language Arts Math GROWTH Low Typical GROWTH Low Typical 6% Partially Proficient 8% 5% 4% 21% 31% Proficient 13% 13% 17% 2% 5% Advanced Proficient 3% 10% 27% Partially Proficient 15% 7% Proficient 14% Advanced Proficient 0% High High Low Growth is defined as an Student Growth Percentile score less than 35. Typical Growth is defined as an Student Growth Percentile score between 35 and 65. High Growth is defined as a Student Growth Percentile score higher than 65. 13
  • 14. State of New Jersey 2012-13 WITHIN SCHOOL ACHIEVEMENT GAP CAPE MAY OCEAN CITY 09-3780-060 OCEAN CITY INTERMEDIATE SCHOOL 19TH & BAY AVE OCEAN CITY, NEW JERSEY 08226 GRADE SPAN 04-08 This section of the performance report presents data about the achievement gap that exists within a school - as measured by the difference between the students’ scale scores at the 25th and 75th percentile in the school, the so-called Interquartile Range (IQR). Taken together with an understanding of the overall and average achievement levels in the school, the IQR furthers an understanding of the range of student outcomes that exist in a school. A school gap smaller than the state gap indicates that the school’s range of student outcomes is narrower than the state’s while a school gap larger than the state gap indicates that the school’s range of student outcomes is larger than the state’s. Grade Level - 04 Grade Level - 04 NJ ASK Language Arts 25th %ile vs 75th%ile This table presents the scale scores associated with students at the bottom (0th percentile), the 25th percentile, the 50th percentile, the 75th percentile and the top (99th percentile) of school's distribution. Percentile School Scale Score State Scale Score NJ ASK Math 25th %ile vs 75th%ile This table presents the scale scores associated with students at the bottom (0th percentile), the 25th percentile, the 50th percentile, the 75th percentile and the top (99th percentile) of school's distribution. Percentile School Scale Score State Scale Score 99th 259 300 99th 300 300 75th 225 225 75th 271 260 50th 206 206 50th 239 229 25th 186 183 25th 205 201 0th 132 100 0th 106 100 Scale Score Gap - Scale Score Gap School State 25th vs 75th Gap 39 Scale Score Gap - Scale Score Gap School State 25th vs 75th Gap 42 Grade Level - 05 School Scale Score 59 Grade Level - 05 NJ ASK Language Arts 25th %ile vs 75th%ile This table presents the scale scores associated with students at the bottom (0th percentile), the 25th percentile, the 50th percentile, the 75th percentile and the top (99th percentile) of school's distribution. Percentile 66 State Scale Score NJ ASK Math 25th %ile vs 75th%ile This table presents the scale scores associated with students at the bottom (0th percentile), the 25th percentile, the 50th percentile, the 75th percentile and the top (99th percentile) of school's distribution. Percentile School Scale Score State Scale Score 99th 252 300 99th 300 300 75th 221 224 75th 278 268 50th 202 205 50th 248 237 25th 190 187 25th 226 205 0th 151 100 0th 143 100 Scale Score Gap - Scale Score Gap School State 25th vs 75th Gap 31 37 Scale Score Gap - Scale Score Gap School State 25th vs 75th Gap 52 63 14
  • 15. State of New Jersey 2012-13 WITHIN SCHOOL ACHIEVEMENT GAP CAPE MAY OCEAN CITY 09-3780-060 OCEAN CITY INTERMEDIATE SCHOOL 19TH & BAY AVE OCEAN CITY, NEW JERSEY 08226 GRADE SPAN 04-08 Grade Level - 06 Grade Level - 06 NJ ASK Language Arts 25th %ile vs 75th%ile This table presents the scale scores associated with students at the bottom (0th percentile), the 25th percentile, the 50th percentile, the 75th percentile and the top (99th percentile) of school's distribution. Percentile School Scale Score State Scale Score NJ ASK Math 25th %ile vs 75th%ile This table presents the scale scores associated with students at the bottom (0th percentile), the 25th percentile, the 50th percentile, the 75th percentile and the top (99th percentile) of school's distribution. Percentile School Scale Score State Scale Score 99th 257 300 99th 300 300 75th 228 225 75th 261 252 50th 214 209 50th 236 225 25th 197 191 25th 213 201 0th 162 100 0th 137 100 Scale Score Gap - Scale Score Gap State School 25th vs 75th Gap 31 Scale Score Gap - Scale Score Gap State School 25th vs 75th Gap 34 Grade Level - 07 School Scale Score 51 Grade Level - 07 NJ ASK Language Arts 25th %ile vs 75th%ile This table presents the scale scores associated with students at the bottom (0th percentile), the 25th percentile, the 50th percentile, the 75th percentile and the top (99th percentile) of school's distribution. Percentile 48 State Scale Score NJ ASK Math 25th %ile vs 75th%ile This table presents the scale scores associated with students at the bottom (0th percentile), the 25th percentile, the 50th percentile, the 75th percentile and the top (99th percentile) of school's distribution. Percentile School Scale Score State Scale Score 99th 264 300 99th 300 300 75th 235 231 75th 251 250 50th 214 211 50th 220 213 25th 200 189 25th 197 183 0th 140 100 0th 151 100 Scale Score Gap - Scale Score Gap School State 25th vs 75th Gap 35 42 Scale Score Gap - Scale Score Gap School State 25th vs 75th Gap 54 67 15
  • 16. State of New Jersey 2012-13 WITHIN SCHOOL ACHIEVEMENT GAP CAPE MAY OCEAN CITY 09-3780-060 OCEAN CITY INTERMEDIATE SCHOOL 19TH & BAY AVE OCEAN CITY, NEW JERSEY 08226 GRADE SPAN 04-08 Grade Level - 08 Grade Level - 08 NJ ASK Language Arts 25th %ile vs 75th%ile This table presents the scale scores associated with students at the bottom (0th percentile), the 25th percentile, the 50th percentile, the 75th percentile and the top (99th percentile) of school's distribution. Percentile School Scale Score State Scale Score NJ ASK Math 25th %ile vs 75th%ile This table presents the scale scores associated with students at the bottom (0th percentile), the 25th percentile, the 50th percentile, the 75th percentile and the top (99th percentile) of school's distribution. Percentile School Scale Score State Scale Score 99th 266 300 99th 300 300 75th 236 236 75th 260 255 50th 224 220 50th 233 219 25th 213 205 25th 207 188 0th 173 100 0th 154 100 Scale Score Gap - Scale Score Gap State School 25th vs 75th Gap 23 31 Scale Score Gap - Scale Score Gap State School 25th vs 75th Gap 53 67 16
  • 17. State of New Jersey 2012-13 SCHOOL CLIMATE CAPE MAY OCEAN CITY 09-3780-060 OCEAN CITY INTERMEDIATE SCHOOL 19TH & BAY AVE OCEAN CITY, NEW JERSEY 08226 GRADE SPAN 04-08 Length of School Day Instructional Time This table presents the amount of time a school is in session for a typical student on a normal school day. 7 This table presents the amount of time that a typical student is engaged in instructional activities under the supervision of a certified teacher. School 2012-13 School 6 Hrs. 40 Mins. Full Time 6 Hrs. 10 Mins. Shared Time 2012-13 0 Hrs. 0 Mins. Student Suspension Rate This table presents the percentage of students who were suspended one or more times during the school year. Student Expulsions This table presents the number of students who were expelled from the school and district during the school year. School 2012-13 1.2% School 2012-13 0 Student to Staff Ratio This table presents the count of students per faculty member or administrator in the school. All staff are counted in full-time equivalents. 2012-13 School Faculty 9 Administrators 487 17
  • 18. OCEAN CITY INTERMEDIATE SCHOOL 09-3780-060 SCHOOL PEER GROUP This table presents the list of peer schools in alphabetical order by county name that was created specifically for this school (highlighted in yellow). Peer schools are drawn from across the state and represent schools that have similar grade configurations and that are educating students of similar demographic characteristics, as measured by enrollment in Free/Reduced Lunch Programs, Limited English Proficiency or Special Education Programs. ATLANTIC EGG HARBOR TWP ALDER AVENUE MIDDLE SCHOOL CDS GRAD CODE ESPAN FRPL LEP 01-1310-038 06-08 45.2% 1.6% ATLANTIC FOLSOM BORO FOLSOM ELEMENTARY SCHOOL 01-1540-050 PK-08 35.3% 0.2% 16.2% ATLANTIC HAMMONTON TOWN HAMMONTON MIDDLE SCHOOL 01-1960-060 06-08 38.3% 1.5% 17.9% ATLANTIC SOMERS POINT CITY 01-4800-055 KG-08 55.5% 4.0% 14.2% BERGEN ELMWOOD PARK JORDAN ROAD ELEMENTARY SCHOOL MEMORIAL MIDDLE SCHOOL 03-1345-060 06-08 43.2% 2.6% 17.5% BERGEN MOONACHIE BORO ROBERT L. CRAIG SCHOOL 03-3350-060 PK-08 47.4% 2.1% 14.4% BERGEN TEANECK TWP THOMAS JEFFERSON MIDDLE 03-5150-070 05-08 SCHOOL SAMUEL M RIDGWAY MIDDLE 05-1280-070 05-08 SCHOOL FLORENCE RIVERFRONT SCHOOL 05-1520-055 04-08 40.6% 1.4% 19.4% 41.4% 1.9% 14.7% 36.8% 0.3% 12.7% BELL OAKS UPPER ELEMENTARY SCHOOL MERCHANTVILLE ELEMENTARY SCHOOL MARY E. VOLZ ELEMENTARY SCHOOL OCEAN CITY INTERMEDIATE SCHOOL HOPEWELL CREST 45.5% 2.5% 16.8% 07-3110-060 PK-08 34.0% 0.0% 13.1% 07-4590-040 PK-08 38.2% 0.8% 16.3% 09-3780-060 04-08 31.8% 0.0% 18.7% 11-2270-060 KG-08 31.8% 0.8% 22.1% MYRON L. POWELL ELEMENTARY 11-2570-030 PK-08 56.2% 3.4% SCHOOL WILLIAMSTOWN MIDDLE SCHOOL 15-3280-110 05-08 33.7% 0.2% 10.5% 12.2% COUNTY NAME DISTRICT NAME BURLINGTON EDGEWATER PARK TWP BURLINGTON FLORENCE TWP CAMDEN BELLMAWR BORO CAMDEN MERCHANTVILLE BORO CAMDEN RUNNEMEDE BORO CAPE MAY OCEAN CITY CUMBERLAND HOPEWELL TWP CUMBERLAND LAWRENCE TWP GLOUCESTER MONROE TWP SCHOOL NAME 07-0260-015 05-08 HUDSON JERSEY CITY RAFAEL DE J. CORDERO SCHOOL HUDSON NORTH BERGEN TWP FRANKLIN ELEMENTARY SCHOOL 17-3610-060 01-08 HUNTERDON HAMPTON BORO 17-2390-300 PK-08 49.9% 3.0% SpED 11.8% 16.8% 62.8% 5.8% 16.0% HAMPTON BOROUGH PUBLIC SCHOOL GILMORE J FISHER MIDDLE 19-1970-050 PK-08 33.3% 0.0% 14.8% 21-1430-060 06-08 40.5% 1.5% 17.6% RICHARD C CROCKETT MIDDLE SCHOOL THEODORE SCHOR MIDDLE SCHOOL SOUTH RIVER MIDDLE SCHOOL 21-1950-083 06-08 41.5% 1.3% 15.7% 23-4130-057 06-08 40.9% 1.0% 14.7% 23-4920-055 06-08 45.8% 2.6% 15.6% 35.2% 0.3% 16.6% 31.9% 0.1% 17.7% 42.3% 2.2% 15.7% 33-4075-055 06-08 32.5% 0.0% 19.9% MERCER EWING TWP MERCER HAMILTON TWP MIDDLESEX PISCATAWAY TWP MIDDLESEX SOUTH RIVER BORO OCEAN MANCHESTER TWP OCEAN TOMS RIVER REGIONAL PASSAIC WOODLAND PARK MANCHESTER TOWNSHIP MIDDLE 29-2940-045 06-08 SCHOOL TOMS RIVER INTERMEDIATE 29-5190-061 06-08 SCHOOL SOUTH MEMORIAL MIDDLE SCHOOL 31-5690-070 05-08 SALEM PENNSVILLE PENNSVILLE MIDDLE SCHOOL SALEM 33-5910-070 05-08 31.4% 0.0% 19.2% SOMERSET WOODSTOWN-PILESGROVE WOODSTOWN MIDDLE SCHOOL REG FRANKLIN TWP FRANKLIN MIDDLE SCHOOL 35-1610-160 07-08 48.4% 3.5% 15.7% SOMERSET SOMERVILLE BORO SOMERVILLE MIDDLE SCHOOL 35-4820-055 06-08 43.4% 2.1% 15.1% UNION LINDEN CITY MYLES J. MCMANUS MIDDLE SCHOOL 39-2660-060 06-08 47.1% 2.2% 12.5% 18