SlideShare una empresa de Scribd logo
1 de 10
Descargar para leer sin conexión
State of New Jersey
2012-13
OVERVIEW
CAPE MAY
OCEAN CITY

09-3780-070
OCEAN CITY PRIMARY SCHOOL
550 WEST AVENUE
OCEAN CITY, NEW JERSEY 08226

GRADE SPAN KG-03

This school's academic performance is high when compared to schools across the state. Additionally, its academic 1
performance is very high when compared to its peers. This school's college and career readiness significantly lags in
comparison to schools across the state. Additionally, its college and career readiness significantly lags in comparison to its
peers.
Performance Areas
Academic Achievement
College and Career Readiness

Peer Percentile

Statewide Percentile

Percent of
Targets Met

96

66

100%

3

4

Improvement Status

0%

N/A
Rationale
N/A

--N/A
Student Growth
Very High Performance is defined as being equal to or above the 80th percentile.
High Performance is defined as being between the 60th and 79.9th percentiles.
Average Performance is defined as being between the 40th and 59.9th percentiles.
Lagging Performance is defined as being between the 20th and 39.9th percentiles.
Significantly Lagging Performance is defined as being equal to or below the 19.9th percentile.

Peer Schools are schools that have similar grade levels and students with similar demographic characteristics, such as the
percentage of students qualifying for Free/Reduced Lunch, Limited English Proficiency programs or Special Education
programs.
Academic Achievement
This school outperforms 66% of schools statewide as noted
by its statewide percentile and 96% of schools educating
students with similar demographic characteristics as noted in
its peer school percentile in the performance area of
Academic Achievement. Additionally, this school is meeting
100% of its performance targets in the area of Academic
Achievement.

Academic Achievement measures the content knowledge
students have in language arts literacy and math. For
elementary and middle schools, this includes measures of
the school's proficiency rate on both the Language Arts
Literacy and Math sections of the New Jersey Assessment
of Skills and Knowledge (NJASK). A proficiency rate is
calculated by summing the count of students who scored
either proficient or advanced proficient on the assessment
and dividing by the count of valid test scores.

College and Career Readiness
This school outperforms 4% of schools statewide as noted
by its statewide percentile and 3% of schools educating
students with similar demographic characteristics as noted in
its peer school percentile in the performance area of College
and Career Readiness. Additionally, this school is meeting
0% of its performance targets in the area of College and
Career Readiness.

College and Career readiness measures the degree to
which students are demonstrating behaviors that are
indicative of future attendance and/or success in college
and careers. For all elementary and middle schools, this
includes a measurement of how many students are
chronically absent. For schools with middle school
grades, it also includes a measurement of how many
students take Algebra I in eighth grade.
State of New Jersey
2012-13
DEMOGRAPHIC INFORMATION
CAPE MAY
OCEAN CITY

09-3780-070
OCEAN CITY PRIMARY SCHOOL
550 WEST AVENUE
OCEAN CITY, NEW JERSEY 08226

GRADE SPAN KG-03

Language Diversity
This table presents the percentage of students who
primarily speak each language in their home.
2012-13

Percent

English
Spanish

This graph presents the percentages of enrollment for each
subgroup defined by the No Child Left Behind Act of 2001

Percent of Enrollment

White
Black

American
Indian

0.5%

Hispanic
Asian
American Indian
Pacific Islander
Two or More Races

Hispanic

15.9%

34
30

25

Black

5.4%

2010-11

White

76.3%

Enrollment by Gender

2011-12

17 17 17

2012-13

15

This graph presents the count of students by gender who were
'on roll' in October of each school year.

10

200

5

5
0

Pacific
Islander

0.3%

Asian

1.6%

Enrollment Trends by Program Participation

20

0.3%

Enrollment by Ethnic/Racial Subgroup

Total School Enrollment in Full Time Equivalent
2011-12
344
2012-13
371

30

0.3%

Russian

35

11.2%

Chinese

Note: "UG" represents the count of students who are 'on
roll' in this school but who are educated in ungraded
classrooms, meaning that the classrooms may contain
students from multiple grade levels.

88.3%

DISABILITY

ECONDIS

4
2 3

160

LEP

Male

120

Female

Current Year Enrollment by Program Participation 2
2012-2013

Students with Disability
Economically Disadvantaged
Students
Limited English Proficient
Students

Count of
Students

Percentage of
Enrollment

64

17%

125

4%

40
0

34%

14

80

2010-11
2011-12
2012-13

2010-11

2011-12

Male
179
186
186

2012-13

Female
144
158
185
State of New Jersey
2012-13
ACADEMIC ACHIEVEMENT
CAPE MAY
OCEAN CITY

09-3780-070
OCEAN CITY PRIMARY SCHOOL
550 WEST AVENUE
OCEAN CITY, NEW JERSEY 08226

GRADE SPAN KG-03

Academic Achievement measures the content knowledge students have in language arts literacy and math. In elementary and
middle school, this includes the outcomes of the New Jersey Assessment of Skills and Knowledge (NJASK). The first column Schoolwide Performance - in the table below includes measures of the total schoolwide proficiency rate in both language arts literacy
and math. The second column - Peer School Percentile - indicates where the school’s proficiency rate compares to its group of peer
schools. For example, a school that has a peer school percentile of 65 has a proficiency rate that is higher than 65% of its peer schools.
The third column - Statewide Percentile - indicates where the school’s proficiency rate compares to schools across the state. For
example, a school that has a statewide percentile of 30 has a proficiency rate that is higher than 30% of all schools with NJASK scores
statewide. The last column - Percent of Targets Met - presents the percentage of progress targets met as defined by the NJDOE’s
NCLB waiver.
The Summary row presents the averages of the peer school percentiles, the average of statewide percentiles and the percentage
of statewide targets met.
Peer
Percentile

Schoolwide
Performance

Academic Achievement Indicators

State
Percentile

Percent of Targets
Met

NJASK Language Arts Proficiency and above

78%

100

72

100%

NJASK Math Proficiency and above

87%

91

59

100%

96

66

100%

SUMMARY - Academic Achievement

NCLB Progress Targets - Language Arts Literacy

Proficiency Trends - Language Arts Literacy

This table presents the Progress Targets as uniquely calculated for each
subgroup in each school under NJDOE’s NCLB waiver. The methodology
- as defined by the United States Department of Education - is calculated so
that each subgroup will halve the gap between their 2011 proficiency rate
and 100% proficiency by 2017.
Subgroups
Total Valid Pass
Target Met
Scores
Rate
Target?

This graph presents the percentage of students who scored in
the Advanced Proficient, Proficient and Partially Proficient
categories of the statewide Language Arts Literacy assessment
over the prior four years.

Schoolwide

78

78.2

77

YES

White

66

81.8

81.4

YES

100

Black

-

-

--

80

Hispanic

-

-

--

American Indian

-

-

--

Asian

-

-

--

Two or More Races

-

-

--

Students with Disability

-

-

--

60

1

65

7

65

0

70

0

78

40

20

Limited English Proficient
-Students
Economically
-Disadvantaged Students
YES* = Met Progress Target(Confidence Interval Applied)
Data is presented for subgroups when the count is high enough under
NCLB suppression rules.

0

34

28

30

2009-10

2010-11

2011-12

Advanced Proficient
Partially Proficient

Proficient

22
2012-13
State of New Jersey
2012-13
ACADEMIC ACHIEVEMENT
CAPE MAY
OCEAN CITY

09-3780-070
OCEAN CITY PRIMARY SCHOOL
550 WEST AVENUE
OCEAN CITY, NEW JERSEY 08226

GRADE SPAN KG-03

NCLB Progress Targets - Math

Proficiency Trends - Math

This table presents the Progress Targets as uniquely calculated for each
subgroup in each school under NJDOE’s NCLB waiver. The
methodology - as defined by the United States Department of Education
- is calculated so that each subgroup will halve the gap between their
2011 proficiency rate and 100% proficiency by 2017.
Total Valid Pass
Subgroups
Target Met
Scores
Rate
Target?

This graph presents the percentage of students who scored in
the Advanced Proficient, Proficient and Partially Proficient
categories of the statewide Math assessment over the prior
four years.

Schoolwide

78

87.2

90

YES*

White

66

92.4

90

YES

Black

-

-

--

Hispanic

-

-

--

American Indian

-

-

--

Asian

-

-

--

Two or More Races

-

-

--

20

Students with Disability

-

-

--

0

Limited English
-Proficient Students
Economically
-Disadvantaged Students
YES* = Met Progress Target(Confidence Interval Applied)
Data is presented for subgroups when the count is high enough under
NCLB suppression rules.

100

80

42

41

37
56

60

40

35

23
2009-10

51

9
2010-11

Advanced Proficient
Partially Proficient

46
31
17

13

2011-12

2012-13

Proficient
State of New Jersey
2012-13
ACADEMIC ACHIEVEMENT
CAPE MAY
OCEAN CITY

09-3780-070
OCEAN CITY PRIMARY SCHOOL
550 WEST AVENUE
OCEAN CITY, NEW JERSEY 08226

GRADE SPAN KG-03

NJASK Proficiency Trends - Language Arts Literacy Grade Level - 03

NJASK Results - Language Arts Literacy Grade Level - 03
This table presents the grade level proficiency results, as measured by
NJASK, in Advanced Proficient, Proficient, and Partially Proficient
categories for all appropriate subgroups.
Advanced
Proficient
0%

Proficient
78%

Partially
Proficient
22%

White

0%

82%

18%

Black

-

-

-

Hispanic

-

-

This graph presents the grade level outcomes in the categories
of Advanced Proficient, Proficient, and Partially Proficient
over the last four years.

-

Subgroups
Schoolwide

American Indian

-

-

-

-

-

58%

42%

-

-

0

7

0

-

65

70

65

78

-

0%

60

-

Two or More Races

1

80

-

Asian

100

Students with Disability
Limited English Proficient Students

40
20
0

Economically Disadvantaged
0%
65%
35%
Students
Data is presented for subgroups when the count is high enough under
NCLB suppression rules.

34

28

2009-10

2010-11

Advanced Proficient

30

22

2011-12

2012-13

Proficient

Partially Proficient

2013 National Assessment Educational Progress (NAEP)
The National Assessment of Educational Progress (NAEP) is the largest national assessment of what our nation’s students know and
can do. NAEP assesses fourth-, eighth-, and twelfth-grade students in subjects such as reading, mathematics, science, and writing. The
reporting of NAEP scores on state report cards is a federal mandate. The results of NAEP are also published as the Nation’s Report
Card, and are available for the nation, states, and, in some cases, urban districts. The NAEP scores on the report card include grades
four and eight 2013 reading and math scores for New Jersey which are the last scores published. For subgroup outcomes, visit :
http://www.nj.gov/education/pr/1213/naep/naep4read.html For more information, visit <http://nces.ed.gov/nationsreportcard/>

Grade 4 Reading

State/Nation

Below Basic

Proficiency Percentages
Basic
Proficient

Advanced

All Students

State (NJ)

25

33

30

12

All Students

Nation

32

33

27

8

2013 National Assessment Educational Progress (NAEP)
The National Assessment of Educational Progress (NAEP) is the largest national assessment of what our nation’s students know and
can do. NAEP assesses fourth-, eighth-, and twelfth-grade students in subjects such as reading, mathematics, science, and writing. The
reporting of NAEP scores on state report cards is a federal mandate. The results of NAEP are also published as the Nation’s Report
Card, and are available for the nation, states, and, in some cases, urban districts. The NAEP scores on the report card include grades
four and eight 2013 reading and math scores for New Jersey which are the last scores published. For subgroup outcomes, visit :
http://www.nj.gov/education/pr/1213/naep/naep8read.html
For more information, visit <http://nces.ed.gov/nationsreportcard/>

Grade 8 Reading
All Students

State/Nation
State (NJ)

All Students

Nation

Below Basic
15
22

Proficiency Percentages
Basic
Proficient
39
40
42

32

Advanced
7
4
State of New Jersey
2012-13
ACADEMIC ACHIEVEMENT
CAPE MAY
OCEAN CITY

09-3780-070
OCEAN CITY PRIMARY SCHOOL
550 WEST AVENUE
OCEAN CITY, NEW JERSEY 08226

GRADE SPAN KG-03

NJASK Proficiency Trends - Math - Grade Level - 03

NJASK Results - MATH Grade Level - 03
This table presents the grade level proficiency results, as measured by
NJASK, in Advanced Proficient, Proficient, and Partially Proficient
categories for all appropriate subgroups.
Advanced
Partially
Proficient
Proficient
Proficient
Subgroups
Schoolwide
56%
31%
13%

This graph presents the grade level outcomes in the categories
of Advanced Proficient, Proficient, and Partially Proficient
over the last four years.

White

64%

29%

8%

Black

-

-

-

Hispanic

-

-

-

American Indian

-

-

-

60

Asian

-

-

-

40

Two or More Races

-

-

-

33%

58%

8%

-

-

-

Students with Disability
Limited English Proficient Students

100
80

37

41

42

56

35

46

51

31

20
23

Economically Disadvantaged
39%
35%
26%
Students
Data is presented for subgroups when the count is high enough under
NCLB suppression rules.

9
2010-11

17

13

2011-12

2012-13

Advanced Proficient

0

Proficient

2009-10

Partially Proficient

2013 National Assessment Educational Progress (NAEP)
The National Assessment of Educational Progress (NAEP) is the largest national assessment of what our nation’s students know and can
do. NAEP assesses fourth-, eighth-, and twelfth-grade students in subjects such as reading, mathematics, science, and writing. The
reporting of NAEP scores on state report cards is a federal mandate. The results of NAEP are also published as the Nation’s Report Card,
and are available for the nation, states, and, in some cases, urban districts. The NAEP scores on the report card include grades four and
eight 2013 reading and math scores for New Jersey which are the last scores published. For subgroup outcomes, visit :
http://www.nj.gov/education/pr/1213/naep/naep4math.html For more information, visit <http://nces.ed.gov/nationsreportcard/>

Grade 4 Math

State/Nation

Proficiency Percentages

Below Basic

Basic

Proficient Advanced

All Students

State (NJ)

13

38

39

10

All Students

Nation

17

41

34

8

2013 National Assessment Educational Progress (NAEP)
The National Assessment of Educational Progress (NAEP) is the largest national assessment of what our nation’s students know and can
do. NAEP assesses fourth-, eighth-, and twelfth-grade students in subjects such as reading, mathematics, science, and writing. The
reporting of NAEP scores on state report cards is a federal mandate. The results of NAEP are also published as the Nation’s Report Card,
and are available for the nation, states, and, in some cases, urban districts. The NAEP scores on the report card include grades four and
eight 2013 reading and math scores for New Jersey which are the last scores published.For subgroup outcomes, visit :
http://www.nj.gov/education/pr/1213/naep/naep8math.html For more information, visit <http://nces.ed.gov/nationsreportcard/>

Grade 8 Math

State/Nation

Proficiency Percentages

Below Basic

Basic

Proficient Advanced

All Students

State (NJ)

18

34

33

16

All Students

Nation

26

38

27

9
State of New Jersey
2012-13
COLLEGE AND CAREER READINESS
CAPE MAY
OCEAN CITY

09-3780-070
OCEAN CITY PRIMARY SCHOOL
550 WEST AVENUE
OCEAN CITY, NEW JERSEY 08226

GRADE SPAN KG-03

Students in both elementary and middles schools begin to demonstrate college readiness behaviors long before they even enter
high school. Among the behaviors that research has shown to be indicative of success and college and career readiness are regularly
attending school and challenging themselves with rigorous course work. The table presents the percentage of students who were
chronically absent during the prior school year. A chronically absent student is a student who was not present for any reason for more
than 10% of the total days possible for that individual student.
The first column - Schoolwide Performance - represents the outcomes for these particular indicators in this school. The second
column - Peer School Percentile - indicates how the school’s performance compares to its group of peer schools. For example, a school
whose peer school percentile is 65 in Chronic Absenteeism has a lower Chronic Absenteeism than 65% of its peer group. The third
column - Statewide Percentile - indicates how the school’s performance compares to schools across the state. The fourth column Statewide Target - provides the statewide targets for each of these indicators. The last column - Met Target? - indicates whether the
School Performance met or exceeded the statewide target.
The Summary row presents the averages of the peer school percentiles, the average of statewide percentiles and the percentage
of statewide targets met.

College and Career Readiness
Indicators

School
Performance

Chronic Absenteeism (%)

Peer Rank
(Percentile)

24%

3

4

Summary

Statewide
Target

Met Target?

6%

Statewide Rank
(Percentile)

NO
0%

Chronic Absenteeism - Number of students in the most recent school year that missed 10% or more of the instructional days in
the school year divided by the total number of students enrolled.

Absenteeism
The chart below presents the percentage of students who were
absent in each category of absence: 0 absences, 1- 5 absences, 6 10 absences, 11 - 15 absences, and more than 15 absences. An
absence is defined as being ‘not present’ and includes the days
missed regardless of whether they were determined to be excused
or unexcused by the school.
30

30

24

25

Percent Absent

22

24

20
15
10
5

1
0

0 Absences

1-5 Absences

6-10 Absences 11-15 Absences 15+ Absences

Absences

0 Absences

1-5 Absences

11-15 Absences

15+ Absences

6-10 Absences
State of New Jersey
2012-13
WITHIN SCHOOL ACHIEVEMENT GAP
CAPE MAY
OCEAN CITY

09-3780-070
OCEAN CITY PRIMARY SCHOOL
550 WEST AVENUE
OCEAN CITY, NEW JERSEY 08226

GRADE SPAN KG-03

This section of the performance report presents data about the achievement gap that exists within a school - as measured
by the difference between the students’ scale scores at the 25th and 75th percentile in the school, the so-called Interquartile
Range (IQR). Taken together with an understanding of the overall and average achievement levels in the school, the IQR furthers
an understanding of the range of student outcomes that exist in a school. A school gap smaller than the state gap indicates that
the school’s range of student outcomes is narrower than the state’s while a school gap larger than the state gap indicates that the
school’s range of student outcomes is larger than the state’s.

Grade Level - 03

Grade Level - 03

NJ ASK Language Arts 25th %ile vs 75th%ile
This table presents the scale scores associated with students
at the bottom (0th percentile), the 25th percentile, the 50th
percentile, the 75th percentile and the top (99th percentile)
of school's distribution.
Percentile

School Scale Score

State Scale Score

NJ ASK Math 25th %ile vs 75th%ile
This table presents the scale scores associated with students
at the bottom (0th percentile), the 25th percentile, the 50th
percentile, the 75th percentile and the top (99th percentile) of
school's distribution.
Percentile

School Scale Score

State Scale Score

99th

243

300

99th

300

300

75th

216

221

75th

274

264

50th

207

204

50th

250

235

25th

200

191

25th

217

201

0th

171

100

0th

125

100

Scale Score Gap - Scale Score Gap School
State
25th vs 75th Gap

16

30

Scale Score Gap - Scale Score Gap School
State
25th vs 75th Gap

57

63
State of New Jersey
2012-13
SCHOOL CLIMATE
CAPE MAY
OCEAN CITY

09-3780-070
OCEAN CITY PRIMARY SCHOOL
550 WEST AVENUE
OCEAN CITY, NEW JERSEY 08226

GRADE SPAN KG-03

Length of School Day

Instructional Time

This table presents the amount of time a
school is in session for a typical student on a
normal school day.

This table presents the amount of time
that a typical student is engaged in
instructional
activities
under
the
supervision of a certified teacher.

School
2012-13

2012-13

School

Full Time

5 Hrs. 50 Mins.

Shared Time

6 Hrs. 15 Mins.

0 Hrs. 0 Mins.

Student Suspension Rate
This table presents the percentage of students
who were suspended one or more times
during the school year.

Student Expulsions
This table presents the number of students
who were expelled from the school and
district during the school year.

School
2012-13

0.0%

School
2012-13

0

Student to Staff Ratio
This table presents the count of students per
faculty member or administrator in the school.
All staff are counted in full-time equivalents.

2012-13

School

Faculty

12

Administrators

371

7
OCEAN CITY PRIMARY SCHOOL
09-3780-070
SCHOOL PEER GROUP
This table presents the list of peer schools in alphabetical order by county name that was created specifically for this school
(highlighted in yellow). Peer schools are drawn from across the state and represent schools that have similar grade configurations
and that are educating students of similar demographic characteristics, as measured by enrollment in Free/Reduced Lunch
Programs, Limited English Proficiency or Special Education Programs.

BERGEN

CLIFFSIDE PARK BORO

SCHOOL #4

CDS
GRAD
CODE ESPAN FRPL LEP
03-0890-060 PK-06 42.5% 7.9%

BERGEN

ELMWOOD PARK

SIXTEENTH AVENUE SCHOOL

03-1345-090 KG-05 40.3% 8.0%

14.8%

BERGEN

TEANECK TWP

03-5150-130 01-04

40.8% 3.2%

19.3%

BERGEN

TEANECK TWP

03-5150-150 01-04

40.7% 6.8%

15.9%

CAMDEN

CHERRY HILL TWP

07-0800-069 KG-05 31.6% 4.2%

11.1%

CAMDEN

COLLINGSWOOD BORO

07-0940-050 KG-05 32.3% 10.8%

5.4%

CAMDEN

COLLINGSWOOD BORO

07-0940-060 KG-05 33.6% 0.0%

16.1%

CAMDEN

GLOUCESTER TWP

JAMES RUSSELL LOWELL
ELEMENTARY SCHOOL
JOHN GREENLEAF WHITTIER
ELEMENTARY SCHOOL
CLARA BARTON ELEMENTARY
SCHOOL
JAMES A. GARFIELD ELEMENTARY
SCHOOL
MARK NEWBIE ELEMENTARY
SCHOOL
CHEWS ELEMENTARY SCHOOL

07-1780-040 KG-05 31.5% 0.1%

14.2%

CAMDEN

GLOUCESTER TWP

14.2%

CAMDEN

WATERFORD TWP

LORING-FLEMMING ELEMENTARY 07-1780-090 PK-05 38.8% 6.5%
SCHOOL
THOMAS RICHARDS ELEMENTARY 07-5560-060 02-03 30.6% 0.0%

CAPE MAY

OCEAN CITY

OCEAN CITY PRIMARY SCHOOL

09-3780-070 KG-03 33.7% 3.8%

12.9%

ESSEX

BLOOMFIELD TWP

FRANKLIN ELEMENTARY

13-0410-130 KG-06 35.3% 5.8%

11.4%

ESSEX

WEST ORANGE TOWN

EDISON MIDDLE SCHOOL

13-5680-070 06

40.4% 3.2%

16.6%

HUDSON

KEARNY TOWN

ROOSEVELT

17-2410-100 PK-06 30.6% 0.0%

13.9%

MIDDLESEX

NORTH BRUNSWICK TWP

ARTHUR M. JUDD

23-3620-055 PK-05 30.0% 4.9%

10.2%

MIDDLESEX

OLD BRIDGE TWP

23-3845-105 KG-05 30.7% 10.0%

6.9%

MIDDLESEX

OLD BRIDGE TWP

23-3845-120 KG-05 46.6% 14.1%

13.1%

MIDDLESEX

PISCATAWAY TWP

23-4130-065 KG-03 37.9% 14.0%

6.3%

MIDDLESEX

SAYREVILLE BORO

23-4660-070 KG-03 32.1% 1.2%

12.1%

MONMOUTH

EATONTOWN BORO

CHEESEQUAKE ELEMENTARY
SCHOOL
MADISON PARK ELEMENTARY
SCHOOL
DWIGHT D. EISENHOWER
ELEMENTARY SCHOOL
DWIGHT D. EISENHOWER
ELEMENTARY SCHOOL
MEADOWBROOK

25-1260-080 PK-06 33.2% 0.0%

15.6%

OCEAN

BARNEGAT TWP

17.9%

OCEAN

BERKELEY TWP

ROBERT L. HORBELT
29-0185-070 KG-05 36.9% 1.2%
ELEMENTARY SCHOOL
BAYVILLE ELEMENTARY SCHOOL 29-0320-020 PK-04 35.0% 5.1%

OCEAN

BERKELEY TWP

H & M POTTER SCHOOL

29-0320-040 PK-04 37.5% 0.6%

17.2%

OCEAN

LITTLE EGG HARBOR TWP

FROG POND ELEMENTARY SCHOOL 29-2690-030 KG-06 47.7% 1.9%

22.5%

OCEAN

OCEAN TWP

29-3820-030 04-06

41.0% 0.5%

21.6%

OCEAN

OCEAN TWP

29-3820-050 PK-03 31.6% 0.3%

15.3%

OCEAN

TOMS RIVER REGIONAL

29-5190-070 KG-05 32.9% 0.9%

13.7%

OCEAN

TUCKERTON BORO

29-5220-050 PK-06 38.4% 0.6%

17.0%

SALEM

PENNSVILLE

33-4075-078 04-05

34.1% 0.4%

16.3%

SOMERSET

MANVILLE BORO

FREDERIC A. PRIFF ELEMENTARY
SCHOOL
WARETOWN ELEMENTARY
SCHOOL
EAST DOVER ELEMENTARY
SCHOOL
TUCKERTON ELEMENTARY
SCHOOL
PENN BEACH ELEMENTARY
SCHOOL
ROOSEVELT SCHOOL

35-3000-080 04-05

44.5% 2.8%

21.3%

SOMERSET

SOMERVILLE BORO

VAN DERVEER ELEMENTARY
SCHOOL

35-4820-090 PK-05 39.3% 5.5%

15.2%

COUNTY NAME

DISTRICT NAME

SCHOOL NAME

SpED
14.7%

14.0%

13.5%

Más contenido relacionado

La actualidad más candente

Class orientation 2014
Class orientation 2014Class orientation 2014
Class orientation 2014cswstyle
 
Bay_Area_Top_Schools_Report_November2015_Web
Bay_Area_Top_Schools_Report_November2015_WebBay_Area_Top_Schools_Report_November2015_Web
Bay_Area_Top_Schools_Report_November2015_WebJoel Key
 
Status of Elementary Art Education: 1997-2004
Status of Elementary Art Education: 1997-2004Status of Elementary Art Education: 1997-2004
Status of Elementary Art Education: 1997-2004Maira Jaffri
 
R M S T I T L E I P L A N
R M S T I T L E I P L A NR M S T I T L E I P L A N
R M S T I T L E I P L A NKathyRees
 
Education Statistics At A Glance 2016
Education Statistics At A Glance 2016Education Statistics At A Glance 2016
Education Statistics At A Glance 2016Akshay Kokala
 
Patterns and Trends in Educational Opportunity for Students in Juvenile Justi...
Patterns and Trends in Educational Opportunity for Students in Juvenile Justi...Patterns and Trends in Educational Opportunity for Students in Juvenile Justi...
Patterns and Trends in Educational Opportunity for Students in Juvenile Justi...Jeremy Knight
 
School pac update 2014-2015
School pac update 2014-2015School pac update 2014-2015
School pac update 2014-2015czernelt
 
An assesment of dropout rates of pupils in public primary schools in kubo div...
An assesment of dropout rates of pupils in public primary schools in kubo div...An assesment of dropout rates of pupils in public primary schools in kubo div...
An assesment of dropout rates of pupils in public primary schools in kubo div...Alexander Decker
 
Young Lives school surveys update August16
Young Lives school surveys update August16Young Lives school surveys update August16
Young Lives school surveys update August16Young Lives Oxford
 
A comparison of “well endowed” and “deprived” districts in
A comparison of “well endowed” and “deprived” districts inA comparison of “well endowed” and “deprived” districts in
A comparison of “well endowed” and “deprived” districts inAlexander Decker
 
Fall TLT board report 9 2012
Fall TLT board report 9 2012Fall TLT board report 9 2012
Fall TLT board report 9 2012ISD191
 
Successful SES application
Successful SES applicationSuccessful SES application
Successful SES applicationlillypad36502
 

La actualidad más candente (17)

Class orientation 2014
Class orientation 2014Class orientation 2014
Class orientation 2014
 
Bay_Area_Top_Schools_Report_November2015_Web
Bay_Area_Top_Schools_Report_November2015_WebBay_Area_Top_Schools_Report_November2015_Web
Bay_Area_Top_Schools_Report_November2015_Web
 
KochandcoIIMK
KochandcoIIMKKochandcoIIMK
KochandcoIIMK
 
Newark, NJ 2021
Newark, NJ 2021Newark, NJ 2021
Newark, NJ 2021
 
Status of Elementary Art Education: 1997-2004
Status of Elementary Art Education: 1997-2004Status of Elementary Art Education: 1997-2004
Status of Elementary Art Education: 1997-2004
 
Fort Worth, TX 2021
Fort Worth, TX 2021Fort Worth, TX 2021
Fort Worth, TX 2021
 
R M S T I T L E I P L A N
R M S T I T L E I P L A NR M S T I T L E I P L A N
R M S T I T L E I P L A N
 
Education Statistics At A Glance 2016
Education Statistics At A Glance 2016Education Statistics At A Glance 2016
Education Statistics At A Glance 2016
 
Patterns and Trends in Educational Opportunity for Students in Juvenile Justi...
Patterns and Trends in Educational Opportunity for Students in Juvenile Justi...Patterns and Trends in Educational Opportunity for Students in Juvenile Justi...
Patterns and Trends in Educational Opportunity for Students in Juvenile Justi...
 
School pac update 2014-2015
School pac update 2014-2015School pac update 2014-2015
School pac update 2014-2015
 
10 20-2014 tamsa-overview
10 20-2014 tamsa-overview10 20-2014 tamsa-overview
10 20-2014 tamsa-overview
 
An assesment of dropout rates of pupils in public primary schools in kubo div...
An assesment of dropout rates of pupils in public primary schools in kubo div...An assesment of dropout rates of pupils in public primary schools in kubo div...
An assesment of dropout rates of pupils in public primary schools in kubo div...
 
Young Lives school surveys update August16
Young Lives school surveys update August16Young Lives school surveys update August16
Young Lives school surveys update August16
 
A comparison of “well endowed” and “deprived” districts in
A comparison of “well endowed” and “deprived” districts inA comparison of “well endowed” and “deprived” districts in
A comparison of “well endowed” and “deprived” districts in
 
Fall TLT board report 9 2012
Fall TLT board report 9 2012Fall TLT board report 9 2012
Fall TLT board report 9 2012
 
Successful SES application
Successful SES applicationSuccessful SES application
Successful SES application
 
lasers
laserslasers
lasers
 

Similar a Ocean City Primary School report card 2013

Ocean City Primary School report card 2013-14
Ocean City Primary School report card 2013-14Ocean City Primary School report card 2013-14
Ocean City Primary School report card 2013-14OceanCityGazette
 
Ed6157 sp11leadershiptechresearcha cumspton
Ed6157 sp11leadershiptechresearcha cumsptonEd6157 sp11leadershiptechresearcha cumspton
Ed6157 sp11leadershiptechresearcha cumsptonAlana Cumpston
 
Ocean city intermediate school report card 2011 2012
Ocean city intermediate school report card 2011 2012Ocean city intermediate school report card 2011 2012
Ocean city intermediate school report card 2011 2012OceanCityGazette
 
Pipeline math
Pipeline mathPipeline math
Pipeline mathharrindl
 
Pipelinebasicskillsmath2
Pipelinebasicskillsmath2Pipelinebasicskillsmath2
Pipelinebasicskillsmath2harrindl
 
002709_2009-2010_BUILD
002709_2009-2010_BUILD002709_2009-2010_BUILD
002709_2009-2010_BUILDStephen Fujii
 
Ocean city high school report card 2011 2012
Ocean city high school report card 2011 2012Ocean city high school report card 2011 2012
Ocean city high school report card 2011 2012OceanCityGazette
 
Guape_EdSystemSouthCarolina.pptx
Guape_EdSystemSouthCarolina.pptxGuape_EdSystemSouthCarolina.pptx
Guape_EdSystemSouthCarolina.pptxIsabelGuape1
 
MAP Parent Presentation - Universal American School
MAP Parent Presentation - Universal American SchoolMAP Parent Presentation - Universal American School
MAP Parent Presentation - Universal American Schooluasdubai
 
Lakeside Middle School ESSA Presentation February 2018
Lakeside Middle School ESSA Presentation February 2018Lakeside Middle School ESSA Presentation February 2018
Lakeside Middle School ESSA Presentation February 2018Spike Cook
 
TEA Data Presentation - Group 2
TEA Data Presentation - Group 2TEA Data Presentation - Group 2
TEA Data Presentation - Group 2Rachel Reis Mourao
 
District 30 - 2011 ISAT
District 30 - 2011 ISATDistrict 30 - 2011 ISAT
District 30 - 2011 ISATAndrew Kohl
 
Accountability reports slidedoc final
Accountability reports slidedoc finalAccountability reports slidedoc final
Accountability reports slidedoc finalSREB
 
The Literacy First Framework -- Success Stories
The Literacy First Framework -- Success StoriesThe Literacy First Framework -- Success Stories
The Literacy First Framework -- Success Storiescatapultlearn
 

Similar a Ocean City Primary School report card 2013 (20)

Ocean City Primary School report card 2013-14
Ocean City Primary School report card 2013-14Ocean City Primary School report card 2013-14
Ocean City Primary School report card 2013-14
 
School_Quality_Guide_2014_EMS_X125
School_Quality_Guide_2014_EMS_X125School_Quality_Guide_2014_EMS_X125
School_Quality_Guide_2014_EMS_X125
 
K12
K12K12
K12
 
Ed6157 sp11leadershiptechresearcha cumspton
Ed6157 sp11leadershiptechresearcha cumsptonEd6157 sp11leadershiptechresearcha cumspton
Ed6157 sp11leadershiptechresearcha cumspton
 
Ocean city intermediate school report card 2011 2012
Ocean city intermediate school report card 2011 2012Ocean city intermediate school report card 2011 2012
Ocean city intermediate school report card 2011 2012
 
AP_report
AP_reportAP_report
AP_report
 
Pipeline math
Pipeline mathPipeline math
Pipeline math
 
Pipelinebasicskillsmath2
Pipelinebasicskillsmath2Pipelinebasicskillsmath2
Pipelinebasicskillsmath2
 
002709_2009-2010_BUILD
002709_2009-2010_BUILD002709_2009-2010_BUILD
002709_2009-2010_BUILD
 
Ocean city high school report card 2011 2012
Ocean city high school report card 2011 2012Ocean city high school report card 2011 2012
Ocean city high school report card 2011 2012
 
Guape_EdSystemSouthCarolina.pptx
Guape_EdSystemSouthCarolina.pptxGuape_EdSystemSouthCarolina.pptx
Guape_EdSystemSouthCarolina.pptx
 
New Orleans
New OrleansNew Orleans
New Orleans
 
MAP Parent Presentation - Universal American School
MAP Parent Presentation - Universal American SchoolMAP Parent Presentation - Universal American School
MAP Parent Presentation - Universal American School
 
Lakeside Middle School ESSA Presentation February 2018
Lakeside Middle School ESSA Presentation February 2018Lakeside Middle School ESSA Presentation February 2018
Lakeside Middle School ESSA Presentation February 2018
 
TEA Data Presentation - Group 2
TEA Data Presentation - Group 2TEA Data Presentation - Group 2
TEA Data Presentation - Group 2
 
District 30 - 2011 ISAT
District 30 - 2011 ISATDistrict 30 - 2011 ISAT
District 30 - 2011 ISAT
 
Lori PR 2012-13
Lori PR 2012-13Lori PR 2012-13
Lori PR 2012-13
 
NAEP release
NAEP releaseNAEP release
NAEP release
 
Accountability reports slidedoc final
Accountability reports slidedoc finalAccountability reports slidedoc final
Accountability reports slidedoc final
 
The Literacy First Framework -- Success Stories
The Literacy First Framework -- Success StoriesThe Literacy First Framework -- Success Stories
The Literacy First Framework -- Success Stories
 

Más de OceanCityGazette

Ocean City Council agenda March 26, 2015
Ocean City Council agenda March 26, 2015Ocean City Council agenda March 26, 2015
Ocean City Council agenda March 26, 2015OceanCityGazette
 
Ocean City Council agenda Feb. 26, 2015
Ocean City Council agenda Feb. 26, 2015Ocean City Council agenda Feb. 26, 2015
Ocean City Council agenda Feb. 26, 2015OceanCityGazette
 
2015 Ocean City municipal budget presentation Feb. 19, 2015
2015 Ocean City municipal budget presentation Feb. 19, 20152015 Ocean City municipal budget presentation Feb. 19, 2015
2015 Ocean City municipal budget presentation Feb. 19, 2015OceanCityGazette
 
Ocean City Council agenda Feb. 12, 2015
Ocean City Council agenda Feb. 12, 2015Ocean City Council agenda Feb. 12, 2015
Ocean City Council agenda Feb. 12, 2015OceanCityGazette
 
Ocean City's 2015 capital plan presentation
Ocean City's 2015 capital plan presentationOcean City's 2015 capital plan presentation
Ocean City's 2015 capital plan presentationOceanCityGazette
 
Ocean City NJ road rating map
Ocean City NJ road rating mapOcean City NJ road rating map
Ocean City NJ road rating mapOceanCityGazette
 
Ocean City capital plan presentation summary 2015
Ocean City capital plan presentation summary 2015Ocean City capital plan presentation summary 2015
Ocean City capital plan presentation summary 2015OceanCityGazette
 
Ocean City Council agenda Jan. 8, 2015
Ocean City Council agenda Jan. 8, 2015Ocean City Council agenda Jan. 8, 2015
Ocean City Council agenda Jan. 8, 2015OceanCityGazette
 
Ocean City Council agenda Dec. 29, 2014
Ocean City Council agenda Dec. 29, 2014Ocean City Council agenda Dec. 29, 2014
Ocean City Council agenda Dec. 29, 2014OceanCityGazette
 
Ocean City Council agenda Dec. 18, 2014
Ocean City Council agenda Dec. 18, 2014Ocean City Council agenda Dec. 18, 2014
Ocean City Council agenda Dec. 18, 2014OceanCityGazette
 
Ocean City Wildwood dredge spoils agreement Dec. 4, 2014
Ocean City Wildwood dredge spoils agreement Dec. 4, 2014Ocean City Wildwood dredge spoils agreement Dec. 4, 2014
Ocean City Wildwood dredge spoils agreement Dec. 4, 2014OceanCityGazette
 
Ocean City Special Improvement District budget 2015
Ocean City Special Improvement District budget 2015Ocean City Special Improvement District budget 2015
Ocean City Special Improvement District budget 2015OceanCityGazette
 
Ocean City Council agenda, Dec. 4, 2014
Ocean City Council agenda, Dec. 4, 2014Ocean City Council agenda, Dec. 4, 2014
Ocean City Council agenda, Dec. 4, 2014OceanCityGazette
 
Ocean City Council agenda, Nov. 13, 2014
Ocean City Council agenda, Nov. 13, 2014Ocean City Council agenda, Nov. 13, 2014
Ocean City Council agenda, Nov. 13, 2014OceanCityGazette
 
Ocean City Council agenda Oct. 23, 2014
Ocean City Council agenda Oct. 23, 2014Ocean City Council agenda Oct. 23, 2014
Ocean City Council agenda Oct. 23, 2014OceanCityGazette
 
Executive Order 163 Drug Addiction Task Force
Executive Order 163 Drug Addiction Task ForceExecutive Order 163 Drug Addiction Task Force
Executive Order 163 Drug Addiction Task ForceOceanCityGazette
 
Ocean City Council agenda Oct. 9, 2014
Ocean City Council agenda Oct. 9, 2014Ocean City Council agenda Oct. 9, 2014
Ocean City Council agenda Oct. 9, 2014OceanCityGazette
 
Ocean City Council agenda Sept. 25, 2014
Ocean City Council agenda Sept. 25, 2014Ocean City Council agenda Sept. 25, 2014
Ocean City Council agenda Sept. 25, 2014OceanCityGazette
 
Ocean City turf field proposal
Ocean City turf field proposalOcean City turf field proposal
Ocean City turf field proposalOceanCityGazette
 

Más de OceanCityGazette (20)

Ocean City Council agenda March 26, 2015
Ocean City Council agenda March 26, 2015Ocean City Council agenda March 26, 2015
Ocean City Council agenda March 26, 2015
 
Ocean City Council agenda Feb. 26, 2015
Ocean City Council agenda Feb. 26, 2015Ocean City Council agenda Feb. 26, 2015
Ocean City Council agenda Feb. 26, 2015
 
2015 Ocean City municipal budget presentation Feb. 19, 2015
2015 Ocean City municipal budget presentation Feb. 19, 20152015 Ocean City municipal budget presentation Feb. 19, 2015
2015 Ocean City municipal budget presentation Feb. 19, 2015
 
Ocean City Council agenda Feb. 12, 2015
Ocean City Council agenda Feb. 12, 2015Ocean City Council agenda Feb. 12, 2015
Ocean City Council agenda Feb. 12, 2015
 
Ocean City's 2015 capital plan presentation
Ocean City's 2015 capital plan presentationOcean City's 2015 capital plan presentation
Ocean City's 2015 capital plan presentation
 
Ocean City NJ road rating map
Ocean City NJ road rating mapOcean City NJ road rating map
Ocean City NJ road rating map
 
Ocean City capital plan presentation summary 2015
Ocean City capital plan presentation summary 2015Ocean City capital plan presentation summary 2015
Ocean City capital plan presentation summary 2015
 
Ocean City Council agenda Jan. 8, 2015
Ocean City Council agenda Jan. 8, 2015Ocean City Council agenda Jan. 8, 2015
Ocean City Council agenda Jan. 8, 2015
 
Ocean City Council agenda Dec. 29, 2014
Ocean City Council agenda Dec. 29, 2014Ocean City Council agenda Dec. 29, 2014
Ocean City Council agenda Dec. 29, 2014
 
Ocean City Council agenda Dec. 18, 2014
Ocean City Council agenda Dec. 18, 2014Ocean City Council agenda Dec. 18, 2014
Ocean City Council agenda Dec. 18, 2014
 
Ocean City Wildwood dredge spoils agreement Dec. 4, 2014
Ocean City Wildwood dredge spoils agreement Dec. 4, 2014Ocean City Wildwood dredge spoils agreement Dec. 4, 2014
Ocean City Wildwood dredge spoils agreement Dec. 4, 2014
 
Ocean City Special Improvement District budget 2015
Ocean City Special Improvement District budget 2015Ocean City Special Improvement District budget 2015
Ocean City Special Improvement District budget 2015
 
Ocean City Council agenda, Dec. 4, 2014
Ocean City Council agenda, Dec. 4, 2014Ocean City Council agenda, Dec. 4, 2014
Ocean City Council agenda, Dec. 4, 2014
 
Ocean City Council agenda, Nov. 13, 2014
Ocean City Council agenda, Nov. 13, 2014Ocean City Council agenda, Nov. 13, 2014
Ocean City Council agenda, Nov. 13, 2014
 
Ocean City Council agenda Oct. 23, 2014
Ocean City Council agenda Oct. 23, 2014Ocean City Council agenda Oct. 23, 2014
Ocean City Council agenda Oct. 23, 2014
 
S2460 signing statement
S2460 signing statementS2460 signing statement
S2460 signing statement
 
Executive Order 163 Drug Addiction Task Force
Executive Order 163 Drug Addiction Task ForceExecutive Order 163 Drug Addiction Task Force
Executive Order 163 Drug Addiction Task Force
 
Ocean City Council agenda Oct. 9, 2014
Ocean City Council agenda Oct. 9, 2014Ocean City Council agenda Oct. 9, 2014
Ocean City Council agenda Oct. 9, 2014
 
Ocean City Council agenda Sept. 25, 2014
Ocean City Council agenda Sept. 25, 2014Ocean City Council agenda Sept. 25, 2014
Ocean City Council agenda Sept. 25, 2014
 
Ocean City turf field proposal
Ocean City turf field proposalOcean City turf field proposal
Ocean City turf field proposal
 

Último

Brief biography of Julius Robert Oppenheimer
Brief biography of Julius Robert OppenheimerBrief biography of Julius Robert Oppenheimer
Brief biography of Julius Robert OppenheimerOmarCabrera39
 
Referendum Party 2024 Election Manifesto
Referendum Party 2024 Election ManifestoReferendum Party 2024 Election Manifesto
Referendum Party 2024 Election ManifestoSABC News
 
Top 10 Wealthiest People In The World.pdf
Top 10 Wealthiest People In The World.pdfTop 10 Wealthiest People In The World.pdf
Top 10 Wealthiest People In The World.pdfauroraaudrey4826
 
Rohan Jaitley: Central Gov't Standing Counsel for Justice
Rohan Jaitley: Central Gov't Standing Counsel for JusticeRohan Jaitley: Central Gov't Standing Counsel for Justice
Rohan Jaitley: Central Gov't Standing Counsel for JusticeAbdulGhani778830
 
Global Terrorism and its types and prevention ppt.
Global Terrorism and its types and prevention ppt.Global Terrorism and its types and prevention ppt.
Global Terrorism and its types and prevention ppt.NaveedKhaskheli1
 
Quiz for Heritage Indian including all the rounds
Quiz for Heritage Indian including all the roundsQuiz for Heritage Indian including all the rounds
Quiz for Heritage Indian including all the roundsnaxymaxyy
 
IndiaWest: Your Trusted Source for Today's Global News
IndiaWest: Your Trusted Source for Today's Global NewsIndiaWest: Your Trusted Source for Today's Global News
IndiaWest: Your Trusted Source for Today's Global NewsIndiaWest2
 
complaint-ECI-PM-media-1-Chandru.pdfra;;prfk
complaint-ECI-PM-media-1-Chandru.pdfra;;prfkcomplaint-ECI-PM-media-1-Chandru.pdfra;;prfk
complaint-ECI-PM-media-1-Chandru.pdfra;;prfkbhavenpr
 
AP Election Survey 2024: TDP-Janasena-BJP Alliance Set To Sweep Victory
AP Election Survey 2024: TDP-Janasena-BJP Alliance Set To Sweep VictoryAP Election Survey 2024: TDP-Janasena-BJP Alliance Set To Sweep Victory
AP Election Survey 2024: TDP-Janasena-BJP Alliance Set To Sweep Victoryanjanibaddipudi1
 
Opportunities, challenges, and power of media and information
Opportunities, challenges, and power of media and informationOpportunities, challenges, and power of media and information
Opportunities, challenges, and power of media and informationReyMonsales
 
57 Bidens Annihilation Nation Policy.pdf
57 Bidens Annihilation Nation Policy.pdf57 Bidens Annihilation Nation Policy.pdf
57 Bidens Annihilation Nation Policy.pdfGerald Furnkranz
 
VIP Girls Available Call or WhatsApp 9711199012
VIP Girls Available Call or WhatsApp 9711199012VIP Girls Available Call or WhatsApp 9711199012
VIP Girls Available Call or WhatsApp 9711199012ankitnayak356677
 
Manipur-Book-Final-2-compressed.pdfsal'rpk
Manipur-Book-Final-2-compressed.pdfsal'rpkManipur-Book-Final-2-compressed.pdfsal'rpk
Manipur-Book-Final-2-compressed.pdfsal'rpkbhavenpr
 

Último (13)

Brief biography of Julius Robert Oppenheimer
Brief biography of Julius Robert OppenheimerBrief biography of Julius Robert Oppenheimer
Brief biography of Julius Robert Oppenheimer
 
Referendum Party 2024 Election Manifesto
Referendum Party 2024 Election ManifestoReferendum Party 2024 Election Manifesto
Referendum Party 2024 Election Manifesto
 
Top 10 Wealthiest People In The World.pdf
Top 10 Wealthiest People In The World.pdfTop 10 Wealthiest People In The World.pdf
Top 10 Wealthiest People In The World.pdf
 
Rohan Jaitley: Central Gov't Standing Counsel for Justice
Rohan Jaitley: Central Gov't Standing Counsel for JusticeRohan Jaitley: Central Gov't Standing Counsel for Justice
Rohan Jaitley: Central Gov't Standing Counsel for Justice
 
Global Terrorism and its types and prevention ppt.
Global Terrorism and its types and prevention ppt.Global Terrorism and its types and prevention ppt.
Global Terrorism and its types and prevention ppt.
 
Quiz for Heritage Indian including all the rounds
Quiz for Heritage Indian including all the roundsQuiz for Heritage Indian including all the rounds
Quiz for Heritage Indian including all the rounds
 
IndiaWest: Your Trusted Source for Today's Global News
IndiaWest: Your Trusted Source for Today's Global NewsIndiaWest: Your Trusted Source for Today's Global News
IndiaWest: Your Trusted Source for Today's Global News
 
complaint-ECI-PM-media-1-Chandru.pdfra;;prfk
complaint-ECI-PM-media-1-Chandru.pdfra;;prfkcomplaint-ECI-PM-media-1-Chandru.pdfra;;prfk
complaint-ECI-PM-media-1-Chandru.pdfra;;prfk
 
AP Election Survey 2024: TDP-Janasena-BJP Alliance Set To Sweep Victory
AP Election Survey 2024: TDP-Janasena-BJP Alliance Set To Sweep VictoryAP Election Survey 2024: TDP-Janasena-BJP Alliance Set To Sweep Victory
AP Election Survey 2024: TDP-Janasena-BJP Alliance Set To Sweep Victory
 
Opportunities, challenges, and power of media and information
Opportunities, challenges, and power of media and informationOpportunities, challenges, and power of media and information
Opportunities, challenges, and power of media and information
 
57 Bidens Annihilation Nation Policy.pdf
57 Bidens Annihilation Nation Policy.pdf57 Bidens Annihilation Nation Policy.pdf
57 Bidens Annihilation Nation Policy.pdf
 
VIP Girls Available Call or WhatsApp 9711199012
VIP Girls Available Call or WhatsApp 9711199012VIP Girls Available Call or WhatsApp 9711199012
VIP Girls Available Call or WhatsApp 9711199012
 
Manipur-Book-Final-2-compressed.pdfsal'rpk
Manipur-Book-Final-2-compressed.pdfsal'rpkManipur-Book-Final-2-compressed.pdfsal'rpk
Manipur-Book-Final-2-compressed.pdfsal'rpk
 

Ocean City Primary School report card 2013

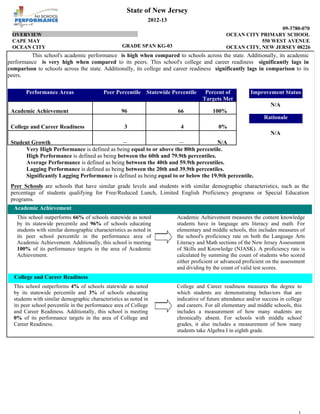
  • 1. State of New Jersey 2012-13 OVERVIEW CAPE MAY OCEAN CITY 09-3780-070 OCEAN CITY PRIMARY SCHOOL 550 WEST AVENUE OCEAN CITY, NEW JERSEY 08226 GRADE SPAN KG-03 This school's academic performance is high when compared to schools across the state. Additionally, its academic 1 performance is very high when compared to its peers. This school's college and career readiness significantly lags in comparison to schools across the state. Additionally, its college and career readiness significantly lags in comparison to its peers. Performance Areas Academic Achievement College and Career Readiness Peer Percentile Statewide Percentile Percent of Targets Met 96 66 100% 3 4 Improvement Status 0% N/A Rationale N/A --N/A Student Growth Very High Performance is defined as being equal to or above the 80th percentile. High Performance is defined as being between the 60th and 79.9th percentiles. Average Performance is defined as being between the 40th and 59.9th percentiles. Lagging Performance is defined as being between the 20th and 39.9th percentiles. Significantly Lagging Performance is defined as being equal to or below the 19.9th percentile. Peer Schools are schools that have similar grade levels and students with similar demographic characteristics, such as the percentage of students qualifying for Free/Reduced Lunch, Limited English Proficiency programs or Special Education programs. Academic Achievement This school outperforms 66% of schools statewide as noted by its statewide percentile and 96% of schools educating students with similar demographic characteristics as noted in its peer school percentile in the performance area of Academic Achievement. Additionally, this school is meeting 100% of its performance targets in the area of Academic Achievement. Academic Achievement measures the content knowledge students have in language arts literacy and math. For elementary and middle schools, this includes measures of the school's proficiency rate on both the Language Arts Literacy and Math sections of the New Jersey Assessment of Skills and Knowledge (NJASK). A proficiency rate is calculated by summing the count of students who scored either proficient or advanced proficient on the assessment and dividing by the count of valid test scores. College and Career Readiness This school outperforms 4% of schools statewide as noted by its statewide percentile and 3% of schools educating students with similar demographic characteristics as noted in its peer school percentile in the performance area of College and Career Readiness. Additionally, this school is meeting 0% of its performance targets in the area of College and Career Readiness. College and Career readiness measures the degree to which students are demonstrating behaviors that are indicative of future attendance and/or success in college and careers. For all elementary and middle schools, this includes a measurement of how many students are chronically absent. For schools with middle school grades, it also includes a measurement of how many students take Algebra I in eighth grade.
  • 2. State of New Jersey 2012-13 DEMOGRAPHIC INFORMATION CAPE MAY OCEAN CITY 09-3780-070 OCEAN CITY PRIMARY SCHOOL 550 WEST AVENUE OCEAN CITY, NEW JERSEY 08226 GRADE SPAN KG-03 Language Diversity This table presents the percentage of students who primarily speak each language in their home. 2012-13 Percent English Spanish This graph presents the percentages of enrollment for each subgroup defined by the No Child Left Behind Act of 2001 Percent of Enrollment White Black American Indian 0.5% Hispanic Asian American Indian Pacific Islander Two or More Races Hispanic 15.9% 34 30 25 Black 5.4% 2010-11 White 76.3% Enrollment by Gender 2011-12 17 17 17 2012-13 15 This graph presents the count of students by gender who were 'on roll' in October of each school year. 10 200 5 5 0 Pacific Islander 0.3% Asian 1.6% Enrollment Trends by Program Participation 20 0.3% Enrollment by Ethnic/Racial Subgroup Total School Enrollment in Full Time Equivalent 2011-12 344 2012-13 371 30 0.3% Russian 35 11.2% Chinese Note: "UG" represents the count of students who are 'on roll' in this school but who are educated in ungraded classrooms, meaning that the classrooms may contain students from multiple grade levels. 88.3% DISABILITY ECONDIS 4 2 3 160 LEP Male 120 Female Current Year Enrollment by Program Participation 2 2012-2013 Students with Disability Economically Disadvantaged Students Limited English Proficient Students Count of Students Percentage of Enrollment 64 17% 125 4% 40 0 34% 14 80 2010-11 2011-12 2012-13 2010-11 2011-12 Male 179 186 186 2012-13 Female 144 158 185
  • 3. State of New Jersey 2012-13 ACADEMIC ACHIEVEMENT CAPE MAY OCEAN CITY 09-3780-070 OCEAN CITY PRIMARY SCHOOL 550 WEST AVENUE OCEAN CITY, NEW JERSEY 08226 GRADE SPAN KG-03 Academic Achievement measures the content knowledge students have in language arts literacy and math. In elementary and middle school, this includes the outcomes of the New Jersey Assessment of Skills and Knowledge (NJASK). The first column Schoolwide Performance - in the table below includes measures of the total schoolwide proficiency rate in both language arts literacy and math. The second column - Peer School Percentile - indicates where the school’s proficiency rate compares to its group of peer schools. For example, a school that has a peer school percentile of 65 has a proficiency rate that is higher than 65% of its peer schools. The third column - Statewide Percentile - indicates where the school’s proficiency rate compares to schools across the state. For example, a school that has a statewide percentile of 30 has a proficiency rate that is higher than 30% of all schools with NJASK scores statewide. The last column - Percent of Targets Met - presents the percentage of progress targets met as defined by the NJDOE’s NCLB waiver. The Summary row presents the averages of the peer school percentiles, the average of statewide percentiles and the percentage of statewide targets met. Peer Percentile Schoolwide Performance Academic Achievement Indicators State Percentile Percent of Targets Met NJASK Language Arts Proficiency and above 78% 100 72 100% NJASK Math Proficiency and above 87% 91 59 100% 96 66 100% SUMMARY - Academic Achievement NCLB Progress Targets - Language Arts Literacy Proficiency Trends - Language Arts Literacy This table presents the Progress Targets as uniquely calculated for each subgroup in each school under NJDOE’s NCLB waiver. The methodology - as defined by the United States Department of Education - is calculated so that each subgroup will halve the gap between their 2011 proficiency rate and 100% proficiency by 2017. Subgroups Total Valid Pass Target Met Scores Rate Target? This graph presents the percentage of students who scored in the Advanced Proficient, Proficient and Partially Proficient categories of the statewide Language Arts Literacy assessment over the prior four years. Schoolwide 78 78.2 77 YES White 66 81.8 81.4 YES 100 Black - - -- 80 Hispanic - - -- American Indian - - -- Asian - - -- Two or More Races - - -- Students with Disability - - -- 60 1 65 7 65 0 70 0 78 40 20 Limited English Proficient -Students Economically -Disadvantaged Students YES* = Met Progress Target(Confidence Interval Applied) Data is presented for subgroups when the count is high enough under NCLB suppression rules. 0 34 28 30 2009-10 2010-11 2011-12 Advanced Proficient Partially Proficient Proficient 22 2012-13
  • 4. State of New Jersey 2012-13 ACADEMIC ACHIEVEMENT CAPE MAY OCEAN CITY 09-3780-070 OCEAN CITY PRIMARY SCHOOL 550 WEST AVENUE OCEAN CITY, NEW JERSEY 08226 GRADE SPAN KG-03 NCLB Progress Targets - Math Proficiency Trends - Math This table presents the Progress Targets as uniquely calculated for each subgroup in each school under NJDOE’s NCLB waiver. The methodology - as defined by the United States Department of Education - is calculated so that each subgroup will halve the gap between their 2011 proficiency rate and 100% proficiency by 2017. Total Valid Pass Subgroups Target Met Scores Rate Target? This graph presents the percentage of students who scored in the Advanced Proficient, Proficient and Partially Proficient categories of the statewide Math assessment over the prior four years. Schoolwide 78 87.2 90 YES* White 66 92.4 90 YES Black - - -- Hispanic - - -- American Indian - - -- Asian - - -- Two or More Races - - -- 20 Students with Disability - - -- 0 Limited English -Proficient Students Economically -Disadvantaged Students YES* = Met Progress Target(Confidence Interval Applied) Data is presented for subgroups when the count is high enough under NCLB suppression rules. 100 80 42 41 37 56 60 40 35 23 2009-10 51 9 2010-11 Advanced Proficient Partially Proficient 46 31 17 13 2011-12 2012-13 Proficient
  • 5. State of New Jersey 2012-13 ACADEMIC ACHIEVEMENT CAPE MAY OCEAN CITY 09-3780-070 OCEAN CITY PRIMARY SCHOOL 550 WEST AVENUE OCEAN CITY, NEW JERSEY 08226 GRADE SPAN KG-03 NJASK Proficiency Trends - Language Arts Literacy Grade Level - 03 NJASK Results - Language Arts Literacy Grade Level - 03 This table presents the grade level proficiency results, as measured by NJASK, in Advanced Proficient, Proficient, and Partially Proficient categories for all appropriate subgroups. Advanced Proficient 0% Proficient 78% Partially Proficient 22% White 0% 82% 18% Black - - - Hispanic - - This graph presents the grade level outcomes in the categories of Advanced Proficient, Proficient, and Partially Proficient over the last four years. - Subgroups Schoolwide American Indian - - - - - 58% 42% - - 0 7 0 - 65 70 65 78 - 0% 60 - Two or More Races 1 80 - Asian 100 Students with Disability Limited English Proficient Students 40 20 0 Economically Disadvantaged 0% 65% 35% Students Data is presented for subgroups when the count is high enough under NCLB suppression rules. 34 28 2009-10 2010-11 Advanced Proficient 30 22 2011-12 2012-13 Proficient Partially Proficient 2013 National Assessment Educational Progress (NAEP) The National Assessment of Educational Progress (NAEP) is the largest national assessment of what our nation’s students know and can do. NAEP assesses fourth-, eighth-, and twelfth-grade students in subjects such as reading, mathematics, science, and writing. The reporting of NAEP scores on state report cards is a federal mandate. The results of NAEP are also published as the Nation’s Report Card, and are available for the nation, states, and, in some cases, urban districts. The NAEP scores on the report card include grades four and eight 2013 reading and math scores for New Jersey which are the last scores published. For subgroup outcomes, visit : http://www.nj.gov/education/pr/1213/naep/naep4read.html For more information, visit <http://nces.ed.gov/nationsreportcard/> Grade 4 Reading State/Nation Below Basic Proficiency Percentages Basic Proficient Advanced All Students State (NJ) 25 33 30 12 All Students Nation 32 33 27 8 2013 National Assessment Educational Progress (NAEP) The National Assessment of Educational Progress (NAEP) is the largest national assessment of what our nation’s students know and can do. NAEP assesses fourth-, eighth-, and twelfth-grade students in subjects such as reading, mathematics, science, and writing. The reporting of NAEP scores on state report cards is a federal mandate. The results of NAEP are also published as the Nation’s Report Card, and are available for the nation, states, and, in some cases, urban districts. The NAEP scores on the report card include grades four and eight 2013 reading and math scores for New Jersey which are the last scores published. For subgroup outcomes, visit : http://www.nj.gov/education/pr/1213/naep/naep8read.html For more information, visit <http://nces.ed.gov/nationsreportcard/> Grade 8 Reading All Students State/Nation State (NJ) All Students Nation Below Basic 15 22 Proficiency Percentages Basic Proficient 39 40 42 32 Advanced 7 4
  • 6. State of New Jersey 2012-13 ACADEMIC ACHIEVEMENT CAPE MAY OCEAN CITY 09-3780-070 OCEAN CITY PRIMARY SCHOOL 550 WEST AVENUE OCEAN CITY, NEW JERSEY 08226 GRADE SPAN KG-03 NJASK Proficiency Trends - Math - Grade Level - 03 NJASK Results - MATH Grade Level - 03 This table presents the grade level proficiency results, as measured by NJASK, in Advanced Proficient, Proficient, and Partially Proficient categories for all appropriate subgroups. Advanced Partially Proficient Proficient Proficient Subgroups Schoolwide 56% 31% 13% This graph presents the grade level outcomes in the categories of Advanced Proficient, Proficient, and Partially Proficient over the last four years. White 64% 29% 8% Black - - - Hispanic - - - American Indian - - - 60 Asian - - - 40 Two or More Races - - - 33% 58% 8% - - - Students with Disability Limited English Proficient Students 100 80 37 41 42 56 35 46 51 31 20 23 Economically Disadvantaged 39% 35% 26% Students Data is presented for subgroups when the count is high enough under NCLB suppression rules. 9 2010-11 17 13 2011-12 2012-13 Advanced Proficient 0 Proficient 2009-10 Partially Proficient 2013 National Assessment Educational Progress (NAEP) The National Assessment of Educational Progress (NAEP) is the largest national assessment of what our nation’s students know and can do. NAEP assesses fourth-, eighth-, and twelfth-grade students in subjects such as reading, mathematics, science, and writing. The reporting of NAEP scores on state report cards is a federal mandate. The results of NAEP are also published as the Nation’s Report Card, and are available for the nation, states, and, in some cases, urban districts. The NAEP scores on the report card include grades four and eight 2013 reading and math scores for New Jersey which are the last scores published. For subgroup outcomes, visit : http://www.nj.gov/education/pr/1213/naep/naep4math.html For more information, visit <http://nces.ed.gov/nationsreportcard/> Grade 4 Math State/Nation Proficiency Percentages Below Basic Basic Proficient Advanced All Students State (NJ) 13 38 39 10 All Students Nation 17 41 34 8 2013 National Assessment Educational Progress (NAEP) The National Assessment of Educational Progress (NAEP) is the largest national assessment of what our nation’s students know and can do. NAEP assesses fourth-, eighth-, and twelfth-grade students in subjects such as reading, mathematics, science, and writing. The reporting of NAEP scores on state report cards is a federal mandate. The results of NAEP are also published as the Nation’s Report Card, and are available for the nation, states, and, in some cases, urban districts. The NAEP scores on the report card include grades four and eight 2013 reading and math scores for New Jersey which are the last scores published.For subgroup outcomes, visit : http://www.nj.gov/education/pr/1213/naep/naep8math.html For more information, visit <http://nces.ed.gov/nationsreportcard/> Grade 8 Math State/Nation Proficiency Percentages Below Basic Basic Proficient Advanced All Students State (NJ) 18 34 33 16 All Students Nation 26 38 27 9
  • 7. State of New Jersey 2012-13 COLLEGE AND CAREER READINESS CAPE MAY OCEAN CITY 09-3780-070 OCEAN CITY PRIMARY SCHOOL 550 WEST AVENUE OCEAN CITY, NEW JERSEY 08226 GRADE SPAN KG-03 Students in both elementary and middles schools begin to demonstrate college readiness behaviors long before they even enter high school. Among the behaviors that research has shown to be indicative of success and college and career readiness are regularly attending school and challenging themselves with rigorous course work. The table presents the percentage of students who were chronically absent during the prior school year. A chronically absent student is a student who was not present for any reason for more than 10% of the total days possible for that individual student. The first column - Schoolwide Performance - represents the outcomes for these particular indicators in this school. The second column - Peer School Percentile - indicates how the school’s performance compares to its group of peer schools. For example, a school whose peer school percentile is 65 in Chronic Absenteeism has a lower Chronic Absenteeism than 65% of its peer group. The third column - Statewide Percentile - indicates how the school’s performance compares to schools across the state. The fourth column Statewide Target - provides the statewide targets for each of these indicators. The last column - Met Target? - indicates whether the School Performance met or exceeded the statewide target. The Summary row presents the averages of the peer school percentiles, the average of statewide percentiles and the percentage of statewide targets met. College and Career Readiness Indicators School Performance Chronic Absenteeism (%) Peer Rank (Percentile) 24% 3 4 Summary Statewide Target Met Target? 6% Statewide Rank (Percentile) NO 0% Chronic Absenteeism - Number of students in the most recent school year that missed 10% or more of the instructional days in the school year divided by the total number of students enrolled. Absenteeism The chart below presents the percentage of students who were absent in each category of absence: 0 absences, 1- 5 absences, 6 10 absences, 11 - 15 absences, and more than 15 absences. An absence is defined as being ‘not present’ and includes the days missed regardless of whether they were determined to be excused or unexcused by the school. 30 30 24 25 Percent Absent 22 24 20 15 10 5 1 0 0 Absences 1-5 Absences 6-10 Absences 11-15 Absences 15+ Absences Absences 0 Absences 1-5 Absences 11-15 Absences 15+ Absences 6-10 Absences
  • 8. State of New Jersey 2012-13 WITHIN SCHOOL ACHIEVEMENT GAP CAPE MAY OCEAN CITY 09-3780-070 OCEAN CITY PRIMARY SCHOOL 550 WEST AVENUE OCEAN CITY, NEW JERSEY 08226 GRADE SPAN KG-03 This section of the performance report presents data about the achievement gap that exists within a school - as measured by the difference between the students’ scale scores at the 25th and 75th percentile in the school, the so-called Interquartile Range (IQR). Taken together with an understanding of the overall and average achievement levels in the school, the IQR furthers an understanding of the range of student outcomes that exist in a school. A school gap smaller than the state gap indicates that the school’s range of student outcomes is narrower than the state’s while a school gap larger than the state gap indicates that the school’s range of student outcomes is larger than the state’s. Grade Level - 03 Grade Level - 03 NJ ASK Language Arts 25th %ile vs 75th%ile This table presents the scale scores associated with students at the bottom (0th percentile), the 25th percentile, the 50th percentile, the 75th percentile and the top (99th percentile) of school's distribution. Percentile School Scale Score State Scale Score NJ ASK Math 25th %ile vs 75th%ile This table presents the scale scores associated with students at the bottom (0th percentile), the 25th percentile, the 50th percentile, the 75th percentile and the top (99th percentile) of school's distribution. Percentile School Scale Score State Scale Score 99th 243 300 99th 300 300 75th 216 221 75th 274 264 50th 207 204 50th 250 235 25th 200 191 25th 217 201 0th 171 100 0th 125 100 Scale Score Gap - Scale Score Gap School State 25th vs 75th Gap 16 30 Scale Score Gap - Scale Score Gap School State 25th vs 75th Gap 57 63
  • 9. State of New Jersey 2012-13 SCHOOL CLIMATE CAPE MAY OCEAN CITY 09-3780-070 OCEAN CITY PRIMARY SCHOOL 550 WEST AVENUE OCEAN CITY, NEW JERSEY 08226 GRADE SPAN KG-03 Length of School Day Instructional Time This table presents the amount of time a school is in session for a typical student on a normal school day. This table presents the amount of time that a typical student is engaged in instructional activities under the supervision of a certified teacher. School 2012-13 2012-13 School Full Time 5 Hrs. 50 Mins. Shared Time 6 Hrs. 15 Mins. 0 Hrs. 0 Mins. Student Suspension Rate This table presents the percentage of students who were suspended one or more times during the school year. Student Expulsions This table presents the number of students who were expelled from the school and district during the school year. School 2012-13 0.0% School 2012-13 0 Student to Staff Ratio This table presents the count of students per faculty member or administrator in the school. All staff are counted in full-time equivalents. 2012-13 School Faculty 12 Administrators 371 7
  • 10. OCEAN CITY PRIMARY SCHOOL 09-3780-070 SCHOOL PEER GROUP This table presents the list of peer schools in alphabetical order by county name that was created specifically for this school (highlighted in yellow). Peer schools are drawn from across the state and represent schools that have similar grade configurations and that are educating students of similar demographic characteristics, as measured by enrollment in Free/Reduced Lunch Programs, Limited English Proficiency or Special Education Programs. BERGEN CLIFFSIDE PARK BORO SCHOOL #4 CDS GRAD CODE ESPAN FRPL LEP 03-0890-060 PK-06 42.5% 7.9% BERGEN ELMWOOD PARK SIXTEENTH AVENUE SCHOOL 03-1345-090 KG-05 40.3% 8.0% 14.8% BERGEN TEANECK TWP 03-5150-130 01-04 40.8% 3.2% 19.3% BERGEN TEANECK TWP 03-5150-150 01-04 40.7% 6.8% 15.9% CAMDEN CHERRY HILL TWP 07-0800-069 KG-05 31.6% 4.2% 11.1% CAMDEN COLLINGSWOOD BORO 07-0940-050 KG-05 32.3% 10.8% 5.4% CAMDEN COLLINGSWOOD BORO 07-0940-060 KG-05 33.6% 0.0% 16.1% CAMDEN GLOUCESTER TWP JAMES RUSSELL LOWELL ELEMENTARY SCHOOL JOHN GREENLEAF WHITTIER ELEMENTARY SCHOOL CLARA BARTON ELEMENTARY SCHOOL JAMES A. GARFIELD ELEMENTARY SCHOOL MARK NEWBIE ELEMENTARY SCHOOL CHEWS ELEMENTARY SCHOOL 07-1780-040 KG-05 31.5% 0.1% 14.2% CAMDEN GLOUCESTER TWP 14.2% CAMDEN WATERFORD TWP LORING-FLEMMING ELEMENTARY 07-1780-090 PK-05 38.8% 6.5% SCHOOL THOMAS RICHARDS ELEMENTARY 07-5560-060 02-03 30.6% 0.0% CAPE MAY OCEAN CITY OCEAN CITY PRIMARY SCHOOL 09-3780-070 KG-03 33.7% 3.8% 12.9% ESSEX BLOOMFIELD TWP FRANKLIN ELEMENTARY 13-0410-130 KG-06 35.3% 5.8% 11.4% ESSEX WEST ORANGE TOWN EDISON MIDDLE SCHOOL 13-5680-070 06 40.4% 3.2% 16.6% HUDSON KEARNY TOWN ROOSEVELT 17-2410-100 PK-06 30.6% 0.0% 13.9% MIDDLESEX NORTH BRUNSWICK TWP ARTHUR M. JUDD 23-3620-055 PK-05 30.0% 4.9% 10.2% MIDDLESEX OLD BRIDGE TWP 23-3845-105 KG-05 30.7% 10.0% 6.9% MIDDLESEX OLD BRIDGE TWP 23-3845-120 KG-05 46.6% 14.1% 13.1% MIDDLESEX PISCATAWAY TWP 23-4130-065 KG-03 37.9% 14.0% 6.3% MIDDLESEX SAYREVILLE BORO 23-4660-070 KG-03 32.1% 1.2% 12.1% MONMOUTH EATONTOWN BORO CHEESEQUAKE ELEMENTARY SCHOOL MADISON PARK ELEMENTARY SCHOOL DWIGHT D. EISENHOWER ELEMENTARY SCHOOL DWIGHT D. EISENHOWER ELEMENTARY SCHOOL MEADOWBROOK 25-1260-080 PK-06 33.2% 0.0% 15.6% OCEAN BARNEGAT TWP 17.9% OCEAN BERKELEY TWP ROBERT L. HORBELT 29-0185-070 KG-05 36.9% 1.2% ELEMENTARY SCHOOL BAYVILLE ELEMENTARY SCHOOL 29-0320-020 PK-04 35.0% 5.1% OCEAN BERKELEY TWP H & M POTTER SCHOOL 29-0320-040 PK-04 37.5% 0.6% 17.2% OCEAN LITTLE EGG HARBOR TWP FROG POND ELEMENTARY SCHOOL 29-2690-030 KG-06 47.7% 1.9% 22.5% OCEAN OCEAN TWP 29-3820-030 04-06 41.0% 0.5% 21.6% OCEAN OCEAN TWP 29-3820-050 PK-03 31.6% 0.3% 15.3% OCEAN TOMS RIVER REGIONAL 29-5190-070 KG-05 32.9% 0.9% 13.7% OCEAN TUCKERTON BORO 29-5220-050 PK-06 38.4% 0.6% 17.0% SALEM PENNSVILLE 33-4075-078 04-05 34.1% 0.4% 16.3% SOMERSET MANVILLE BORO FREDERIC A. PRIFF ELEMENTARY SCHOOL WARETOWN ELEMENTARY SCHOOL EAST DOVER ELEMENTARY SCHOOL TUCKERTON ELEMENTARY SCHOOL PENN BEACH ELEMENTARY SCHOOL ROOSEVELT SCHOOL 35-3000-080 04-05 44.5% 2.8% 21.3% SOMERSET SOMERVILLE BORO VAN DERVEER ELEMENTARY SCHOOL 35-4820-090 PK-05 39.3% 5.5% 15.2% COUNTY NAME DISTRICT NAME SCHOOL NAME SpED 14.7% 14.0% 13.5%