SlideShare una empresa de Scribd logo
1 de 1
Descargar para leer sin conexión
Changes in Land Cover and Population in
Topsham, Maine
Paul Morris | Faculty Member: Professor Vinton Valentine, Geography-Anthropology | University of Southern Maine
Introduction
The purpose of this project is to examine land cover change and
population change in Topsham, Maine from 1996 to 2010. Following
the closure of the Naval Air Station Brunswick (NAS Brunswick), it
seems as though the population of the neighboring town, Topsham
has decreased in recent years; however, despite this population
decrease, there appears to be more and more built-up areas and less
forest cover. Therefore, this study seeks to answer this question: How
is population change related to land cover change in terms of built-up
and forest land use/cover? I hypothesize that the presence of built-up
land will increase in a significant manner despite the decline in
population. The findings of the project will also be compared to
Topsham’s Comprehensive Plan.
Data
Analysis and Interpretation
Results
References
Acknowledgements
Various data were used in the evaluation of Topsham’s land cover and
population over time from 1996 to 2010. Land cover data sets were
downloaded from the National Oceanic and Atmospheric
Administration’s (NOAA) Office for Coastal Management website
(http://coast.noaa.gov/ccapftp/). Four land cover data sets were used
from the years, 1996, 2001, 2006, and 2010. Census block data from
the years of 2000 and 2010 were downloaded from the Maine Office of
Geographic Information Systems (MEGIS) website. The assistant
planner for Topsham, Rod Melanson supplied the shapefiles for a
projected growth zone, a projected rural zone, and a divider between
the two areas. The 2005 Topsham Comprehensive Plan was also
used, which split Topsham into a development zone and a rural zone.
Data. Retrieved December 12, 2014, from http://coast.noaa.gov/ccapftp/.
Maine Office of GIS Data Catalog. (2011). Retrieved December 12, 2014,
from http://www.maine.gov/megis/catalog/.
Topsham Town Office.
If the shapefile containing the future land use plan (Figure 5) from
the 2005 Topsham Comprehensive Plan could be obtained, then
growth areas could be looked at more closely. Overlays showing
the land cover differences between years could also help identify
where exactly land cover change is occurring.
The area of developed land increased significantly from 1996 to
2010 while the amount of forested land declined by a fair amount.
This was accompanied by a population drop from 9,100 to 8,784
people in the same time frame. Development in both the growth
and rural zones increased significantly. Forest in the growth area
decreased significantly while in the rural area, it decreased by
1.84%. There were also several small areas outside of the growth
zone that saw increases in developed land. There are many other
studies attributing population growth to increases in developed
land. However, as shown by this data, this is not always true at a
smaller scale. The large increase in developed land despite the
decrease in population could be partly related to the declining
business sector in the neighboring town of Brunswick’s Cook’s
Corner. However, despite the recent decline in population, there
does appear to be some new residential developments after 2005.
Thanks to Professor Vinton Valentine, Rod Melanson, the Assistant Planner
for Topsham, and my GEO 481: Applications in GIS 2 class for suggestions,
resources, and help with the project.
The land cover in Topsham Maine makes some significant changes
and some minor changes between the years of 1996 and 2010. From
1996 to 2010, developed area increased by 24.75% and forested
area decreased by 5.05%. One statistic that stands out is from 2001
to 2006, developed area increased by 14.17%. It is worth noting that
the land cover for the year of 2001 contains 162 km2 more area than
the other years. However, this only represents an error of less than
.18%. The population of Topsham in 2000 was 9,100 and fell to 8,784
by 2010, representing a 3.60% decrease in population. This shows a
negative correlation between population growth and developed land
growth.
10/9/2005
Figure 1: 1996 Topsham Land Cover Figure 2: 2001 Topsham Land Cover
Figure 3: 2006 Topsham Land Cover Figure 4: 2010 Topsham Land Cover
Figure 5: 2005 Future Land Use plan
Table 1: Land Cover Statistics Table 2: Land Cover Statistics in Growth and Rural Zones
Further Steps
Figure 6: Topsham

Más contenido relacionado

Similar a Land Cover and Population Changes in Topsham, ME from 1996-2010

Colleen Gabel Independent Study Poster
Colleen Gabel Independent Study PosterColleen Gabel Independent Study Poster
Colleen Gabel Independent Study PosterColleen Gabel
 
Analyzing human population growth
Analyzing human population growthAnalyzing human population growth
Analyzing human population growthChristopher Vetrano
 
GIS internship Poster pdf
GIS internship Poster pdfGIS internship Poster pdf
GIS internship Poster pdfBen Bruening
 
Issues In Urban Hydrogeology
Issues In Urban HydrogeologyIssues In Urban Hydrogeology
Issues In Urban HydrogeologyMike Dobbins
 
Modified Flash Flood Potential Index
Modified Flash Flood Potential IndexModified Flash Flood Potential Index
Modified Flash Flood Potential IndexGabriel Lazar
 
2011 grl xu_samanta_etal_main_r_final
2011 grl xu_samanta_etal_main_r_final2011 grl xu_samanta_etal_main_r_final
2011 grl xu_samanta_etal_main_r_finalSérgio Sacani
 
Advancing the Use of Earth Observation Systems for the Assessment of Sustaina...
Advancing the Use of Earth Observation Systems for the Assessment of Sustaina...Advancing the Use of Earth Observation Systems for the Assessment of Sustaina...
Advancing the Use of Earth Observation Systems for the Assessment of Sustaina...rsmahabir
 
Final Pedernales Poster
Final Pedernales PosterFinal Pedernales Poster
Final Pedernales PosterKelly Blanton
 
L03401071075
L03401071075L03401071075
L03401071075theijes
 
Response_to_Thompson_report
Response_to_Thompson_reportResponse_to_Thompson_report
Response_to_Thompson_reportPeter Spies
 

Similar a Land Cover and Population Changes in Topsham, ME from 1996-2010 (12)

Colleen Gabel Independent Study Poster
Colleen Gabel Independent Study PosterColleen Gabel Independent Study Poster
Colleen Gabel Independent Study Poster
 
Analyzing human population growth
Analyzing human population growthAnalyzing human population growth
Analyzing human population growth
 
GIS internship Poster pdf
GIS internship Poster pdfGIS internship Poster pdf
GIS internship Poster pdf
 
Issues In Urban Hydrogeology
Issues In Urban HydrogeologyIssues In Urban Hydrogeology
Issues In Urban Hydrogeology
 
Modified Flash Flood Potential Index
Modified Flash Flood Potential IndexModified Flash Flood Potential Index
Modified Flash Flood Potential Index
 
2011 grl xu_samanta_etal_main_r_final
2011 grl xu_samanta_etal_main_r_final2011 grl xu_samanta_etal_main_r_final
2011 grl xu_samanta_etal_main_r_final
 
Advancing the Use of Earth Observation Systems for the Assessment of Sustaina...
Advancing the Use of Earth Observation Systems for the Assessment of Sustaina...Advancing the Use of Earth Observation Systems for the Assessment of Sustaina...
Advancing the Use of Earth Observation Systems for the Assessment of Sustaina...
 
Final Pedernales Poster
Final Pedernales PosterFinal Pedernales Poster
Final Pedernales Poster
 
L03401071075
L03401071075L03401071075
L03401071075
 
Response_to_Thompson_report
Response_to_Thompson_reportResponse_to_Thompson_report
Response_to_Thompson_report
 
Poster Presentations
Poster PresentationsPoster Presentations
Poster Presentations
 
FINALFINAL
FINALFINALFINALFINAL
FINALFINAL
 

Land Cover and Population Changes in Topsham, ME from 1996-2010

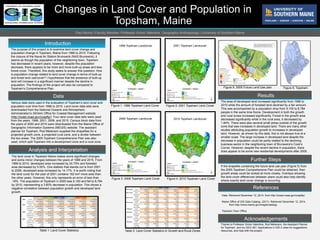
  • 1. Changes in Land Cover and Population in Topsham, Maine Paul Morris | Faculty Member: Professor Vinton Valentine, Geography-Anthropology | University of Southern Maine Introduction The purpose of this project is to examine land cover change and population change in Topsham, Maine from 1996 to 2010. Following the closure of the Naval Air Station Brunswick (NAS Brunswick), it seems as though the population of the neighboring town, Topsham has decreased in recent years; however, despite this population decrease, there appears to be more and more built-up areas and less forest cover. Therefore, this study seeks to answer this question: How is population change related to land cover change in terms of built-up and forest land use/cover? I hypothesize that the presence of built-up land will increase in a significant manner despite the decline in population. The findings of the project will also be compared to Topsham’s Comprehensive Plan. Data Analysis and Interpretation Results References Acknowledgements Various data were used in the evaluation of Topsham’s land cover and population over time from 1996 to 2010. Land cover data sets were downloaded from the National Oceanic and Atmospheric Administration’s (NOAA) Office for Coastal Management website (http://coast.noaa.gov/ccapftp/). Four land cover data sets were used from the years, 1996, 2001, 2006, and 2010. Census block data from the years of 2000 and 2010 were downloaded from the Maine Office of Geographic Information Systems (MEGIS) website. The assistant planner for Topsham, Rod Melanson supplied the shapefiles for a projected growth zone, a projected rural zone, and a divider between the two areas. The 2005 Topsham Comprehensive Plan was also used, which split Topsham into a development zone and a rural zone. Data. Retrieved December 12, 2014, from http://coast.noaa.gov/ccapftp/. Maine Office of GIS Data Catalog. (2011). Retrieved December 12, 2014, from http://www.maine.gov/megis/catalog/. Topsham Town Office. If the shapefile containing the future land use plan (Figure 5) from the 2005 Topsham Comprehensive Plan could be obtained, then growth areas could be looked at more closely. Overlays showing the land cover differences between years could also help identify where exactly land cover change is occurring. The area of developed land increased significantly from 1996 to 2010 while the amount of forested land declined by a fair amount. This was accompanied by a population drop from 9,100 to 8,784 people in the same time frame. Development in both the growth and rural zones increased significantly. Forest in the growth area decreased significantly while in the rural area, it decreased by 1.84%. There were also several small areas outside of the growth zone that saw increases in developed land. There are many other studies attributing population growth to increases in developed land. However, as shown by this data, this is not always true at a smaller scale. The large increase in developed land despite the decrease in population could be partly related to the declining business sector in the neighboring town of Brunswick’s Cook’s Corner. However, despite the recent decline in population, there does appear to be some new residential developments after 2005. Thanks to Professor Vinton Valentine, Rod Melanson, the Assistant Planner for Topsham, and my GEO 481: Applications in GIS 2 class for suggestions, resources, and help with the project. The land cover in Topsham Maine makes some significant changes and some minor changes between the years of 1996 and 2010. From 1996 to 2010, developed area increased by 24.75% and forested area decreased by 5.05%. One statistic that stands out is from 2001 to 2006, developed area increased by 14.17%. It is worth noting that the land cover for the year of 2001 contains 162 km2 more area than the other years. However, this only represents an error of less than .18%. The population of Topsham in 2000 was 9,100 and fell to 8,784 by 2010, representing a 3.60% decrease in population. This shows a negative correlation between population growth and developed land growth. 10/9/2005 Figure 1: 1996 Topsham Land Cover Figure 2: 2001 Topsham Land Cover Figure 3: 2006 Topsham Land Cover Figure 4: 2010 Topsham Land Cover Figure 5: 2005 Future Land Use plan Table 1: Land Cover Statistics Table 2: Land Cover Statistics in Growth and Rural Zones Further Steps Figure 6: Topsham