Use of the PerkinElmer TMA 4000 to Perform Standard Test Methods in the Electronics Industry
•
0 recomendaciones•1,051 vistas

This application note demonstrates the PerkinElmer TMA 4000 as a method to measure thermal expansion in electronics using standard test methods. Learn more about the TMA 4000: http://bit.ly/1kwGYbY

Recomendados
Más contenido relacionado
La actualidad más candente
La actualidad más candente (9)
Similar a Use of the PerkinElmer TMA 4000 to Perform Standard Test Methods in the Electronics Industry
Similar a Use of the PerkinElmer TMA 4000 to Perform Standard Test Methods in the Electronics Industry (20)
Más de PerkinElmer, Inc.
Más de PerkinElmer, Inc. (20)
Último
Último (20)
Use of the PerkinElmer TMA 4000 to Perform Standard Test Methods in the Electronics Industry
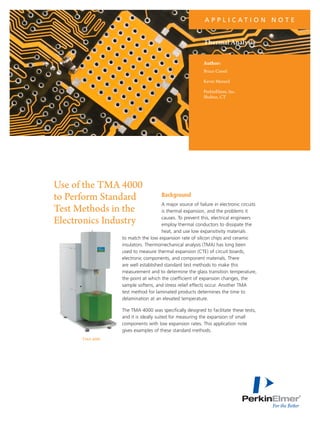
- 1. A P P L I C AT I O N N O T E Thermal Analysis Author: Bruce Cassel Kevin Menard PerkinElmer, Inc. Shelton, CT Use of the TMA 4000 to Perform Standard Test Methods in the Electronics Industry Background A major source of failure in electronic circuits is thermal expansion, and the problems it causes. To prevent this, electrical engineers employ thermal conductors to dissipate the heat, and use low expansitivity materials to match the low expansion rate of silicon chips and ceramic insulators. Thermomechanical analysis (TMA) has long been used to measure thermal expansion (CTE) of circuit boards, electronic components, and component materials. There are well established standard test methods to make this measurement and to determine the glass transition temperature, the point at which the coefficient of expansion changes, the sample softens, and stress relief effects occur. Another TMA test method for laminated products determines the time to delamination at an elevated temperature. The TMA 4000 was specifically designed to facilitate these tests, and it is ideally suited for measuring the expansion of small components with low expansion rates. This application note gives examples of these standard methods. TMA 4000
- 2. Experimental The data below was obtained using standard TMA procedures: nitrogen purge, 5 or 10 °C/min heating rates, and furnace cold sink controlled to 15 °C using a chilled water circulator. How the TMA 4000 is optimized for sensitive CTE analysis • emperature controlled, high-sensitivity position T transducer gives ultimate sensitivity • amped probe suspension minimizes environmental D noise error and protects quartzware Results • igh aspect furnace is robust and results in reduced H temperature gradients Z-Axis CTE of a 0.33 mm thick PC board • oftware designed for routine standardized testing S The signal analyzed to obtain CTE is proportional to the height of the sample being analyzed, so measuring the expansion of a sample only 0.33 mm high poses a sensitivity challenge for any TMA. The protocol followed was that of IPC-TM-6502.4.24c, Glass Transition Temperature and Z-Axis Thermal Expansion by TMA.1 This protocol provides for a sample geometry of multiple layers of circuit board to achieve a sample height of at least 0.5 mm. A piece of a circuit board was cut from the corner of a sheet containing multiple small printed circuits (Figure 1). It was measured in the X, Y and Z directions using a micrometer. In the Z-direction it was analyzed as a two layer sandwich which brought the expanding dimension up to 0.66 mm sample height. The specimen was analyzed in this axis using the flat tip penetration probe with the sample on a small sapphire pedestal so that edge effects could be minimized without undue sample preparation. See Figure 1. (Baseline subtraction removed the effect of the pedestal.) The protocol for this analysis was followed, except that the sample was conditioned only by heating in the TMA to observe the response of the sample to the initial heat and to ascertain the initial glass transition temperature. Then the sample was rerun to obtain the CTE of the sample below and above the glass transition temperature (Tg). Tg is the temperature of the onset of molecular mobility associated with the lowering of the modulus and an increase in the CTE. This Tg is obtained by TMA as an intersection of the lines drawn through the expansion data below and above this region. See Figure 2. How analyzed to minimize edge effects • Samples cut with razor • Edges sanded • Sample placed on sapphire disk • Flat tip penetration probe • aseline run without the sample B Measuring geometry to minimize edge effects Figure 1. Sample geometry Figure 2. PC chip Z-axis analysis Time to Delamination The final test performed on this sample in this Z-axis dimension is that of the IPC-TM-650 number 2.4.24.1, Time to Delamination test method.1 In this test the sample as shown in Figure 1 is heated to an elevated temperature of 265 °C and held isothermally until delamination failure. Figure 3 shows such a test using the TMA 4000. Figure 3. Time to Delamination Test 2
- 3. XY-Axis CTE of the 0.33 mm thick PC board Figure 4. PC chip XY expansion This sample was also analyzed for the expansion of the PC chip in the XY plane using the IPC protocol: 2.4.41 Coefficient of Linear Thermal Expansion of Electrical Insulating Materials, a method based on the ASTM method D696 but adapted for smaller dimensioned sample specimens.1 Again the sample was not treated to any chemical cleaning or etching prior to analysis. It was analyzed using the expansion probe and did not require baseline subtraction. Figure 4 shows the CTE and Tg analysis in the XY plane. Notice the much lower CTE and lack of evidence of Tg thus indicating the effectiveness of the glass fiber filler (and also cladding) to suppress expansion in the circuit plane. Polyimide flexible circuit substrate Polyimide (PI) is a high temperature plastic used as a flexible connector between circuit boards. Conductive traces can be printed on it, and it is stable with respect to deterioration. Moreover, the glass transition is high, meaning that the dimensional stability is predictable and low up to that temperature. The standard method which was used is: IPC-TM-650 2.4.24.5 Glass Transition Temperature and Thermal Expansion of Materials Used in High Density Interconnection (HDI) and Microvias - TMA Method.1 Figure 5. Film sample mounted in extension. The furnace is in the Load position. Figure 6. CTE and Tg of PI film in the machine direction Strips from the 30 micron thick PI film sample were cut in both the machine and transverse directions using a razor knife. Each was analyzed in extension (geometry similar to Figure 5) after using a special mounting fixture to ensure perpendicular mounting without wrinkles. The sample was thermally conditioned by heating iteratively to higher temperatures to set the polymer. The analysis after conditioning is shown in Figure 6, where a baseline has been subtracted prior to CTE determination to remove the effect of the expansion of the mounting clips. The baseline was run using a sample of fused quartz whose expansion matches that of the furnace support. Figure 7 shows PI data run using the same conditions but this time analyzing a sample cut perpendicular to the machine direction. Figure 7. CTE of PI film in the transverse direction 3
- 4. Summary Challenging samples from the electronics industry have been analyzed with the TMA 4000 using standard methods. The results show that that the TMA 4000 is able to perform the measurements simply and accurately. The technology employed by the TMA 4000 is time-tested and selected for sensitivity, reliability and low maintenance. References 1. PC-TM-650 TEST METHODS MANUAL, The Institute for Interconnecting and Packaging Electronic Circuits, 2215 Sanders I Road, Northbrook, IL 60062-6135 PerkinElmer, Inc. 940 Winter Street Waltham, MA 02451 USA P: (800) 762-4000 or (+1) 203-925-4602 www.perkinelmer.com For a complete listing of our global offices, visit www.perkinelmer.com/ContactUs Copyright ©2013, PerkinElmer, Inc. All rights reserved. PerkinElmer® is a registered trademark of PerkinElmer, Inc. All other trademarks are the property of their respective owners. 011176_01