SlideShare una empresa de Scribd logo
1 de 6
Descargar para leer sin conexión
Dutch Postwar Economic Performance Compared to the U.S. 
U.S. Dutch Gross Domestic Product comparison 
Graph one shows the developments for both the U.S. and The Netherlands in GDPpc and they show a similar trend throughout the years (1947-2010). However the U.S. seems to widen a gap from the late 70s. 
Graph 1 Comparison of GDP (1990 int. GK$) Developments between The Netherlands and the Unites States after WWII (source: Maddison Project Database) 
When looking at the absolute difference between the GDPpc of both countries in the second graph the slight slowdown of the Dutch GDPpc compared to the U.S. during the end of the 70s becomes clearer. Till the end of the 70s the difference between the countries stays at a range of roughly 3000- 4000 $ pc, but after this the difference increased in the 80 to stabilize at a range between the 5000 and 8000 pc. 
0 
5.000 
10.000 
15.000 
20.000 
25.000 
30.000 
35.000 
Comparison of GDP (1990 int. GK$) Developments between The Netherlands and the United States after WWII 
United States 
The Netherlands
Graph 2 Absolute Differences between the U.S. and Dutch GDP per capita per year (source: Maddison Project Database)1 
The third graph shows the size of the Dutch GDPpc compared to the U.S. GDPpc (U.S. GDPpc is 1,0 at the vertical axis). This graph shows us that the Dutch GDPpc has been between the 70 and 80 % of the U.S. GDPpc since the end of the 50s. 
Graph 3 Relative size of the Dutch GDPpc compared to the U.S. (U.S. is 1,0) (source: Maddison Project Database) 
1 http://www.worldeconomics.com/Data/MadisonHistoricalGDP/Madison%20Historical%20GDP%20Data.efp 
0 
1.000 
2.000 
3.000 
4.000 
5.000 
6.000 
7.000 
8.000 
9.000 
10.000 
1946 
1948 
1950 
1952 
1954 
1956 
1958 
1960 
1962 
1964 
1966 
1968 
1970 
1972 
1974 
1976 
1978 
1980 
1982 
1984 
1986 
1988 
1990 
1992 
1994 
1996 
1998 
2000 
2002 
2004 
2006 
2008 
2010 
Absolute Differences between the U.S. and Dutch GDP per capita per year 
0 
0,1 
0,2 
0,3 
0,4 
0,5 
0,6 
0,7 
0,8 
0,9 
1945 
1947 
1949 
1951 
1953 
1955 
1957 
1959 
1961 
1963 
1965 
1967 
1969 
1971 
1973 
1975 
1977 
1979 
1981 
1983 
1985 
1987 
1989 
1991 
1993 
1995 
1997 
1999 
2001 
2003 
2005 
2007 
2009 
Relative size of the Dutch GDPpc compared to the U.S. (U.S. is 1,0)
Gross National Income per capita 
In 2008 both countries showed a similar GNIpc, but while the U.S. managed to boost its GNIpc up to $ 53,308 in 2011 the Dutch did not show any progress since 2008 and remained at $ 42,397 for 2011.2 
Beyond the Gross National Income per capita 
Both the U.S. and the Netherlands can be regarded as rich countries so no surprise they both end up at the top of the charts in the Human Development Index (Netherlands 4th with a 0.915 score and the U.S. 0,914 ranking 5th). The Dutch and the U.S. were attributed a similar score on many indicators. However on some indicators the score between the countries differ much making them interesting for a cross country comparison. The selected indicators are income Gini coefficient3, gender inequality index4 and expenditure on health, total (% of GDP)5. 
Income Gini coeffiencient 
The Income Gini coeffiencient is a Measure of the deviation of the distribution of income among individuals or households within a country from a perfectly equal distribution. A value of 0 represents absolute equality, a value of 100 absolute inequality.6 As we can see the data suggest the U.S. to be a very unequal country compared to the other countries ranked on top of the HDI index. The first country being more unequal is Qatar at rank 31. 
Income Gini coefficient 
HDI overall rank 
Country 
Score 
1 
Norway 
25.8 
2 
Australia 
no data 
3 
Switzerland 
33.7 
4 
Netherlands 30.9 
5 
United States 40.8 
6 
Germany 
28.3 
7 
New Zealand 
no data 
8 
Canada 
32.6 
9 
Singapore 
no data 
10 
Denmark 
no data 
Table 1 Income Gini coefficient (source United Nations Human Development Index 2014) 
Gender inequality index 
Regarding the Gender Inequality index (based on reproductive health, empowerment and the labor market) the U.S. is also lacking behind compared to their overall score and the Netherlands. 
2 United Nations Human Development Index 2014 p 160 
3 http://hdr.undp.org/en/content/income-gini-coefficient 
4 http://hdr.undp.org/en/content/gender-inequality-index 
5 http://hdr.undp.org/en/content/expenditure-health-total-gdp 
6 http://hdr.undp.org/en/content/income-gini-coefficient
Gender Inequality Index 
HDI overall rank 
Country 
Score 
1 
Norway 
0.068 
2 
Australia 
0.113 
3 
Switzerland 
0.030 
4 
Netherlands 0.057 
5 
United States 0.262 
6 
Germany 
0.046 
7 
New Zealand 
0.185 
8 
Canada 
0.136 
9 
Singapore 
0.090 
10 
Denmark 
0.056 
Table 2 Gender Inequality Index (source United Nations Human Development Index 2014) 
Expenditure on health, total (% of GDP) 
When looking at the expenditure on health The Netherlands spends slightly more than the average among the top ten countries, but when looking at the U.S. only Liberia (19,5 %) and Sierra Leone (18,8 %) spend more as a percentage of their GDP. 
Expenditure on health, total (% of GDP) 2011 
HDI overall rank 
Country 
Score 
1 
Norway 
9,10% 
2 
Australia 
9,00% 
3 
Switzerland 
10,90% 
4 
Netherlands 12% 
5 
United States 17,90% 
6 
Germany 
11,10% 
7 
New Zealand 
10,10% 
8 
Canada 
11,20% 
9 
Singapore 
4,60% 
10 
Denmark 
11,20% 
Table 3 Expenditure on health, total (% of GDP) 2011 (source United Nations Human Development Index 2014)
Graph 4 GDP per capita developments for the mayor West European economies and the U.S. after WWII (source: Maddison Project Database) 
From the Dutch disease to the Dutch miracle 
As graph 3 shows the Dutch economy started to improve relatively compared to the U.S. from the late 80s up to 2010. When we looking at the GDPpc performance of other main Western European economies (graph 4) during this period we see that the Dutch (accompanies by the U.K.) started to outperform its European peers. Among scholar this economic development is often referred to as the ‘Dutch miracle’. (Visser, 1999). 
In the period 1982-2000 the Dutch saw a remarkable boost in GDPpc, unemployment falling from 14 % to 2,5 %, a government deficit of 9 % turning into a surplus and labor market participation went up from 52 % to 65 %. 
The set of measures making up the Dutch miracle answered the economic problems during the 70s (often referred to as the Dutch disease) with a vast increase in prices and wages and a vanishing competitive advantage due to a strong guilder. 
The famous Wassenaar agreement in 1982 between labor unions and employers introduces a policy of wage restraint to restore profits and decrease unemployment. In 1982 the new government also started to cut public spending dramatically by decreasing public wages and employment and a decrease in social security spending which was an important cause of the increase in wages during the 70s (den Butter & Mosch, 2001) 
During the early 90s wages again tend to increase, Dutch GDPpc stated to lose relatively to the U.S. and employment growth came close to zero making the situation similar to the early 80s. Again a labor 
0 
5.000 
10.000 
15.000 
20.000 
25.000 
30.000 
35.000 
1945 
1947 
1949 
1951 
1953 
1955 
1957 
1959 
1961 
1963 
1965 
1967 
1969 
1971 
1973 
1975 
1977 
1979 
1981 
1983 
1985 
1987 
1989 
1991 
1993 
1995 
1997 
1999 
2001 
2003 
2005 
2007 
2009 
GDP per capita developments for the mayor West European economies and the U.S. after WWII 
Germany 
Netherlands 
France 
UK 
Spain 
Italy 
US
compact was negotiated in 1993 and again labor costs declined boosting both GDP and employment (McMahon, 2000). 
Fundamental determinants for the Dutch economic developments after WWII 
Multiple determinants has shaped the Dutch economic developments and shaped the Dutch golden century in the 17th century. Good governance, geographical benefits and a strong entrepreneurship all contributed to the Dutch economy being in the top range for more than four centuries. 
However, after the Second World War economic problems were faced with policies typically for the Dutch economic culture as we can see from the examples above in the 80s and 90s, but also during the current economic turmoil. Therefore the Dutch culture is one of the leading determinants directing the post war economic developments. The typical Dutch ‘Polder model’ is the way in which the Dutch have carried out their economic policy for decades. 
The polder model (a polder is a low part of land typical for the Dutch landscape) means that many societal partners are involved in the policy making process. Labor Unions, employers, government, scholars and interest groups are all involved. The name refers to the old commitment model the Dutch had to deal with for centuries. People from various backgrounds and societal classes had to agree on policy measures in order to project the ‘polder’ from the water. Therefore the Dutch economy is sometimes called a consultation economy.7 
Typical poldermodel organizations are the STAR8 founded in 1945 (foundation for labour) and the SER9 founded in 1950 (Social and Economic council) in which many interest groups have a seat and negotiate about policy measures. This leads to policy measures enjoying a large amount of public support. The Dutch policy making is characterized by a large amount of formal and informal contact between the ministries, academic researchers, staff of social partners and the government’s Bureau for Economic Policy Analysis10 (Butter den 2006). 
References 
Butter, F. A. G. den (2006). The Industrial Organization of Economic Policy Preparation in the Netherlands. Version 23th January 2006. 
Butter, F. A. G. & R. H. J. Mosch (2001). The Dutch Miracle: Institutions, Networks and Trust. Research Memorandum 2001-18, Alert Vrije Universiteit Amsterdam. 
McMahon, F. (2000). Road to Growth: How Lagging Economies Become Prosperous. Atlantic Institute for Market Studies. p 97-141 
Visser, J. (1999). A Dutch Miracle. Job Growth: Welfare Reform and Corporatism in the Netherlands. Amsterdam University Press. 
7 http://www.parlement.com/id/vhnnmt7jpb00/poldermodel 
8 http://www.stvda.nl/en/home.aspx 
9 http://www.ser.nl/en/ 
10 http://www.cpb.nl/en/node/

Más contenido relacionado

La actualidad más candente

Will Stock Markets survive in 200 years?
Will Stock Markets survive in 200 years?Will Stock Markets survive in 200 years?
Will Stock Markets survive in 200 years?Gaetan Lion
 
Class 4 handout blog
Class 4 handout blogClass 4 handout blog
Class 4 handout blogRobert Croker
 
VN stelt vervangingsmigratie als superoplossing voor
VN stelt vervangingsmigratie als superoplossing voorVN stelt vervangingsmigratie als superoplossing voor
VN stelt vervangingsmigratie als superoplossing voorThierry Debels
 
November 2012 - Pages of History
November 2012 - Pages of HistoryNovember 2012 - Pages of History
November 2012 - Pages of HistoryFGV Brazil
 
Presentation of the OECD Territorial Review of the Netherlands, The Hague, Ne...
Presentation of the OECD Territorial Review of the Netherlands, The Hague, Ne...Presentation of the OECD Territorial Review of the Netherlands, The Hague, Ne...
Presentation of the OECD Territorial Review of the Netherlands, The Hague, Ne...OECD Governance
 
Inequality in europe
Inequality in europeInequality in europe
Inequality in europeFESD GKr
 
June 2012 - Electric energy sector needs rewiring
June 2012 - Electric energy sector needs rewiringJune 2012 - Electric energy sector needs rewiring
June 2012 - Electric energy sector needs rewiringFGV Brazil
 
The effect of Economic Conditions on Net Greek Migration
The effect of Economic Conditions on Net Greek MigrationThe effect of Economic Conditions on Net Greek Migration
The effect of Economic Conditions on Net Greek MigrationEmily Marshall
 
September 2011 – Can Brazil become a creative economy?
September 2011 – Can Brazil become a creative economy?September 2011 – Can Brazil become a creative economy?
September 2011 – Can Brazil become a creative economy?FGV Brazil
 
Background Analysis of The Romanian social and economic situation
Background Analysis of The Romanian social and economic situationBackground Analysis of The Romanian social and economic situation
Background Analysis of The Romanian social and economic situationStichting Hulp Oost-Europa
 
Productivity growth and fiscal adjustment
Productivity growth and fiscal adjustmentProductivity growth and fiscal adjustment
Productivity growth and fiscal adjustmentRyan Saxby Hill
 
The contribution of regions to the productivity of nations - Oliveira Martins...
The contribution of regions to the productivity of nations - Oliveira Martins...The contribution of regions to the productivity of nations - Oliveira Martins...
The contribution of regions to the productivity of nations - Oliveira Martins...OECD CFE
 
Belgium 2017 OECD Economic Survey promoting inclusive productivity growth
Belgium 2017 OECD Economic Survey promoting inclusive productivity growthBelgium 2017 OECD Economic Survey promoting inclusive productivity growth
Belgium 2017 OECD Economic Survey promoting inclusive productivity growthOECD, Economics Department
 
June Labour Market Update
June Labour Market UpdateJune Labour Market Update
June Labour Market UpdateKaylan Bland
 

La actualidad más candente (19)

Will Stock Markets survive in 200 years?
Will Stock Markets survive in 200 years?Will Stock Markets survive in 200 years?
Will Stock Markets survive in 200 years?
 
Class 4 PowerPoint
Class 4 PowerPointClass 4 PowerPoint
Class 4 PowerPoint
 
Class 4 handout blog
Class 4 handout blogClass 4 handout blog
Class 4 handout blog
 
OECD Economic Survey of Spain 2014
OECD Economic Survey of Spain 2014OECD Economic Survey of Spain 2014
OECD Economic Survey of Spain 2014
 
VN stelt vervangingsmigratie als superoplossing voor
VN stelt vervangingsmigratie als superoplossing voorVN stelt vervangingsmigratie als superoplossing voor
VN stelt vervangingsmigratie als superoplossing voor
 
Macroeconomic and demographic drivers of public hospital expenditure
Macroeconomic and demographic drivers of public hospital expenditureMacroeconomic and demographic drivers of public hospital expenditure
Macroeconomic and demographic drivers of public hospital expenditure
 
November 2012 - Pages of History
November 2012 - Pages of HistoryNovember 2012 - Pages of History
November 2012 - Pages of History
 
Presentation of the OECD Territorial Review of the Netherlands, The Hague, Ne...
Presentation of the OECD Territorial Review of the Netherlands, The Hague, Ne...Presentation of the OECD Territorial Review of the Netherlands, The Hague, Ne...
Presentation of the OECD Territorial Review of the Netherlands, The Hague, Ne...
 
Inequality in europe
Inequality in europeInequality in europe
Inequality in europe
 
June 2012 - Electric energy sector needs rewiring
June 2012 - Electric energy sector needs rewiringJune 2012 - Electric energy sector needs rewiring
June 2012 - Electric energy sector needs rewiring
 
The effect of Economic Conditions on Net Greek Migration
The effect of Economic Conditions on Net Greek MigrationThe effect of Economic Conditions on Net Greek Migration
The effect of Economic Conditions on Net Greek Migration
 
brazil_economics.docx
brazil_economics.docxbrazil_economics.docx
brazil_economics.docx
 
September 2011 – Can Brazil become a creative economy?
September 2011 – Can Brazil become a creative economy?September 2011 – Can Brazil become a creative economy?
September 2011 – Can Brazil become a creative economy?
 
Background Analysis of The Romanian social and economic situation
Background Analysis of The Romanian social and economic situationBackground Analysis of The Romanian social and economic situation
Background Analysis of The Romanian social and economic situation
 
Productivity growth and fiscal adjustment
Productivity growth and fiscal adjustmentProductivity growth and fiscal adjustment
Productivity growth and fiscal adjustment
 
The contribution of regions to the productivity of nations - Oliveira Martins...
The contribution of regions to the productivity of nations - Oliveira Martins...The contribution of regions to the productivity of nations - Oliveira Martins...
The contribution of regions to the productivity of nations - Oliveira Martins...
 
France pw gw-budget
France pw gw-budgetFrance pw gw-budget
France pw gw-budget
 
Belgium 2017 OECD Economic Survey promoting inclusive productivity growth
Belgium 2017 OECD Economic Survey promoting inclusive productivity growthBelgium 2017 OECD Economic Survey promoting inclusive productivity growth
Belgium 2017 OECD Economic Survey promoting inclusive productivity growth
 
June Labour Market Update
June Labour Market UpdateJune Labour Market Update
June Labour Market Update
 

Similar a Dutch postwar economic performance compared to the u.s.

Dutch postwar economic performance compared to the u.s.
Dutch postwar economic performance compared to the u.s.Dutch postwar economic performance compared to the u.s.
Dutch postwar economic performance compared to the u.s.PeterMachielse
 
The enigma of us productivity slowdown a theoretical analysis
The enigma of us productivity slowdown a theoretical analysisThe enigma of us productivity slowdown a theoretical analysis
The enigma of us productivity slowdown a theoretical analysisAlexander Decker
 
HLEG thematic workshop on Measuring Inequalities of Income and Wealth, Facund...
HLEG thematic workshop on Measuring Inequalities of Income and Wealth, Facund...HLEG thematic workshop on Measuring Inequalities of Income and Wealth, Facund...
HLEG thematic workshop on Measuring Inequalities of Income and Wealth, Facund...StatsCommunications
 
2014 Charting international labor comparisons
2014 Charting international labor comparisons2014 Charting international labor comparisons
2014 Charting international labor comparisonsRichard Han
 
The Un-intended Convergence: How the Finnish Unemployment Reached the Europea...
The Un-intended Convergence: How the Finnish Unemployment Reached the Europea...The Un-intended Convergence: How the Finnish Unemployment Reached the Europea...
The Un-intended Convergence: How the Finnish Unemployment Reached the Europea...Palkansaajien tutkimuslaitos
 
Sustainable progress student
Sustainable progress studentSustainable progress student
Sustainable progress studentmarga68
 
2014.03.18 - NAEC Seminar_Assessing the vulnerabilities of social institution...
2014.03.18 - NAEC Seminar_Assessing the vulnerabilities of social institution...2014.03.18 - NAEC Seminar_Assessing the vulnerabilities of social institution...
2014.03.18 - NAEC Seminar_Assessing the vulnerabilities of social institution...OECD_NAEC
 
Rolph van der Hoeven -Employment, basic needs, structural adjustment, human d...
Rolph van der Hoeven -Employment, basic needs, structural adjustment, human d...Rolph van der Hoeven -Employment, basic needs, structural adjustment, human d...
Rolph van der Hoeven -Employment, basic needs, structural adjustment, human d...Institute of Development Studies
 
Ielts writing task 1 chart
Ielts writing task 1 chartIelts writing task 1 chart
Ielts writing task 1 chartAshak Hossan
 
The Fall in Income Inequality during COVID-19 in Four European Countries, Con...
The Fall in Income Inequality during COVID-19 in Four European Countries, Con...The Fall in Income Inequality during COVID-19 in Four European Countries, Con...
The Fall in Income Inequality during COVID-19 in Four European Countries, Con...StatsCommunications
 
Carlos Mulas Granados: comments on Beetsma, Debrun and Sloof
Carlos Mulas Granados: comments on Beetsma, Debrun and SloofCarlos Mulas Granados: comments on Beetsma, Debrun and Sloof
Carlos Mulas Granados: comments on Beetsma, Debrun and SloofADEMU_Project
 
ADV20001_(Ahmling_Nash_Pivac_Smart)_Group- Project
ADV20001_(Ahmling_Nash_Pivac_Smart)_Group- ProjectADV20001_(Ahmling_Nash_Pivac_Smart)_Group- Project
ADV20001_(Ahmling_Nash_Pivac_Smart)_Group- ProjectRachel Nash
 
W1L1_Lecture 1-Concepts of Economic Growth and Development.pptx
W1L1_Lecture 1-Concepts of Economic Growth and Development.pptxW1L1_Lecture 1-Concepts of Economic Growth and Development.pptx
W1L1_Lecture 1-Concepts of Economic Growth and Development.pptxAMBIKABHANDARI5
 
Germany 2016 OECD Economic Survey investing in the future Berlin 5 April
Germany 2016 OECD Economic Survey investing in the future Berlin 5 AprilGermany 2016 OECD Economic Survey investing in the future Berlin 5 April
Germany 2016 OECD Economic Survey investing in the future Berlin 5 AprilOECD, Economics Department
 
Relationship between economic growth and happiness
Relationship between economic growth and happinessRelationship between economic growth and happiness
Relationship between economic growth and happinessUdit Goel
 
Global Wages Report 2014/15
Global Wages Report 2014/15Global Wages Report 2014/15
Global Wages Report 2014/15Dr Lendy Spires
 
The geography of EU discontent and the revenge of places that don't matter - ...
The geography of EU discontent and the revenge of places that don't matter - ...The geography of EU discontent and the revenge of places that don't matter - ...
The geography of EU discontent and the revenge of places that don't matter - ...OECD CFE
 
Poverty, Inequality and Social Policies in Brazil: 1995-2009
Poverty, Inequality and Social Policies in Brazil: 1995-2009 Poverty, Inequality and Social Policies in Brazil: 1995-2009
Poverty, Inequality and Social Policies in Brazil: 1995-2009 UNDP Policy Centre
 

Similar a Dutch postwar economic performance compared to the u.s. (20)

Dutch postwar economic performance compared to the u.s.
Dutch postwar economic performance compared to the u.s.Dutch postwar economic performance compared to the u.s.
Dutch postwar economic performance compared to the u.s.
 
The enigma of us productivity slowdown a theoretical analysis
The enigma of us productivity slowdown a theoretical analysisThe enigma of us productivity slowdown a theoretical analysis
The enigma of us productivity slowdown a theoretical analysis
 
HLEG thematic workshop on Measuring Inequalities of Income and Wealth, Facund...
HLEG thematic workshop on Measuring Inequalities of Income and Wealth, Facund...HLEG thematic workshop on Measuring Inequalities of Income and Wealth, Facund...
HLEG thematic workshop on Measuring Inequalities of Income and Wealth, Facund...
 
term1.pdf
term1.pdfterm1.pdf
term1.pdf
 
2014 Charting international labor comparisons
2014 Charting international labor comparisons2014 Charting international labor comparisons
2014 Charting international labor comparisons
 
The Un-intended Convergence: How the Finnish Unemployment Reached the Europea...
The Un-intended Convergence: How the Finnish Unemployment Reached the Europea...The Un-intended Convergence: How the Finnish Unemployment Reached the Europea...
The Un-intended Convergence: How the Finnish Unemployment Reached the Europea...
 
Sustainable progress student
Sustainable progress studentSustainable progress student
Sustainable progress student
 
2014.03.18 - NAEC Seminar_Assessing the vulnerabilities of social institution...
2014.03.18 - NAEC Seminar_Assessing the vulnerabilities of social institution...2014.03.18 - NAEC Seminar_Assessing the vulnerabilities of social institution...
2014.03.18 - NAEC Seminar_Assessing the vulnerabilities of social institution...
 
Rolph van der Hoeven -Employment, basic needs, structural adjustment, human d...
Rolph van der Hoeven -Employment, basic needs, structural adjustment, human d...Rolph van der Hoeven -Employment, basic needs, structural adjustment, human d...
Rolph van der Hoeven -Employment, basic needs, structural adjustment, human d...
 
Ielts writing task 1 chart
Ielts writing task 1 chartIelts writing task 1 chart
Ielts writing task 1 chart
 
The Fall in Income Inequality during COVID-19 in Four European Countries, Con...
The Fall in Income Inequality during COVID-19 in Four European Countries, Con...The Fall in Income Inequality during COVID-19 in Four European Countries, Con...
The Fall in Income Inequality during COVID-19 in Four European Countries, Con...
 
Carlos Mulas Granados: comments on Beetsma, Debrun and Sloof
Carlos Mulas Granados: comments on Beetsma, Debrun and SloofCarlos Mulas Granados: comments on Beetsma, Debrun and Sloof
Carlos Mulas Granados: comments on Beetsma, Debrun and Sloof
 
ADV20001_(Ahmling_Nash_Pivac_Smart)_Group- Project
ADV20001_(Ahmling_Nash_Pivac_Smart)_Group- ProjectADV20001_(Ahmling_Nash_Pivac_Smart)_Group- Project
ADV20001_(Ahmling_Nash_Pivac_Smart)_Group- Project
 
W1L1_Lecture 1-Concepts of Economic Growth and Development.pptx
W1L1_Lecture 1-Concepts of Economic Growth and Development.pptxW1L1_Lecture 1-Concepts of Economic Growth and Development.pptx
W1L1_Lecture 1-Concepts of Economic Growth and Development.pptx
 
Germany 2016 OECD Economic Survey investing in the future Berlin 5 April
Germany 2016 OECD Economic Survey investing in the future Berlin 5 AprilGermany 2016 OECD Economic Survey investing in the future Berlin 5 April
Germany 2016 OECD Economic Survey investing in the future Berlin 5 April
 
Relationship between economic growth and happiness
Relationship between economic growth and happinessRelationship between economic growth and happiness
Relationship between economic growth and happiness
 
Global Wages Report 2014/15
Global Wages Report 2014/15Global Wages Report 2014/15
Global Wages Report 2014/15
 
Demographic Change by John Luijs
Demographic Change by John LuijsDemographic Change by John Luijs
Demographic Change by John Luijs
 
The geography of EU discontent and the revenge of places that don't matter - ...
The geography of EU discontent and the revenge of places that don't matter - ...The geography of EU discontent and the revenge of places that don't matter - ...
The geography of EU discontent and the revenge of places that don't matter - ...
 
Poverty, Inequality and Social Policies in Brazil: 1995-2009
Poverty, Inequality and Social Policies in Brazil: 1995-2009 Poverty, Inequality and Social Policies in Brazil: 1995-2009
Poverty, Inequality and Social Policies in Brazil: 1995-2009
 

Más de PeterMachielse

Deeltijd ww in the netherlands costs and benefits
Deeltijd ww in the netherlands costs and benefitsDeeltijd ww in the netherlands costs and benefits
Deeltijd ww in the netherlands costs and benefitsPeterMachielse
 
Bioplastics in the netherlands
Bioplastics in the netherlandsBioplastics in the netherlands
Bioplastics in the netherlandsPeterMachielse
 
The dutch economy in 2013 outlooks, problems and solutions
The dutch economy in 2013   outlooks, problems and solutionsThe dutch economy in 2013   outlooks, problems and solutions
The dutch economy in 2013 outlooks, problems and solutionsPeterMachielse
 
Playing chess in pyongyang a brief review of dprk’s foreign relations
Playing chess in pyongyang   a brief review of dprk’s foreign relationsPlaying chess in pyongyang   a brief review of dprk’s foreign relations
Playing chess in pyongyang a brief review of dprk’s foreign relationsPeterMachielse
 
Park geun hye en haar missie
Park geun hye en haar missiePark geun hye en haar missie
Park geun hye en haar missiePeterMachielse
 
Is de sluiting van kaesong industrial zone het definitieve einde van the suns...
Is de sluiting van kaesong industrial zone het definitieve einde van the suns...Is de sluiting van kaesong industrial zone het definitieve einde van the suns...
Is de sluiting van kaesong industrial zone het definitieve einde van the suns...PeterMachielse
 
Gender inequality in south korea rationalization through the lens of system...
Gender inequality in south korea   rationalization through the lens of system...Gender inequality in south korea   rationalization through the lens of system...
Gender inequality in south korea rationalization through the lens of system...PeterMachielse
 
Chun doo hwan betaalt resterende 160 miljoen dollar
Chun doo hwan betaalt resterende 160 miljoen dollarChun doo hwan betaalt resterende 160 miljoen dollar
Chun doo hwan betaalt resterende 160 miljoen dollarPeterMachielse
 

Más de PeterMachielse (8)

Deeltijd ww in the netherlands costs and benefits
Deeltijd ww in the netherlands costs and benefitsDeeltijd ww in the netherlands costs and benefits
Deeltijd ww in the netherlands costs and benefits
 
Bioplastics in the netherlands
Bioplastics in the netherlandsBioplastics in the netherlands
Bioplastics in the netherlands
 
The dutch economy in 2013 outlooks, problems and solutions
The dutch economy in 2013   outlooks, problems and solutionsThe dutch economy in 2013   outlooks, problems and solutions
The dutch economy in 2013 outlooks, problems and solutions
 
Playing chess in pyongyang a brief review of dprk’s foreign relations
Playing chess in pyongyang   a brief review of dprk’s foreign relationsPlaying chess in pyongyang   a brief review of dprk’s foreign relations
Playing chess in pyongyang a brief review of dprk’s foreign relations
 
Park geun hye en haar missie
Park geun hye en haar missiePark geun hye en haar missie
Park geun hye en haar missie
 
Is de sluiting van kaesong industrial zone het definitieve einde van the suns...
Is de sluiting van kaesong industrial zone het definitieve einde van the suns...Is de sluiting van kaesong industrial zone het definitieve einde van the suns...
Is de sluiting van kaesong industrial zone het definitieve einde van the suns...
 
Gender inequality in south korea rationalization through the lens of system...
Gender inequality in south korea   rationalization through the lens of system...Gender inequality in south korea   rationalization through the lens of system...
Gender inequality in south korea rationalization through the lens of system...
 
Chun doo hwan betaalt resterende 160 miljoen dollar
Chun doo hwan betaalt resterende 160 miljoen dollarChun doo hwan betaalt resterende 160 miljoen dollar
Chun doo hwan betaalt resterende 160 miljoen dollar
 

Último

BPPG response - Options for Defined Benefit schemes - 19Apr24.pdf
BPPG response - Options for Defined Benefit schemes - 19Apr24.pdfBPPG response - Options for Defined Benefit schemes - 19Apr24.pdf
BPPG response - Options for Defined Benefit schemes - 19Apr24.pdfHenry Tapper
 
2024 Q1 Crypto Industry Report | CoinGecko
2024 Q1 Crypto Industry Report | CoinGecko2024 Q1 Crypto Industry Report | CoinGecko
2024 Q1 Crypto Industry Report | CoinGeckoCoinGecko
 
Uae-NO1 Kala Jadu specialist Expert in Pakistan kala ilam specialist Expert i...
Uae-NO1 Kala Jadu specialist Expert in Pakistan kala ilam specialist Expert i...Uae-NO1 Kala Jadu specialist Expert in Pakistan kala ilam specialist Expert i...
Uae-NO1 Kala Jadu specialist Expert in Pakistan kala ilam specialist Expert i...Amil baba
 
Call Girls Near Golden Tulip Essential Hotel, New Delhi 9873777170
Call Girls Near Golden Tulip Essential Hotel, New Delhi 9873777170Call Girls Near Golden Tulip Essential Hotel, New Delhi 9873777170
Call Girls Near Golden Tulip Essential Hotel, New Delhi 9873777170Sonam Pathan
 
Vp Girls near me Delhi Call Now or WhatsApp
Vp Girls near me Delhi Call Now or WhatsAppVp Girls near me Delhi Call Now or WhatsApp
Vp Girls near me Delhi Call Now or WhatsAppmiss dipika
 
Market Morning Updates for 16th April 2024
Market Morning Updates for 16th April 2024Market Morning Updates for 16th April 2024
Market Morning Updates for 16th April 2024Devarsh Vakil
 
Uae-NO1 Black Magic Specialist In Lahore Black magic In Pakistan Kala Ilam Ex...
Uae-NO1 Black Magic Specialist In Lahore Black magic In Pakistan Kala Ilam Ex...Uae-NO1 Black Magic Specialist In Lahore Black magic In Pakistan Kala Ilam Ex...
Uae-NO1 Black Magic Specialist In Lahore Black magic In Pakistan Kala Ilam Ex...Amil baba
 
The Inspirational Story of Julio Herrera Velutini - Global Finance Leader
The Inspirational Story of Julio Herrera Velutini - Global Finance LeaderThe Inspirational Story of Julio Herrera Velutini - Global Finance Leader
The Inspirational Story of Julio Herrera Velutini - Global Finance LeaderArianna Varetto
 
NO1 WorldWide Love marriage specialist baba ji Amil Baba Kala ilam powerful v...
NO1 WorldWide Love marriage specialist baba ji Amil Baba Kala ilam powerful v...NO1 WorldWide Love marriage specialist baba ji Amil Baba Kala ilam powerful v...
NO1 WorldWide Love marriage specialist baba ji Amil Baba Kala ilam powerful v...Amil baba
 
Stock Market Brief Deck FOR 4/17 video.pdf
Stock Market Brief Deck FOR 4/17 video.pdfStock Market Brief Deck FOR 4/17 video.pdf
Stock Market Brief Deck FOR 4/17 video.pdfMichael Silva
 
212MTAMount Durham University Bachelor's Diploma in Technology
212MTAMount Durham University Bachelor's Diploma in Technology212MTAMount Durham University Bachelor's Diploma in Technology
212MTAMount Durham University Bachelor's Diploma in Technologyz xss
 
Uae-NO1 Pakistani Amil Baba Real Amil baba In Pakistan Najoomi Baba in Pakist...
Uae-NO1 Pakistani Amil Baba Real Amil baba In Pakistan Najoomi Baba in Pakist...Uae-NO1 Pakistani Amil Baba Real Amil baba In Pakistan Najoomi Baba in Pakist...
Uae-NO1 Pakistani Amil Baba Real Amil baba In Pakistan Najoomi Baba in Pakist...Amil baba
 
『澳洲文凭』买科廷大学毕业证书成绩单办理澳洲Curtin文凭学位证书
『澳洲文凭』买科廷大学毕业证书成绩单办理澳洲Curtin文凭学位证书『澳洲文凭』买科廷大学毕业证书成绩单办理澳洲Curtin文凭学位证书
『澳洲文凭』买科廷大学毕业证书成绩单办理澳洲Curtin文凭学位证书rnrncn29
 
1:1原版定制美国加州大学河滨分校毕业证成绩单pdf电子版制作修改
1:1原版定制美国加州大学河滨分校毕业证成绩单pdf电子版制作修改1:1原版定制美国加州大学河滨分校毕业证成绩单pdf电子版制作修改
1:1原版定制美国加州大学河滨分校毕业证成绩单pdf电子版制作修改yuu sss
 
NO1 WorldWide Genuine vashikaran specialist Vashikaran baba near Lahore Vashi...
NO1 WorldWide Genuine vashikaran specialist Vashikaran baba near Lahore Vashi...NO1 WorldWide Genuine vashikaran specialist Vashikaran baba near Lahore Vashi...
NO1 WorldWide Genuine vashikaran specialist Vashikaran baba near Lahore Vashi...Amil baba
 
Gender and caste discrimination in india
Gender and caste discrimination in indiaGender and caste discrimination in india
Gender and caste discrimination in indiavandanasingh01072003
 
Unveiling Business Expansion Trends in 2024
Unveiling Business Expansion Trends in 2024Unveiling Business Expansion Trends in 2024
Unveiling Business Expansion Trends in 2024Champak Jhagmag
 
毕业文凭制作#回国入职#diploma#degree美国宾夕法尼亚大学毕业证成绩单pdf电子版制作修改#毕业文凭制作#回国入职#diploma#degree
毕业文凭制作#回国入职#diploma#degree美国宾夕法尼亚大学毕业证成绩单pdf电子版制作修改#毕业文凭制作#回国入职#diploma#degree 毕业文凭制作#回国入职#diploma#degree美国宾夕法尼亚大学毕业证成绩单pdf电子版制作修改#毕业文凭制作#回国入职#diploma#degree
毕业文凭制作#回国入职#diploma#degree美国宾夕法尼亚大学毕业证成绩单pdf电子版制作修改#毕业文凭制作#回国入职#diploma#degree ttt fff
 
Call Girls Near Delhi Pride Hotel, New Delhi|9873777170
Call Girls Near Delhi Pride Hotel, New Delhi|9873777170Call Girls Near Delhi Pride Hotel, New Delhi|9873777170
Call Girls Near Delhi Pride Hotel, New Delhi|9873777170Sonam Pathan
 
Global Economic Outlook, 2024 - Scholaride Consulting
Global Economic Outlook, 2024 - Scholaride ConsultingGlobal Economic Outlook, 2024 - Scholaride Consulting
Global Economic Outlook, 2024 - Scholaride Consultingswastiknandyofficial
 

Último (20)

BPPG response - Options for Defined Benefit schemes - 19Apr24.pdf
BPPG response - Options for Defined Benefit schemes - 19Apr24.pdfBPPG response - Options for Defined Benefit schemes - 19Apr24.pdf
BPPG response - Options for Defined Benefit schemes - 19Apr24.pdf
 
2024 Q1 Crypto Industry Report | CoinGecko
2024 Q1 Crypto Industry Report | CoinGecko2024 Q1 Crypto Industry Report | CoinGecko
2024 Q1 Crypto Industry Report | CoinGecko
 
Uae-NO1 Kala Jadu specialist Expert in Pakistan kala ilam specialist Expert i...
Uae-NO1 Kala Jadu specialist Expert in Pakistan kala ilam specialist Expert i...Uae-NO1 Kala Jadu specialist Expert in Pakistan kala ilam specialist Expert i...
Uae-NO1 Kala Jadu specialist Expert in Pakistan kala ilam specialist Expert i...
 
Call Girls Near Golden Tulip Essential Hotel, New Delhi 9873777170
Call Girls Near Golden Tulip Essential Hotel, New Delhi 9873777170Call Girls Near Golden Tulip Essential Hotel, New Delhi 9873777170
Call Girls Near Golden Tulip Essential Hotel, New Delhi 9873777170
 
Vp Girls near me Delhi Call Now or WhatsApp
Vp Girls near me Delhi Call Now or WhatsAppVp Girls near me Delhi Call Now or WhatsApp
Vp Girls near me Delhi Call Now or WhatsApp
 
Market Morning Updates for 16th April 2024
Market Morning Updates for 16th April 2024Market Morning Updates for 16th April 2024
Market Morning Updates for 16th April 2024
 
Uae-NO1 Black Magic Specialist In Lahore Black magic In Pakistan Kala Ilam Ex...
Uae-NO1 Black Magic Specialist In Lahore Black magic In Pakistan Kala Ilam Ex...Uae-NO1 Black Magic Specialist In Lahore Black magic In Pakistan Kala Ilam Ex...
Uae-NO1 Black Magic Specialist In Lahore Black magic In Pakistan Kala Ilam Ex...
 
The Inspirational Story of Julio Herrera Velutini - Global Finance Leader
The Inspirational Story of Julio Herrera Velutini - Global Finance LeaderThe Inspirational Story of Julio Herrera Velutini - Global Finance Leader
The Inspirational Story of Julio Herrera Velutini - Global Finance Leader
 
NO1 WorldWide Love marriage specialist baba ji Amil Baba Kala ilam powerful v...
NO1 WorldWide Love marriage specialist baba ji Amil Baba Kala ilam powerful v...NO1 WorldWide Love marriage specialist baba ji Amil Baba Kala ilam powerful v...
NO1 WorldWide Love marriage specialist baba ji Amil Baba Kala ilam powerful v...
 
Stock Market Brief Deck FOR 4/17 video.pdf
Stock Market Brief Deck FOR 4/17 video.pdfStock Market Brief Deck FOR 4/17 video.pdf
Stock Market Brief Deck FOR 4/17 video.pdf
 
212MTAMount Durham University Bachelor's Diploma in Technology
212MTAMount Durham University Bachelor's Diploma in Technology212MTAMount Durham University Bachelor's Diploma in Technology
212MTAMount Durham University Bachelor's Diploma in Technology
 
Uae-NO1 Pakistani Amil Baba Real Amil baba In Pakistan Najoomi Baba in Pakist...
Uae-NO1 Pakistani Amil Baba Real Amil baba In Pakistan Najoomi Baba in Pakist...Uae-NO1 Pakistani Amil Baba Real Amil baba In Pakistan Najoomi Baba in Pakist...
Uae-NO1 Pakistani Amil Baba Real Amil baba In Pakistan Najoomi Baba in Pakist...
 
『澳洲文凭』买科廷大学毕业证书成绩单办理澳洲Curtin文凭学位证书
『澳洲文凭』买科廷大学毕业证书成绩单办理澳洲Curtin文凭学位证书『澳洲文凭』买科廷大学毕业证书成绩单办理澳洲Curtin文凭学位证书
『澳洲文凭』买科廷大学毕业证书成绩单办理澳洲Curtin文凭学位证书
 
1:1原版定制美国加州大学河滨分校毕业证成绩单pdf电子版制作修改
1:1原版定制美国加州大学河滨分校毕业证成绩单pdf电子版制作修改1:1原版定制美国加州大学河滨分校毕业证成绩单pdf电子版制作修改
1:1原版定制美国加州大学河滨分校毕业证成绩单pdf电子版制作修改
 
NO1 WorldWide Genuine vashikaran specialist Vashikaran baba near Lahore Vashi...
NO1 WorldWide Genuine vashikaran specialist Vashikaran baba near Lahore Vashi...NO1 WorldWide Genuine vashikaran specialist Vashikaran baba near Lahore Vashi...
NO1 WorldWide Genuine vashikaran specialist Vashikaran baba near Lahore Vashi...
 
Gender and caste discrimination in india
Gender and caste discrimination in indiaGender and caste discrimination in india
Gender and caste discrimination in india
 
Unveiling Business Expansion Trends in 2024
Unveiling Business Expansion Trends in 2024Unveiling Business Expansion Trends in 2024
Unveiling Business Expansion Trends in 2024
 
毕业文凭制作#回国入职#diploma#degree美国宾夕法尼亚大学毕业证成绩单pdf电子版制作修改#毕业文凭制作#回国入职#diploma#degree
毕业文凭制作#回国入职#diploma#degree美国宾夕法尼亚大学毕业证成绩单pdf电子版制作修改#毕业文凭制作#回国入职#diploma#degree 毕业文凭制作#回国入职#diploma#degree美国宾夕法尼亚大学毕业证成绩单pdf电子版制作修改#毕业文凭制作#回国入职#diploma#degree
毕业文凭制作#回国入职#diploma#degree美国宾夕法尼亚大学毕业证成绩单pdf电子版制作修改#毕业文凭制作#回国入职#diploma#degree
 
Call Girls Near Delhi Pride Hotel, New Delhi|9873777170
Call Girls Near Delhi Pride Hotel, New Delhi|9873777170Call Girls Near Delhi Pride Hotel, New Delhi|9873777170
Call Girls Near Delhi Pride Hotel, New Delhi|9873777170
 
Global Economic Outlook, 2024 - Scholaride Consulting
Global Economic Outlook, 2024 - Scholaride ConsultingGlobal Economic Outlook, 2024 - Scholaride Consulting
Global Economic Outlook, 2024 - Scholaride Consulting
 

Dutch postwar economic performance compared to the u.s.

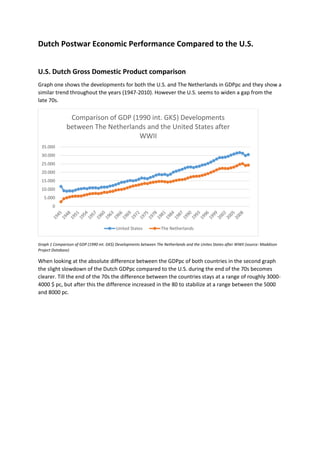
  • 1. Dutch Postwar Economic Performance Compared to the U.S. U.S. Dutch Gross Domestic Product comparison Graph one shows the developments for both the U.S. and The Netherlands in GDPpc and they show a similar trend throughout the years (1947-2010). However the U.S. seems to widen a gap from the late 70s. Graph 1 Comparison of GDP (1990 int. GK$) Developments between The Netherlands and the Unites States after WWII (source: Maddison Project Database) When looking at the absolute difference between the GDPpc of both countries in the second graph the slight slowdown of the Dutch GDPpc compared to the U.S. during the end of the 70s becomes clearer. Till the end of the 70s the difference between the countries stays at a range of roughly 3000- 4000 $ pc, but after this the difference increased in the 80 to stabilize at a range between the 5000 and 8000 pc. 0 5.000 10.000 15.000 20.000 25.000 30.000 35.000 Comparison of GDP (1990 int. GK$) Developments between The Netherlands and the United States after WWII United States The Netherlands
  • 2. Graph 2 Absolute Differences between the U.S. and Dutch GDP per capita per year (source: Maddison Project Database)1 The third graph shows the size of the Dutch GDPpc compared to the U.S. GDPpc (U.S. GDPpc is 1,0 at the vertical axis). This graph shows us that the Dutch GDPpc has been between the 70 and 80 % of the U.S. GDPpc since the end of the 50s. Graph 3 Relative size of the Dutch GDPpc compared to the U.S. (U.S. is 1,0) (source: Maddison Project Database) 1 http://www.worldeconomics.com/Data/MadisonHistoricalGDP/Madison%20Historical%20GDP%20Data.efp 0 1.000 2.000 3.000 4.000 5.000 6.000 7.000 8.000 9.000 10.000 1946 1948 1950 1952 1954 1956 1958 1960 1962 1964 1966 1968 1970 1972 1974 1976 1978 1980 1982 1984 1986 1988 1990 1992 1994 1996 1998 2000 2002 2004 2006 2008 2010 Absolute Differences between the U.S. and Dutch GDP per capita per year 0 0,1 0,2 0,3 0,4 0,5 0,6 0,7 0,8 0,9 1945 1947 1949 1951 1953 1955 1957 1959 1961 1963 1965 1967 1969 1971 1973 1975 1977 1979 1981 1983 1985 1987 1989 1991 1993 1995 1997 1999 2001 2003 2005 2007 2009 Relative size of the Dutch GDPpc compared to the U.S. (U.S. is 1,0)
  • 3. Gross National Income per capita In 2008 both countries showed a similar GNIpc, but while the U.S. managed to boost its GNIpc up to $ 53,308 in 2011 the Dutch did not show any progress since 2008 and remained at $ 42,397 for 2011.2 Beyond the Gross National Income per capita Both the U.S. and the Netherlands can be regarded as rich countries so no surprise they both end up at the top of the charts in the Human Development Index (Netherlands 4th with a 0.915 score and the U.S. 0,914 ranking 5th). The Dutch and the U.S. were attributed a similar score on many indicators. However on some indicators the score between the countries differ much making them interesting for a cross country comparison. The selected indicators are income Gini coefficient3, gender inequality index4 and expenditure on health, total (% of GDP)5. Income Gini coeffiencient The Income Gini coeffiencient is a Measure of the deviation of the distribution of income among individuals or households within a country from a perfectly equal distribution. A value of 0 represents absolute equality, a value of 100 absolute inequality.6 As we can see the data suggest the U.S. to be a very unequal country compared to the other countries ranked on top of the HDI index. The first country being more unequal is Qatar at rank 31. Income Gini coefficient HDI overall rank Country Score 1 Norway 25.8 2 Australia no data 3 Switzerland 33.7 4 Netherlands 30.9 5 United States 40.8 6 Germany 28.3 7 New Zealand no data 8 Canada 32.6 9 Singapore no data 10 Denmark no data Table 1 Income Gini coefficient (source United Nations Human Development Index 2014) Gender inequality index Regarding the Gender Inequality index (based on reproductive health, empowerment and the labor market) the U.S. is also lacking behind compared to their overall score and the Netherlands. 2 United Nations Human Development Index 2014 p 160 3 http://hdr.undp.org/en/content/income-gini-coefficient 4 http://hdr.undp.org/en/content/gender-inequality-index 5 http://hdr.undp.org/en/content/expenditure-health-total-gdp 6 http://hdr.undp.org/en/content/income-gini-coefficient
  • 4. Gender Inequality Index HDI overall rank Country Score 1 Norway 0.068 2 Australia 0.113 3 Switzerland 0.030 4 Netherlands 0.057 5 United States 0.262 6 Germany 0.046 7 New Zealand 0.185 8 Canada 0.136 9 Singapore 0.090 10 Denmark 0.056 Table 2 Gender Inequality Index (source United Nations Human Development Index 2014) Expenditure on health, total (% of GDP) When looking at the expenditure on health The Netherlands spends slightly more than the average among the top ten countries, but when looking at the U.S. only Liberia (19,5 %) and Sierra Leone (18,8 %) spend more as a percentage of their GDP. Expenditure on health, total (% of GDP) 2011 HDI overall rank Country Score 1 Norway 9,10% 2 Australia 9,00% 3 Switzerland 10,90% 4 Netherlands 12% 5 United States 17,90% 6 Germany 11,10% 7 New Zealand 10,10% 8 Canada 11,20% 9 Singapore 4,60% 10 Denmark 11,20% Table 3 Expenditure on health, total (% of GDP) 2011 (source United Nations Human Development Index 2014)
  • 5. Graph 4 GDP per capita developments for the mayor West European economies and the U.S. after WWII (source: Maddison Project Database) From the Dutch disease to the Dutch miracle As graph 3 shows the Dutch economy started to improve relatively compared to the U.S. from the late 80s up to 2010. When we looking at the GDPpc performance of other main Western European economies (graph 4) during this period we see that the Dutch (accompanies by the U.K.) started to outperform its European peers. Among scholar this economic development is often referred to as the ‘Dutch miracle’. (Visser, 1999). In the period 1982-2000 the Dutch saw a remarkable boost in GDPpc, unemployment falling from 14 % to 2,5 %, a government deficit of 9 % turning into a surplus and labor market participation went up from 52 % to 65 %. The set of measures making up the Dutch miracle answered the economic problems during the 70s (often referred to as the Dutch disease) with a vast increase in prices and wages and a vanishing competitive advantage due to a strong guilder. The famous Wassenaar agreement in 1982 between labor unions and employers introduces a policy of wage restraint to restore profits and decrease unemployment. In 1982 the new government also started to cut public spending dramatically by decreasing public wages and employment and a decrease in social security spending which was an important cause of the increase in wages during the 70s (den Butter & Mosch, 2001) During the early 90s wages again tend to increase, Dutch GDPpc stated to lose relatively to the U.S. and employment growth came close to zero making the situation similar to the early 80s. Again a labor 0 5.000 10.000 15.000 20.000 25.000 30.000 35.000 1945 1947 1949 1951 1953 1955 1957 1959 1961 1963 1965 1967 1969 1971 1973 1975 1977 1979 1981 1983 1985 1987 1989 1991 1993 1995 1997 1999 2001 2003 2005 2007 2009 GDP per capita developments for the mayor West European economies and the U.S. after WWII Germany Netherlands France UK Spain Italy US
  • 6. compact was negotiated in 1993 and again labor costs declined boosting both GDP and employment (McMahon, 2000). Fundamental determinants for the Dutch economic developments after WWII Multiple determinants has shaped the Dutch economic developments and shaped the Dutch golden century in the 17th century. Good governance, geographical benefits and a strong entrepreneurship all contributed to the Dutch economy being in the top range for more than four centuries. However, after the Second World War economic problems were faced with policies typically for the Dutch economic culture as we can see from the examples above in the 80s and 90s, but also during the current economic turmoil. Therefore the Dutch culture is one of the leading determinants directing the post war economic developments. The typical Dutch ‘Polder model’ is the way in which the Dutch have carried out their economic policy for decades. The polder model (a polder is a low part of land typical for the Dutch landscape) means that many societal partners are involved in the policy making process. Labor Unions, employers, government, scholars and interest groups are all involved. The name refers to the old commitment model the Dutch had to deal with for centuries. People from various backgrounds and societal classes had to agree on policy measures in order to project the ‘polder’ from the water. Therefore the Dutch economy is sometimes called a consultation economy.7 Typical poldermodel organizations are the STAR8 founded in 1945 (foundation for labour) and the SER9 founded in 1950 (Social and Economic council) in which many interest groups have a seat and negotiate about policy measures. This leads to policy measures enjoying a large amount of public support. The Dutch policy making is characterized by a large amount of formal and informal contact between the ministries, academic researchers, staff of social partners and the government’s Bureau for Economic Policy Analysis10 (Butter den 2006). References Butter, F. A. G. den (2006). The Industrial Organization of Economic Policy Preparation in the Netherlands. Version 23th January 2006. Butter, F. A. G. & R. H. J. Mosch (2001). The Dutch Miracle: Institutions, Networks and Trust. Research Memorandum 2001-18, Alert Vrije Universiteit Amsterdam. McMahon, F. (2000). Road to Growth: How Lagging Economies Become Prosperous. Atlantic Institute for Market Studies. p 97-141 Visser, J. (1999). A Dutch Miracle. Job Growth: Welfare Reform and Corporatism in the Netherlands. Amsterdam University Press. 7 http://www.parlement.com/id/vhnnmt7jpb00/poldermodel 8 http://www.stvda.nl/en/home.aspx 9 http://www.ser.nl/en/ 10 http://www.cpb.nl/en/node/