Lean Managment
•
11 recomendaciones•1,868 vistas

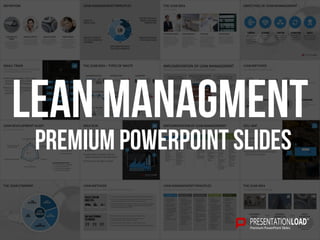
Convey the Lean Spirit in PowerPoint: detailed slides on the implementation of lean management methods and tools such as the Pull Principle, the 5S concept, Kanban and lean management charts.

Recomendados
Más contenido relacionado
La actualidad más candente
La actualidad más candente (20)
Destacado
Destacado (13)
Similar a Lean Managment
Similar a Lean Managment (20)
Más de PresentationLoad
Más de PresentationLoad (20)
Último
Último (16)
Lean Managment
- 1. Lean management PREMIUM POWERPOINT SLIDES
- 3. DEFINITION APPROACH CUSTOMER FOCUS QUALITY ON TOP COMMITTED EMPLOYEES VISIONS AND OBJECTIVES RESULTS AND PROCESSES FOCUS Better quality Decreasing costs Faster processes ELEMENTS Standardization Just-in-time Stable processes Kaizen Team work PRINCIPLES 5S-Method Visual management Standardized processes and methods Pull production Continuous production line Zero-defect-principle TPM (Total Productive Maintenance) Value creation and wastage Kaizen workshops Leadership/guidance Qualification TOOLS Standard worksheets 5S Audits/inspections Key figure boards Kanban regulation Setup time reduction / SMED Value stream analysis Problem solving techniques Q-control-circuits Autonomous/preventive Maintenance Six Sigma Poka Yoke Improvement teams Idea management Target control sheets Management audits Qualification matrix Standard communication Target agreement MEASURES Audit results … Inventory Number of Kanban cards Throughput time Number of change overs Quality key figures Productivity GAE/OEE Number of stoppages Number of proposals Number of Improvement teams Number of workshops Level of target achievement Audit results Multiple qualification Number of trainings Best in class Financial success Secure jobs
- 4. Adding value is only about value increasing activities, that are useful for the customer and which he is willing to pay for a higher price CUSTOMER NEEDS Lean Management shows the way to detect and organize value adding activities, to eliminate any kind of wastage ORGANIZATION Elimination of waste as main target of Lean Management: every activity, that spends resources of any kind (work capacity, areas, machines etc.), but is not creating value WASTAGE Applied in all corporate divisions: production, service, administration, distribution, storage etc. APPLICATION THE LEAN IDEA Value Creation
- 5. LEAN MANAGEMENT PRINCIPLES DRIVE TO PERFECTION DEFINE THE VALUE FROM CUSTOMER PERSPECTIVE INTRODUCTION OF THE PULL PRINCIPLE (KANBAN) IDENTIFICATION OF THE VALUE CHAIN IMPLEMENTATION OF THE FLOW-PRINCIPLE LM 1 24 3 5
- 6. OBJECTIVES OF LEAN MANAGEMENT EFFICIENCY Process oriented business management & highest possible effectiveness clearness Explicitly defined processes and workflows Structure Logical arrangement of responsibilities & communication channels Optimization Minimization of wastage and optimization of processes Quality Reduction of error rates and functional cases of damage
- 7. IMPLEMENTATION OF LEAN MANAGEMENT 7-Step-Model Will of management to introduce Lean Management Support of implementati on process without limitations Especially important at lacking acceptance or setbacks Support implementati on by Lean Management experts Have hands- on experience from companies, in which Lean Management was already implemented Recognize obstacles and moderate occurring problems Management objectives have to match objectives of Lean Management Identification of rooms for improvement Detect possibilities to eliminate waste basing on an analysis of the current state Where is the value stream unbalanced? Definition of the current state Aspired ideal state often documented as a vision Provided with the obligation of the management to realize this vision within a fixed schedule In pilot projects, employees can be persuaded of the function and use of the concept Motivation for further projects No risk for the management to threaten the existence of the company Corrections of the concept are possible Implementa- tion within the whole company Striving for perfection requires continuous advancement Lean Management as corporate philosophy, which has to be carried and internalized by every employee 1 2 3 4 5 6 7
- 8. THE LEAN IDEA – TYPES OF WASTE ??? OVERPRODUCTION ??? WAITING TIME a b TRANSPORT 7+1 TYPES OF WASTE1 2 3 4 5 6 INEFFICIENT PROCESS MOTION MISTAKES / REWORK STOCK CREATIVITY
- 9. LEAN MANAGEMENT TOOLS Q7 – 7 Statistical Quality Tools Registration of errors within the company processes Most frequent errors, causing the highest costs, can be eliminated through improvement projects ERROR REPORT Shows frequency distribution of classified and ordered data Data outside of the tolerance area are the basis for projects to reduce deviation HISTOGRAM Monitoring production processes and timely prevention of discrepancies Records of observed data allow conclusions to be drawn about the course of the processes QUALITY CONTROL CARD Arrange characteristics of processes according to their importance Focus on activities with highest impact on business objectives PARETO-DIAGRAM Correlation coefficient expresses intensity and direction of two parameters Creates basis for improvement measures Data are visualized within the diagram CORRELATION DIAGRAMM Phase 1: collection of proposals and ideas concerning the problem without limitations Phase 2: proposals and ideas are ordered and valued; realizable suggestions become visible BRAINSTORMING Cause and effect diagram Definition of cause categories (e.g. human, machine, material, method) Results hint to improvement measures within the process ISHIKAWA-DIAGRAM
- 10. MILK RUN Rotation truck, drives to several suppliers every day on the same route Picks up daily needs for the production Supply volume complies with the daily requirement of the fabrication Unnecessary storage is avoided Lean Management and the Pull-Principle (Demand-Oriented Fabrication) LIEFERANTEN A B C D
- 11. SHOP STOCK Storage of the output of the production unit Flow racks directly at the machine Assurance of FIFO Kanban regulates volume within the Shop Stocks Visualization of process quality and process safety Lean Management and the Pull-Principle (Demand-Oriented Fabrication)
- 12. HEIJUNKA Heijunka Board schedules tact of the Small Train Assures graded production process: balance between delivered material and finished products Visualization of process instabilities Lean Management and the Pull-Principle (Demand-Oriented Fabrication)
- 13. LEAN METHODS Lean Management and Visual Management Flow of material and information from customer to purveyor Target: shortening of the throughput time Value processes from customer perspective and test them for wastage Distinction between value adding and non value adding processes Production plant stops automatically as soon as an error is recognized Employee has to solve the problem within a fixed time, otherwise he has to contact his next superior Shall protect customer from defective fabrication and forces the company to solve the problem Zoning: mapping of the standardized destination of a moveable item E.g. colored tapes on the floor or shadow-boards Andon: Visualization of the current state of the production plant Involved employees see anytime if machine produces or stops Principle: “You cannot regulate what you cannot measure.” Few selected key figures are enough to run a business E.g. OEE (Overall Equipment Effectiveness) and TEPP (Total Effective Equipment Productivity) as requirements for Lean Concepts KEY PERFORMANCE INDICATORS (KPI) ZONING / ANDON VALUE STREAM MAPPING - VSM JIDOKA/ FIRST DEFECT STOP
- 14. LEAN METHODS Further Methods, to make complex contexts transparent Key figure systems make progress visible Comprises OEE (Overall Equipment Effectiveness), stock, throughput time, performance time, working time, number of employees and others Key figure SYSTEMs Involvement of employees into conception and implementation of measures as well as their sensitization for mistakes Strengthens employee motivation and uses their Know-how Involvement of employees To use improvement potentials, several methods can be applied, e.g. Kanban-System, One-Piece-Flow, SMED (Single Minute Exchange of Die) Lean Management concept places great emphasis on visualization to disburden the employees from the application of the methods Further METHODs
- 15. THE LEAN COMPANY Lean ProduCtion Lean MAINTENANCE Lean ADMINISTRATION Lean Service Lean DEVELOPMENT Lean COMPANY Download at www.PresentationLoad.com
- 16. LEAN MANUFACTURING SHORT CYCLES CONTINUOUS IMPROVE- MENT TOTALQUALITY FOCUS SYSTEMs Level load & Balanced Flow Preventative Maintenance Supplier Partnerships Pull Systems LEAN PRODUCTION Total employee Involvement Control through visibility Housekeeping Total quality focus peopleStructured flow manufacturing Small lot production Setup reduction Fitness for use Technology Download at www.PresentationLoad.com
- 17. Click here to visit www.PresentationLoad.com DOWNLOAD POWERPOINT SLIDES