Performance comparison: Dell Latitude E5430 vs. Lenovo ThinkPad L430
•
1 recomendación•1,654 vistas

Today’s workers do not want computers that keep them waiting. Selecting notebooks that perform everyday tasks quickly makes good business sense. In our tests, the Dell Latitude E5430 booted, shut down, performed office workload scenarios, and handled graphics and 3D more quickly than the Lenovo ThinkPad L430. This makes it an excellent choice for your employees.

Recomendados
Recomendados
Más contenido relacionado
Similar a Performance comparison: Dell Latitude E5430 vs. Lenovo ThinkPad L430
Similar a Performance comparison: Dell Latitude E5430 vs. Lenovo ThinkPad L430 (20)
Más de Principled Technologies
Más de Principled Technologies (20)
Último
Último (20)
Performance comparison: Dell Latitude E5430 vs. Lenovo ThinkPad L430
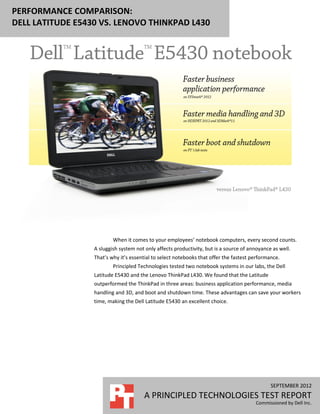
- 1. PERFORMANCE COMPARISON: DELL LATITUDE E5430 VS. LENOVO THINKPAD L430 When it comes to your employees’ notebook computers, every second counts. A sluggish system not only affects productivity, but is a source of annoyance as well. That’s why it’s essential to select notebooks that offer the fastest performance. Principled Technologies tested two notebook systems in our labs, the Dell Latitude E5430 and the Lenovo ThinkPad L430. We found that the Latitude outperformed the ThinkPad in three areas: business application performance, media handling and 3D, and boot and shutdown time. These advantages can save your workers time, making the Dell Latitude E5430 an excellent choice. SEPTEMBER 2012 A PRINCIPLED TECHNOLOGIES TEST REPORT Commissioned by Dell Inc.
- 2. TIME IS OF THE ESSENCE Because notebook system response time and performance are so important to today’s worker, we conducted three tests to compare the Dell Latitude E5430 and the Lenovo ThinkPad L430. We measured boot and shutdown time, business application performance, and media handling and 3D. We conducted every test three times and present the results for the median run of each test. Boot and shutdown The less time users spend waiting for their notebooks to boot up or shut down, the more time they have to be productive. Figure 1 shows the median results for our boot and shutdown tests. In our tests, the Dell Latitude E5430 took 16.2 percent less time to boot and 17.8 percent less time to shut down than the Lenovo ThinkPad L430. Time to boot and shut down 50 (lower numbers are better) 39.7 40 Dell 33.2 Figure 1: The Dell Latitude E5430 took Latitude Seconds 16.2 percent less time to boot and 17.8 30 E5430 percent less time to shut down than the Lenovo ThinkPad L430. 20 15.4 12.7 Lenovo 10 ThinkPad L430 0 Boot Shutdown Performance testing Because performance is so important to today’s worker, we used three benchmarks to rate the performance of the notebooks, and found that the Dell Latitude E5430 was up to completing the tasks workers require. We tested the gaming performance of the systems using FutureMark® 3DMark®11, which tests the graphics capabilities of the notebooks, and found that the Dell Latitude E5430 outperformed the Lenovo ThinkPad L430 on the 3DMark11 benchmark. Figure 2 shows the median results of our 3DMark11 tests. Performance comparison: Dell Latitude E5430 vs. Lenovo ThinkPad L430 A Principled Technologies test report 2
- 3. FutureMark 3DMark11 Dell Latitude E5430 Lenovo ThinkPad L430 3D Mark Score 594 593 Graphics Score 512 513 Physics Score 3,365 3,402 Combined Score 576 560 Figure 2: Median scores for the FutureMark 3DMark11 benchmark. Higher numbers are better. BAPCo SYSmark® 2012 measures system performance for a number of common tasks including office productivity and media creation. Figure 3 shows the median results of our SYSmark 2012 tests. The Dell Latitude E5430 achieved a higher SYSmark2012 Overall Performance Rating than the Lenovo ThinkPad L430. BAPCo SYSmark 2012 Dell Latitude E5430 Lenovo ThinkPad L430 SYSmark 2012 Overall Performance Rating 120 119 SYSmark 2012 – Office Productivity 120 115 SYSmark 2012 – Media Creation 117 115 SYSmark 2012 – Web Development 111 108 SYSmark 2012 – Data/Financial Analysis 134 136 SYSmark 2012 – 3D Modeling 116 116 SYSmark 2012 – System Management 127 123 Figure 3: Median scores for the BAPCo SYSmark 2012 benchmark. Higher numbers are better. HDXPRT 2012 measures the performance of systems on common media usages. Figure 4 shows the median results of our HDXPRT 2012 tests. The Dell Latitude E5430 and Lenovo ThinkPad L430 performed comparably when handling media in the HDXPRT 2012 tests. HDXPRT 2012 Dell Latitude E5430 Lenovo ThinkPad L430 Create HD Score (Higher is better) 175 175 Media Organizer - minutes (lower is better) 5.85 5.99 Media Creator - minutes (lower is better) 12.26 12.36 Photo Blogger - minutes (lower is better) 8.72 8.75 Video Producer - minutes (lower is better) 2.61 2.57 Music Maker - minutes (lower is better) 2.71 2.71 Figure 4: Median scores for the HDXPRT 2012 benchmark. Performance comparison: Dell Latitude E5430 vs. Lenovo ThinkPad L430 A Principled Technologies test report 3
- 4. WHAT WE TESTED In this section, we present a brief overview of what we tested. For detailed system configuration information, see Appendix A. For step-by-step details on how we tested, see Appendix B. FutureMark 3DMark11 FutureMark’s 3DMark11 1.0.3 benchmark suite tests system GPU DirectX®11 performance and CPU workload processing performance, primarily to report a system’s 3D gaming capability. Tests include HDR rendering, shadow mapping, and pixel shading. For more information on this benchmark, see http://www.3dmark.com/3dmark11. BAPCo SYSmark 2012 BAPCo SYSmark 2012 is an application-based benchmark that tests performance in the following office workload scenarios: office productivity, media creation, Web development, data/financial analysis, 3D modeling, and system management. SYSmark 2012 records the time the system takes to complete each individual operation in each scenario. For more information on this benchmark, see http://www.bapco.com/products/sysmark2012/. HDXPRT 2012 The High Definition eXperience & Performance Ratings Test (HDXPRT) 2012, is a benchmark that evaluates the capabilities of PCs in consumer digital media uses, including Media Organizer Media Creator Photo Blogger Video Producer Music Maker For more information on HDXPRT 2012, see www.hdxprt.com. IN CONCLUSION Today’s workers do not want computers that keep them waiting. Selecting notebooks that perform everyday tasks quickly makes good business sense. In our tests, the Dell Latitude E5430 booted, shut down, performed office workload scenarios, and handled graphics and 3D more quickly than the Lenovo ThinkPad L430. This makes it an excellent choice for your employees. Performance comparison: Dell Latitude E5430 vs. Lenovo ThinkPad L430 A Principled Technologies test report 4
- 5. APPENDIX A – SYSTEM CONFIGURATION INFORMATION Figure 5 provides detailed configuration information for the test systems. System Dell Latitude E5430 Lenovo ThinkPad L430 General Number of processor packages 1 1 Number of cores per processor 2 2 Number of hardware threads per core 2 2 System power management policy Dell Energy Saver Enhanced Intel® SpeedStep® Processor power-saving option Enhanced Intel SpeedStep Technology Technology System dimensions (length x width x 13-3/4” x 9-5/8” x 1-3/8” 13-7/8” x 9-1/8” x 1-3/8” height) System weight 5 lbs. 1 oz. 5 lbs. CPU Vendor Intel Intel Name Core™ i5 Core i5 Model number 3210M 3210M Stepping E1 E1 Socket type and number of pins Socket 988B rPGA Socket 988B rPGA Core frequency (GHz) 2.50 2.50 L1 cache 32 KB + 32 KB (per core) 32 KB + 32 KB (per core) L2 cache 512 KB (256 KB per core) 512 KB (256 KB per core) L3 cache 3 MB 3 MB Platform Vendor Dell Lenovo Motherboard model number 0MYF02 2468CTO Motherboard chipset Intel QM77 Intel QM77 Lenovo G3ET36WW(1.10) BIOS name and version Dell A03 (06/03/2012) (06/20/2012) Memory module(s) Vendor and model number Hyundai HMT351S6CFR8C-PB Samsung M471B5273DH0-CK0 Type PC3-12800 PC3-12800 Speed (MHz) 1,600 1,600 Speed running in the system (MHz) 1,600 1,600 Timing/Latency (tCL-tRCD-tRP- 11-11-11-28 11-11-11-28 tRASmin) Size (MB) 4,096 4,096 Number of memory module(s) 1 1 Performance comparison: Dell Latitude E5430 vs. Lenovo ThinkPad L430 A Principled Technologies test report 5
- 6. System Dell Latitude E5430 Lenovo ThinkPad L430 Amount of RAM in system (GB) 4 4 Chip organization (single- Double-sided Double-sided sided/double-sided) Channel (single/dual) Single Single Hard disk Vendor and model number Hitachi HTS72323A7A364 Seagate ST320LT007-9ZV142 Number of disks in system 1 1 Size (GB) 320 320 Buffer size (MB) 16 16 RPM 7,200 7,200 Type SATA 3.0 Gb/s SATA 3.0 Gb/s Intel Mobile Express Chipset SATA Intel 7 Series Chipset Family SATA Controller RAID Controller AHCI Controller Driver Intel 11.0.0.1032 (11/29/2011) Intel 11.0.0.1032 (11/29/2011) Operating system Name Windows 7 Professional x64 Windows 7 Professional x64 Build number 7601 7601 Service Pack 1 1 File system NTFS NTFS Kernel ACPI x64-based PC ACPI x64-based PC Language English English Microsoft DirectX version DirectX 11 DirectX 11 Graphics Vendor and model number Intel HD Graphics 4000 Intel HD Graphics 4000 Type Integrated Integrated Chipset Intel HD Graphics 4000 Intel HD Graphics 4000 BIOS version 2132.8 2124.6 Total available graphics memory (MB) 1,696 1,675 Dedicated video memory (MB) 64 64 System video memory (MB) 0 0 Shared system memory (MB) 1,632 1,593 Resolution 1,366 x 768 x 32-bit 1,366 x 768 x 32-bit Driver Intel 8.15.10.2639 (02/01/2012) Intel 8.15.10.2696 (03/19/2012) Sound card/subsystem Vendor and model number IDT High Definition Audio Realtek High Definition Audio Driver IDT 6.10.0.6388 (02/13/2012) Realtek 6.0.1.6597 (03/20/2012) Performance comparison: Dell Latitude E5430 vs. Lenovo ThinkPad L430 A Principled Technologies test report 6
- 7. System Dell Latitude E5430 Lenovo ThinkPad L430 Ethernet Vendor and model number Broadcom® NetXtreme® 57xx Gigabit Realtek PCIe GBE Family Controller Driver Broadcom 15.0.0.17 (08/24/2011) Realtek 7.50.1123.2011 (11/23/2011) Wireless Wireless LAN PCI Express Half Mini Vendor and model number Dell Wireless 1540 Card Adapter Realtek 1005.25.825.2011 Driver Broadcom 5.100.82.112 (10/26/2011) (08/25/2011) Optical drive(s) Vendor and model number PLDS DS-8A8SH HL-DT-ST GT50N Type DVD-RW DVD RW USB ports Number 4 4 Type 1 x USB 2.0, 3 x USB 3.0 3 x USB 2.0, 1 x USB 3.0 Other Media card reader, HDMI, eSATA Media card reader IEEE 1394 ports Number 0 0 Monitor LCD type HD LED WXGA HD LED WXGA Screen size 14” 14” Refresh rate 60 Hz 60 Hz Battery Type Dell T54FJ Lenovo 45N1001 Size (length x width x height) 8-1/4” x 2” x 13/16” 8-1/8” x 2” x 3/4” Rated capacity 5300mAh / 11.1V (59Wh) 5200mAH / 10.8V (57Wh) Weight 11 oz. 11 oz. Figure 5: Configuration information for the systems we tested. Performance comparison: Dell Latitude E5430 vs. Lenovo ThinkPad L430 A Principled Technologies test report 7
- 8. APPENDIX B - HOW WE TESTED Measuring time to boot and shut down Boot and shutdown times 1. Simultaneously start the timer and boot the system. 2. Stop the timer when the Windows taskbar appears. 3. Record the result as the Boot time. 4. Bring up an administrative command prompt: a. Select Windows Start orb. b. Type cmd and right-click cmd.exe. c. Select Run as administrator. 5. Type Cmd.exe /c start /wait Rundll32.exe advapi32.dll,ProcessIdleTasks 6. Do not interact with the system until the command completes. 7. After the command completes, wait 5 minutes before running the test. 8. Simultaneously start the timer and shut down the system (Start→Shut Down). 9. Stop the timer when the power LED turns off. 10. Record the result as the shutdown time. 11. Repeat steps 1 through 10 two more times, and report the median of the three runs. Measuring graphics performance with 3DMark 11 1.0.3 Installing 3DMark 11 1. Purchase 3DMark 11 Professional Edition from http://community.futuremark.com/store/, and download the 3DMark_11_v103_installer.exe Windows package. 2. Install 3DMark 11 1.0.3 by double-clicking the 3DMark_11_v103.exe file; leave the default options set. 3. At the Choose Setup Language screen, choose English, and click Next. 4. At the Welcome screen, click Next. 5. At the License Agreement screen, click I accept the terms of the license agreement, and click Next. 6. At the Setup Type screen, click Complete, and click Next. 7. At the Ready to Install the Program screen, click Install. 8. When the 3DMark 11 Read Me page appears in your Web browser, review the document, and click Close when you are finished. 9. At the Setup Complete screen, click Finish to restart the computer. 10. Launch 3DMark 11 1.0.3 by double-clicking on the 3DMark 11 desktop icon. Enter the registration code, and click Register. 11. Exit 3DMark 11 1.0.3. Running 3DMark11 1.0.3 1. Boot the system and open an administrative command prompt: a. Select Windows Start orb. b. Type cmd and right-click cmd.exe. c. Select Run as administrator. 2. Type Cmd.exe /c start /wait Rundll32.exe advapi32.dll,ProcessIdleTasks Performance comparison: Dell Latitude E5430 vs. Lenovo ThinkPad L430 A Principled Technologies test report 8
- 9. 3. Do not interact with the system until the command completes. 4. After the command completes, wait 5 minutes before running the test. 5. Double-click the 3DMark 11 desktop icon to launch the benchmark. 6. In the 3DMark 11 Main section, click the Performance option under Preset, and select Benchmark tests only. 7. Click Run 3DMark 11. 8. When the benchmark run completes, take a screenshot of the results, and record them as follows: 3DMark Score Graphics Score Physics Score Combined Score 9. Shut down the system. 10. Repeat steps 1 through 9 two more times, and report the median of the three runs. Measuring performance with SYSmark 2012 Avoiding antivirus software conflicts SYSmark 2012 is not compatible with any virus-scanning software, so we uninstalled any such software that was present on the notebook PCs before we installed the benchmark. Avoiding pre-installed software conflicts SYSmark 2012 installs the following applications, which its test scripts employ: ABBYY FineReader Pro 10.0 Adobe Acrobat Pro 9 Adobe After Effects CS5 Adobe Dreamweaver CS5 Adobe Photoshop CS5 Extended Adobe Premiere Pro CS5 Adobe Flash Player 10.1 Autodesk® 3DS Max® 2011 Autodesk AutoCAD® 2011 Google SketchUp™ Pro 8 Microsoft Internet Explorer Microsoft Office 2010 Mozilla Firefox Installer Mozilla Firefox 3.6.8 Winzip Pro 14.5 If any of these applications are already on the system under test, they will cause problems with the benchmark due to software conflicts. To avoid any such issues, before we installed the benchmark, we uninstalled all conflicting pre- installed software applications, including different versions of any of the programs SYSmark 2012 uses. Setting up the test Using the SYSmark built-in Configuration Tool This tool supports three levels of configuration: Performance comparison: Dell Latitude E5430 vs. Lenovo ThinkPad L430 A Principled Technologies test report 9
- 10. 1. Only makes changes that are REQUIRED in order for the benchmark to run. 2. Additionally, makes changes that are RECOMMENDED for repeatable results. 3. Additionally, makes OPTIONAL changes that help ensure best results. The Configuration tool makes the following configuration changes at each of the three levels: Level 1 - Required Disables User Account Control (UAC) Disables Windows Update Disables System Sleep and Hibernate Disables Low Battery Actions Disables Network Proxies Level 2 - Recommended Creates BAPCo power scheme Sets Power Plan Type to High Performance Disables Windows Firewall Disables Windows Sidebar/Gadgets Disables Windows Pop-ups Disables Incoming Remote Desktop Connections Disables Windows Error Reporting Disables Screen Saver and Monitor Timeout Sets CPU Adaptive Mode Disables Desktop Slideshow Disables Disk Defrag Level 3 - Optional Sets Hard Disk Timeout Disables Windows Defender Disables System Restore Ignores Laptop Lid Close Sets Maximum Display Brightness Disables Adaptive Brightness Because we are testing how well each system does out of the box, we chose only the Required options in the Configuration tool. 1. Insert the SYSmark 2012 Install DVD into the notebook PC’s DVD drive. 2. When the Autoplay menu appears, click Run SYSmark2012_setup.exe. 3. At the Welcome screen, click Next. 4. Enter the serial number, and click Next. 5. Accept the license agreement, and click Next. 6. At the Choose Components screen, select Full, and click Next. 7. At the Choose Install Location screen, accept the default location of C:Program Files (x86)BAPCoSYSmark2012, and click Next. 8. At the Choose Start Menu Folder screen, click Install. 9. Insert Disc 2 when prompted. Performance comparison: Dell Latitude E5430 vs. Lenovo ThinkPad L430 A Principled Technologies test report 10
- 11. 10. At the InstallShield Wizard Complete screen, click Finish. 11. Download and install SYSmark 2012 Patch 2 http://www.bapco.com/support/. 12. Launch SYSmark 2012. 13. Click Configuration and choose only the Required options. 14. Click Apply, and restart the computer when prompted. Running the test 1. Launch SYSmark 2012 by double-clicking the desktop icon. 2. Enter a Project name and choose 3 iterations. 3. Click Run Benchmark. Getting the SYSmark 2012 results When SYSmark 2012 has completed, the Test Results Viewer appears. To submit these results to BAPCo, we saved the test results by performing the following steps: 1. Click Save. 2. Enter a name, and select FDR to save the results as an FDR file. 3. Click Save again, and select PDF to save the results as a PDF file. 4. Browse to the Documents directory where the result FDR and PDF files were saved. Measuring digital media capabilities with HDXPRT 2012 Setting up the test 1. Insert the HDXPRT DVD-ROM into your DVD drive. 2. At the HDXPRT Install screen, tlick Install HDXPRT. 3. Accept the HDXPRT end user license agreement. 4. After the setup is complete, select Yes, I want to restart my computer now, and click Finish. Running HDXPRT 1. Click the HDXPRT 2012 shortcut on the desktop. 2. Click Run HDXPRT. 3. Enter a test name, choose 3 iterations, and click Run. 4. The Results Screen automatically appears at the end of a successful run. The test results files are found in the C:ProgramFilesHDXPRTReports<TestName> directory. Performance comparison: Dell Latitude E5430 vs. Lenovo ThinkPad L430 A Principled Technologies test report 11
- 12. ABOUT PRINCIPLED TECHNOLOGIES We provide industry-leading technology assessment and fact-based marketing services. We bring to every assignment extensive experience with and expertise in all aspects of technology testing and analysis, from researching new technologies, to developing new methodologies, to Principled Technologies, Inc. testing with existing and new tools. 1007 Slater Road, Suite 300 Durham, NC, 27703 When the assessment is complete, we know how to present the results to www.principledtechnologies.com a broad range of target audiences. We provide our clients with the materials they need, from market-focused data to use in their own collateral to custom sales aids, such as test reports, performance assessments, and white papers. Every document reflects the results of our trusted independent analysis. We provide customized services that focus on our clients’ individual requirements. Whether the technology involves hardware, software, Web sites, or services, we offer the experience, expertise, and tools to help our clients assess how it will fare against its competition, its performance, its market readiness, and its quality and reliability. Our founders, Mark L. Van Name and Bill Catchings, have worked together in technology assessment for over 20 years. As journalists, they published over a thousand articles on a wide array of technology subjects. They created and led the Ziff-Davis Benchmark Operation, which developed such industry-standard benchmarks as Ziff Davis Media’s Winstone and WebBench. They founded and led eTesting Labs, and after the acquisition of that company by Lionbridge Technologies were the head and CTO of VeriTest. Principled Technologies is a registered trademark of Principled Technologies, Inc. All other product names are the trademarks of their respective owners. Disclaimer of Warranties; Limitation of Liability: PRINCIPLED TECHNOLOGIES, INC. HAS MADE REASONABLE EFFORTS TO ENSURE THE ACCURACY AND VALIDITY OF ITS TESTING, HOWEVER, PRINCIPLED TECHNOLOGIES, INC. SPECIFICALLY DISCLAIMS ANY WARRANTY, EXPRESSED OR IMPLIED, RELATING TO THE TEST RESULTS AND ANALYSIS, THEIR ACCURACY, COMPLETENESS OR QUALITY, INCLUDING ANY IMPLIED WARRANTY OF FITNESS FOR ANY PARTICULAR PURPOSE. ALL PERSONS OR ENTITIES RELYING ON THE RESULTS OF ANY TESTING DO SO AT THEIR OWN RISK, AND AGREE THAT PRINCIPLED TECHNOLOGIES, INC., ITS EMPLOYEES AND ITS SUBCONTRACTORS SHALL HAVE NO LIABILITY WHATSOEVER FROM ANY CLAIM OF LOSS OR DAMAGE ON ACCOUNT OF ANY ALLEGED ERROR OR DEFECT IN ANY TESTING PROCEDURE OR RESULT. IN NO EVENT SHALL PRINCIPLED TECHNOLOGIES, INC. BE LIABLE FOR INDIRECT, SPECIAL, INCIDENTAL, OR CONSEQUENTIAL DAMAGES IN CONNECTION WITH ITS TESTING, EVEN IF ADVISED OF THE POSSIBILITY OF SUCH DAMAGES. IN NO EVENT SHALL PRINCIPLED TECHNOLOGIES, INC.’S LIABILITY, INCLUDING FOR DIRECT DAMAGES, EXCEED THE AMOUNTS PAID IN CONNECTION WITH PRINCIPLED TECHNOLOGIES, INC.’S TESTING. CUSTOMER’S SOLE AND EXCLUSIVE REMEDIES ARE AS SET FORTH HEREIN. Performance comparison: Dell Latitude E5430 vs. Lenovo ThinkPad L430 A Principled Technologies test report 12