SlideShare una empresa de Scribd logo
1 de 4
Santanomics: The economics of the 
festive season 
At a glance… 
Businesses gearing up for Christmas 
In many countries, the Christmas period 
is a ‘make or break’ time for both retailers 
and their supply chain. Therefore, these 
businesses need to understand how their 
customers behave at this time of the year. 
Last year, total spending over the 
Christmas period in the majorWestern 
economies, which we define as the G7 
excluding Japan, amounted to around 
$445 billion. But which country has the 
most generous spenders over the 
Christmas period? 
Irish consumers are themost 
generous 
We have ranked countries based on their 
average spending per person over the 
Christmas period. Our results show that: 
• Ireland tops our Christmas spending 
league with expenditure of around 
$1,200 per person in 2013; 
• Amongst the majorWestern 
economies, the UK tops the rankings, 
spending around a thirdmore than 
consumers in the US on a per person 
basis; and 
• Of the Eurozone countries that we’ve 
looked at, French Christmas spending 
per person is the highest, followed by 
Germany. 
What about emergingmarkets? 
Our analysis shows per person spending 
over the Christmas period in Brazil and 
Russia is relatively low. This is 
unsurprising as a low GDP per capita 
Fig 1: Countrieswith a high GDP per capita tend to spend themost during 
Christmas 
1200 
1000 
800 
600 
400 
200 
0 
would typically be expected to be reflected 
in lower Christmas spending (see Figure 
1). 
In aggregate terms, it’s a different 
story 
However, the real might of the emerging 
economies comes through in the aggregate 
numbers. 
When looking at total, rather than per 
person spending over the Christmas 
period, we find that Brazil and Russia 
rank in the Top 10. This is because they 
are homes for a large number of 
consumers, even though individual 
spendingmight be comparatively low. 
Using this measure the US is a clear 
leader in overall Christmas spending as it 
has a ‘golden combination’ of a large 
number of consumers with high levels of 
per capita income. 
Scars of the financial crisis still 
evident 
Our analysis also shows that some of the 
scars of the financial crisis are still visible 
on spending over the Christmas period. 
Specifically our results show that: 
• Last year, Christmas spending per 
person in the US remained 10% lower 
compared to 2007 in real terms 
despite 1% growth in real income 
levels. 
• On the flipside, the UK and Germany 
are the only majorWestern economies 
where Christmas spending has 
exceeded pre-crisis levels in real 
terms. 
0 10 20 30 40 50 60 
2013 Christmas spending per person 
(constant 2013 US$) 
2013 GDP per capita (constant 2013 US$ 000s) 
Sources: PwC analysis, Datastream, national statistical agencies, World Bank 
Visit our blog for periodic updates at: 
pwc.blogs.com/economics_in_business 
Global EconomyWatch 
December 2014 
Ireland 
UK 
US 
Russia 
Brazil
Economic update: China cuts interest rates 
Fig 2: Slowing economic growth and falling 
inflation is not just aWesternproblem 
Below target inflation spurred the Central Bank into action 
Recent data releases have shown that both GDP growth and inflation are slowing in 
China. In Q3 output growth moderated slightly to 7.3% year on year, while the October 
inflation rate dropped to 1.6%, which is significantly below the central bank’s target of 
3.5% (see Figure 2). In an attempt to bring the inflation rate in line with the target, the 
People’s Bank of China (PBoC) took action in November. 
Sigh of relief for highly indebted private sector 
What happened? The PBoC cut the one-year benchmark loan interest rate by 0.4 
percentage points to 5.6% and the deposit interest rate by 0.25 percentage points to 
2.75%. These same percentage point changes were also applied across loans and deposits 
for other maturities. 
Impact of rate cut 
As mentioned in our previous analysis, ‘Growing pains: How fast is too fast for 
financialisation?’, China’s private sector loans to GDP ratio stands at around 180%, which 
is high relative to the rest of the E7 economies. Assuming the rate change is passed on by 
financial institutions to the private sector, this could affect business in two main ways: 
1. Those that are highly indebted could refinance their debt and use the savings to 
either pay down debt or choose to bolster their balance sheet through higher 
profitability. Either way this could contribute to financial stability as it would keep 
non-performing loans in check. 
2. Businesses which couldn’t access credit because of the higher rates could potentially 
do so now, with positive effects on economic activity (though the likely effect should 
not be overstated given the relatively small magnitude of the rate cut). 
4 
3 
2 
1 
8.5 
8.0 
7.5 
Sources: Datastream, National Bureau of Statistics of China 
Scars fromfinancial crisis still visible on Christmas spending 
Emergingmarkets are spendingmore 
during Christmas…. 
For most G7 economies real GDP is now above 
pre-crisis levels. However, does this trend also 
apply to spending over the Christmas period? 
To answer this, we estimated spending over the 
Christmas period using annual household 
consumption data from theWorld Bank and 
monthly retail sales data from national statistical 
agencies (see Assumptions and methodology box 
for more details). Doing so gave us a broad 
indication of cross-country differences in 
spending over the Christmas period as opposed 
to precise dollar estimations and therefore the 
results should be treated with some caution. 
Figure 3 shows that the evidence on the recovery 
of Christmas spending after the financial crisis is 
mixed. In the two largest emerging markets that 
celebrate Christmas, Brazil and Russia, 
consumers spent more in real terms last year 
5 
4 
3 
2 
1 
sensitive to fluctuations in income levels in 
the peripheral economies compared to the 
core economies. This suggests that 
consumers in the peripheral economies view 
Christmas spending as something of a luxury 
and are therefore more likely to cut-back on 
this type of discretionary spending at times 
of crisis. 
• At the other end of the spectrum Irish per 
person Christmas spending is the least 
responsive to changes in income compared 
to the other Eurozone economies in our 
sample. This could perhaps be explained by 
cultural differences whereby local traditions 
assign greater importance to Christmas 
compared to other events during the year. 
This trend is also consistent with Figure 1 
which shows that real Irish per person 
Christmas spending is proportionally higher 
for its level of real GDP per capita. 
during the Christmas period than in 2007. This 
makes sense as their economies have grown at 
reasonably strong rates since the Global 
Financial Crisis (despite some recent slowdown). 
…but scars fromthe crisis are still visible 
in some advanced economies 
In contrast, the picture is less clear for advanced 
economies. Figure 3 shows that spending per 
person over the Christmas period has recovered 
to above pre-crisis levels in Germany and the 
UK, but not in the US. This is surprising, as US 
GDP per capita grew by 1% overall in real terms 
since 2007 compared to a decrease of 6% overall 
in the UK. This pattern could suggest that UK 
consumers are less willing to cut back on 
Christmas spending compared to those in the 
US. 
Focusing on the Eurozone, our analysis suggests 
a core-periphery divide with those in the 
periphery cutting back drastically on Christmas 
spending. In Greece, for example, real per 
person Christmas spending decreased by around 
60% overall in the six years to 2013, which is the 
worst performance out of the 12 countries in our 
sample. Figure 3 also shows that Spanish and 
Portuguese real Christmas spending per person 
remains significantly below 2007 levels. This 
makes sense as the austerity measures 
implemented in the peripheral economies 
included significant nominal wage cuts, which 
have directly affected the purchasing power of 
consumers, and remain at lower levels compared 
to the pre-crisis era. 
Christmas a luxury good? 
Figure 4 shows the sensitivity of real spending 
per person over the Christmas period to the 
changes in real GDP per capita (also known as 
income elasticity of demand for ‘Christmas 
spending’). This analysis shows that: 
• Per person Christmas spending is more 
Fig 4: Christmas spending has been more 
responsive to income in the periphery since 2007 
Sources: PwC analysis, Datastream, national statistical 
agencies, World Bank 
Fig 3: Christmas spending in the US has still 
not recovered since the financial crisis 
60% 
40% 
20% 
0% 
-20% 
-40% 
-60% 
Sources: PwC analysis, Datastream, national 
statistical agencies, World Bank 
0 
7.0 
CPI inflation rate (%) 
Real GDP growth in China (Y-o-Y %) 
Real GDP growth CPI inflation rate 
0 
Income elasticity of demand of 
‘Christmas spending’ (2007-13) 
-80% 
Russia 
Germany 
UK 
Brazil 
Ireland 
France 
Canada 
US 
Italy 
Portugal 
Spain 
Greece 
Overall percent change in per person 
Christmas spending (2007-13)
Santanomics: Who spends the most during the 
festive season? 
Christmas spending is a ‘make or break’ event for retailers 
In most countries retail sales spike during the last twomonths of the 
calendar year. This is because households temporarily increase their 
discretionary spending for Christmas. Retailers know they have to get it 
right during the Christmas period, which is a ‘make or break’ event, as poor 
sales in the last twomonths of the year can have a disproportionate impact 
on their profitability. 
But the Christmas period is not just important for retailers as its effects can 
be felt throughout the entire supply chain. As a result, affected businesses 
need to have a good understanding of the seasonal spending habits of their 
customers. So how do countries rank in their Christmas spending patterns 
and what messages can businesses draw from this? 
Hey Big Spender! 
Our analysis (see Table 1 and our ‘Assumptions and methodology’ box 
below) shows that Ireland emerges as the leader in our league table of 
spenders over the Christmas period. Specifically, Irish consumers spent 
around $1,200 per person at Christmas in 2013.We also find that spending 
increases by around 16% on average during the months of November and 
December compared to the rest of the year. This emphasises the importance 
of the festive season for the revenue cycle of affected businesses. 
However, our analysis for 2013 also points to other important trends within 
the majorWestern economies, which we define as the G7 excluding Japan. 
Specifically: 
• UK households are the most generous spenders in the majorWestern 
economies during the Christmas period in per person terms (see Table 
1), comfortably outstripping their US counterparts by around one third. 
• From a European perspective, German households spend around half 
that of their UK peers. 
• Italian households spend even less than Germany and this appears to 
have been accentuated by their stagnating economy. 
Emerging markets small in per person terms… 
But what about emerging markets? We have looked at the two biggest 
emerging markets that celebrate Christmas, Brazil and Russia. Table 1 
shows that they rank at the bottom in terms of real per person spending over 
the Christmas period. This is not surprising as Figure 1 shows that there is a 
strong and positive correlation between GDP per capita and Christmas 
spending per person. However, this correlation also points out the untapped 
business potential of emerging markets as we expect that the gradual catch-up 
of income levels in emerging economies toWestern standards will lead to 
greater Christmas spending in the future. 
…but big in aggregate numbers 
On a more general point, we expect emerging market spending over the 
Christmas period to continue to grow in the future driven by the following 
trends: 
• Gradual convergence 0f income levels in emerging economies towards 
Western levels (although this will be a very slow process given the large 
difference in starting points); and 
• An increase in the number of consumers in some younger emerging 
markets. 
This is an important distinction to make and we have captured the latter 
point by ranking real Christmas spending on an aggregate basis in Table 2. 
Doing so, gives a more complete picture of Christmas spending. The key 
messages we draw out are that: 
• Brazilian Christmas spending is bigger in aggregate terms than that of 
Italy. This is despite scoring lower on the per person measure and 
reflects the large consumer base present in Brazil. 
• But the US remains by far the biggest Christmas spender in the world 
consuming over $240 billion per annum, which is more than that of the 
UK, Germany, France and Brazil combined. This is because the US has 
the ‘golden combination’ of a large and affluent consumer base. 
Table 1: Irish consumers are themost generouswhen 
it comes to Christmas spending 
Rank Christmas spending 
per person (constant 
2013 US$) 
2003 2007 2013 Country 2003 2007 2013 
1 1 1 Ireland 1156 1244 1184 
2 2 2 UK 1018 1033 1065 
3 3 3 US 956 862 776 
5 4 4 Canada 691 753 682 
8 5 5 France 496 606 574 
6 8 6 Germany 606 471 520 
4 6 7 Italy 754 538 462 
9 9 8 Portugal 390 469 357 
7 7 9 Greece 498 506 188 
10 10 10 Spain 330 258 184 
11 11 11 Brazil 132 162 166 
12 12 12 Russia 34 67 93 
Sources: PwC analysis, Datastream, national statistical 
agencies, World Bank 
Table 2: But the US tops the list in aggregate terms 
2013 total Christmas spending (constant 2013 US$ bn) 
Rank Country Spending Rank Country Spending 
1 US 245 7 Canada 24 
2 UK 68 8 Russia 13 
3 Germany 42 9 Spain 9 
4 France 38 10 Ireland 5 
5 Brazil 33 11 Portugal 4 
6 Italy 28 12 Greece 2 
Sources: PwC analysis, Datastream, national statistical 
agencies, World Bank. 
Assumptions and methodology 
The following approach was used to obtain estimates of 
Christmas spending: 
• We obtained annual household consumption data 
from theWorld Bank and monthly retail sales data 
from national statistical agencies. 
• We used the retail sales data to convert annual 
household consumption data into a monthly series. 
To do this we assumed that household consumption 
follows the same trend as retail sales. 
• Using this new series we defined and estimated 
Christmas spending as the excess expenditure arising 
in November and December compared to the other 
months of the year. However other seasonal 
spending patterns may exist during a calendar year 
and so these numbers should be interpreted as giving 
a broad indication of cross-country differences in 
Christmas spending habits as opposed to precise 
dollar estimates. 
• We limited our analysis to the G7 excluding Japan, 
Brazil and Russia, and the peripheral Eurozone 
economies which we monitor. We excluded China, 
Japan and India as Christmas is not a traditional 
holiday in these countries. 
• All of our numbers are in constant 2013 US dollar 
terms.
Projections: December 2014 
Real Share of 2013 world GDP GDP growth Inflat ion 
PPP* MER* 2013 2014p 2015p 2016-2020p 2013 2014p 2015p 2016-2020p 
Global (Market Exchange Rates) 100% 2.7 2.8 3.1 3.2 2.4 2.6 2.7 2.6 
Global (PPP rates) 100% 3.3 3.3 3.6 3.9 
United States 16.4% 22.4% 2.2 2.3 3.2 2.4 1 .5 1 .7 1 .9 1 .9 
China 1 5.8% 1 2.7% 7 .7 7 .4 7 .2 7 .0 2.6 2.2 2.3 3.4 
Japan 4.6% 6.6% 1 .5 0.5 0.2 1 .2 0.4 2.7 2.0 1 .5 
United Kingdom 2.3% 3.4% 1 .7 3.0 2.5 2.3 2.6 1 .6 1 .6 2.0 
Eurozone 1 2.3% 1 7 .1% -0.5 0.8 1 .2 1 .5 1 .4 0.5 1 .0 1 .5 
France 2.5% 3.8% 0.1 0.5 1 .0 1 .7 1 .0 0.7 1 .0 1 .5 
Germany 3.4% 4.9% 0.2 1 .2 1 .2 1 .3 1 .6 0.9 1 .5 1 .7 
Greece 0.3% 0.3% -3.9 0.2 1 .8 3.0 -0.9 -1 .2 -0.3 1 .3 
Ireland 0.2% 0.3% 0.2 4.2 3.2 2.5 0.5 0.5 1 .0 1 .5 
Italy 2.0% 2.8% -1 .8 -0.3 0.6 1 .0 1 .3 0.3 0.5 1 .4 
Netherlands 0.8% 1 .1% -0.7 0.8 1 .5 2.0 2.6 0.9 1 .2 1 .4 
Portugal 0.3% 0.3% -1 .0 0.9 1 .3 1 .8 0.4 -0.1 0.5 1 .5 
Spain 1 .5% 1 .8% -1 .2 1 .3 1 .8 1 .5 1 .5 -0.0 0.5 1 .0 
Poland 0.9% 0.7% 1 .6 3.3 3.2 3.5 1 .2 0.2 1 .0 2.5 
Russia 3.4% 2.8% 1 .3 0.1 -1 .0 2.0 6.8 7 .8 6.8 5.0 
Turkey 1 .4% 1 .1% 4.1 2.8 3.4 4.5 7 .5 8.9 7 .1 4.8 
Australia 1 .0% 2.0% 2.3 2.8 2.6 3.1 2.2 2.6 2.5 2.7 
India 6.6% 2.5% 4.7 5.4 6.5 6.5 6.3 4.4 4.9 6.0 
Indonesia 2.3% 1 .2% 5.8 5.2 5.8 6.3 6.4 6.2 5.9 5.1 
South Korea 1 .7% 1 .7% 3.0 3.4 3.6 3.8 1 .3 1 .4 1 .4 2.9 
Argentina 0.9% 0.8% 2.9 -0.4 -0.1 3.3 - 25.0 25.0 - 
Brazil 3.0% 3.0% 2.3 0.5 1 .0 4.0 6.2 6.3 5.5 4.8 
Canada 1 .5% 2.4% 2.0 2.4 2.5 2.2 1 .0 2.0 1 .8 2.1 
Mexico 2.0% 1 .7% 1 .7 2.3 3.7 3.6 3.8 3.9 3.7 3.6 
South Africa 0.7% 0.5% 1 .9 1 .4 2.3 3.8 5.8 6.2 5.6 4.8 
Nigeria 1 .0% 0.7% 5.5 6.2 6.2 5.7 8.5 8.4 8.7 7 .3 
Saudi Arabia 1 .5% 1 .0% 4.0 4.3 4.2 4.3 3.5 2.8 3.2 4.0 
Sources: PwC analysis, National statistical authorities, Thomson Datastream and IMF. All inflation indicators relate to the Consumer Price Index (CPI), with the 
exception of the Indian indicator which refers to the Wholesale Price Index (WPI). Argentina's inflation projections use the IPCNu Index released by INDEC which is 
based in the fourth quarter of 2013 (therefore we do not provide a 2013 estimate). We will provide a 2016-2020 inflation projection once a longer time series of data is 
available. GDP projections for Argentina use the 2004 base year national account data (previously base year 1993). Our Nigeria GDP projections relate to the new 
rebased GDP figures but are subject to high margins of error. Also note that the tables above form our main scenario projections and are therefore subject to 
considerable uncertainties. We recommend that our clients look at a range of alternative scenarios. 
Interest rate outlook of major economies 
Current rate (Last change) Expectation Next meeting 
Federal Reserve 0-0.25% (December 2008) Rate to start to rise during the second half of 2015 16-17 December 
European Central Bank 0.05% (September 2014) Rates on hold following decrease in September 22 January 
Bank of England 0.5% (March 2009) Rate to start rising gradually during 2015 8 January 
Richard Boxshall 
T: +44 (0) 20 7213 2079 
E: richard.boxshall@uk.pwc.com 
Barret Kupelian 
T: + 44 (0) 20 7213 1579 
E: barret.g.kupelian@uk.pwc.com 
Conor Lambe 
T: +44 (0) 20 7212 8783 
E: conor.r.lambe@uk.pwc.com 
PwC’s Global Consumer Index 
Global consumer spending growth has 
continued its downward trend for the fifth 
consecutive month, remaining below the 
long-term average. 
Although industrial production figures have 
improved, global stock markets are still 
experiencing jitters and money supply growth 
has slowed, underlining weakening growth in 
China, Japan and Europe, which could 
dampen consumer spending growth in the 
short-term. 
4.0% 
3.5% 
3.0% 
2.5% 
2.0% 
1.5% 
1.0% 
0.5% 
0.0% 
Long-term growth 
2.2% 
Dec-13 
Jan-14 
Feb-14 
Mar-14 
Apr-14 
May-14 
Jun-14 
Jul-14 
Aug-14 
Sep-14 
Oct-14 
Nov-14 
YoY growth 
The GCI is a monthly updated index providing an early steer on consumer spending and 
growth prospects in the world’s 20 largest economies. For more information, please visit 
www.pwc.co.uk/globalconsumerindex 
We help you understand how big economic, demographic, social, and environmental changes affect your organisation by setting out scenarios that 
identify growth opportunities and risks on a global, regional, national and local level.We help make strategic and tactical operational, pricing and 
investment decisions to support business value creation.We work together with you to achieve sustainable growth. 
This publication has been prepared for general guidance on matters of interest only, and does not constitute professional advice. You should not act upon the information contained in this 
publication without obtaining specific professional advice. No representation or warranty (express or implied) is given as to the accuracy or completeness of the information contained in this 
publication, and, to the extent permitted by law, PricewaterhouseCoopers LLP, its members, employees and agents do not accept or assume any liability, responsibility or duty of care for any 
consequences of you or anyone else acting, or refraining to act, in reliance on the information contained in this publication or for any decision based on it. 
© 2014 PricewaterhouseCoopers LLP. All rights reserved. In this document, “PwC” refers to the UK member firm, and may sometimes refer to the PwC network. Each member firm is a separate 
legal entity. Please see www.pwc.com/structure for further details.

Más contenido relacionado

Destacado

Digital Transformation & the Future of Retail
Digital Transformation & the Future of Retail Digital Transformation & the Future of Retail
Digital Transformation & the Future of Retail ShiSh Shridhar
 
#NRF 2016 - seen by HighCo
#NRF 2016 - seen by HighCo#NRF 2016 - seen by HighCo
#NRF 2016 - seen by HighCoHighCo DATA
 
Bash.today для школы forbes
Bash.today для школы forbesBash.today для школы forbes
Bash.today для школы forbesMikael Saakiants
 
Nrf 2016 - Observations and reflections
Nrf 2016 - Observations and reflectionsNrf 2016 - Observations and reflections
Nrf 2016 - Observations and reflectionsCapgemini
 
Visual CV - based on a timeline
Visual CV - based on a timelineVisual CV - based on a timeline
Visual CV - based on a timelinePeter King
 

Destacado (6)

Digital Transformation & the Future of Retail
Digital Transformation & the Future of Retail Digital Transformation & the Future of Retail
Digital Transformation & the Future of Retail
 
#NRF 2016 - seen by HighCo
#NRF 2016 - seen by HighCo#NRF 2016 - seen by HighCo
#NRF 2016 - seen by HighCo
 
Manual de Identidad Corporativa
Manual de Identidad CorporativaManual de Identidad Corporativa
Manual de Identidad Corporativa
 
Bash.today для школы forbes
Bash.today для школы forbesBash.today для школы forbes
Bash.today для школы forbes
 
Nrf 2016 - Observations and reflections
Nrf 2016 - Observations and reflectionsNrf 2016 - Observations and reflections
Nrf 2016 - Observations and reflections
 
Visual CV - based on a timeline
Visual CV - based on a timelineVisual CV - based on a timeline
Visual CV - based on a timeline
 

Más de PwC France

Etude PwC "20ème édition de la CEO Survey" - Janvier 2017
Etude PwC "20ème édition de la CEO Survey" - Janvier 2017Etude PwC "20ème édition de la CEO Survey" - Janvier 2017
Etude PwC "20ème édition de la CEO Survey" - Janvier 2017PwC France
 
Etude PwC "Carbon Factor" (nov. 2015)
Etude PwC "Carbon Factor" (nov. 2015)Etude PwC "Carbon Factor" (nov. 2015)
Etude PwC "Carbon Factor" (nov. 2015)PwC France
 
Etude PwC : La transition énergétique pour la croissance verte (nov 2015)
Etude PwC : La transition énergétique pour la croissance verte (nov 2015)Etude PwC : La transition énergétique pour la croissance verte (nov 2015)
Etude PwC : La transition énergétique pour la croissance verte (nov 2015)PwC France
 
Etude PwC "Total Retail 2015" Sur quoi miser aujourd’hui pour réenchanter la ...
Etude PwC "Total Retail 2015" Sur quoi miser aujourd’hui pour réenchanter la ...Etude PwC "Total Retail 2015" Sur quoi miser aujourd’hui pour réenchanter la ...
Etude PwC "Total Retail 2015" Sur quoi miser aujourd’hui pour réenchanter la ...PwC France
 
GEMO 2016 : un digital de plus en plus cannibale ?
GEMO 2016  : un digital de plus en plus cannibale ?GEMO 2016  : un digital de plus en plus cannibale ?
GEMO 2016 : un digital de plus en plus cannibale ?PwC France
 
Infographie PwC GEMO 2016 sur l'industrie Médias et Loisirs (juin 2015)
Infographie PwC GEMO 2016 sur l'industrie Médias et Loisirs (juin 2015)Infographie PwC GEMO 2016 sur l'industrie Médias et Loisirs (juin 2015)
Infographie PwC GEMO 2016 sur l'industrie Médias et Loisirs (juin 2015)PwC France
 
Etude PwC Low Carbon Economy Index (oct. 2015)
Etude PwC Low Carbon Economy Index (oct. 2015)Etude PwC Low Carbon Economy Index (oct. 2015)
Etude PwC Low Carbon Economy Index (oct. 2015)PwC France
 
Etude FCD, ESSEC et PwC sur la distribution responsable (août 2015)
Etude FCD, ESSEC et PwC sur la distribution responsable (août 2015)Etude FCD, ESSEC et PwC sur la distribution responsable (août 2015)
Etude FCD, ESSEC et PwC sur la distribution responsable (août 2015)PwC France
 
Etude PwC IPO Watch
Etude PwC IPO WatchEtude PwC IPO Watch
Etude PwC IPO WatchPwC France
 
Etude PwC CEO Survey Talent "People Strategy for the Digital Age" (juillet 2015)
Etude PwC CEO Survey Talent "People Strategy for the Digital Age" (juillet 2015)Etude PwC CEO Survey Talent "People Strategy for the Digital Age" (juillet 2015)
Etude PwC CEO Survey Talent "People Strategy for the Digital Age" (juillet 2015)PwC France
 
Etude PwC Golden Age Index (juin 2015)
Etude PwC Golden Age Index (juin 2015)Etude PwC Golden Age Index (juin 2015)
Etude PwC Golden Age Index (juin 2015)PwC France
 
Etude PwC Global Economy Watch (juin 2015)
Etude PwC Global Economy Watch (juin 2015)Etude PwC Global Economy Watch (juin 2015)
Etude PwC Global Economy Watch (juin 2015)PwC France
 
Etude PwC et Essec "Grande consommation 1985 - 2015 - 2045"
Etude PwC et Essec "Grande consommation 1985 - 2015 - 2045"Etude PwC et Essec "Grande consommation 1985 - 2015 - 2045"
Etude PwC et Essec "Grande consommation 1985 - 2015 - 2045"PwC France
 
Etude PwC sur le Top 100 des entreprises les mieux valorisées au monde en 201...
Etude PwC sur le Top 100 des entreprises les mieux valorisées au monde en 201...Etude PwC sur le Top 100 des entreprises les mieux valorisées au monde en 201...
Etude PwC sur le Top 100 des entreprises les mieux valorisées au monde en 201...PwC France
 
Etude PwC "Point of View: Enterprise Portfolio & Program Management" (mai 2015)
Etude PwC "Point of View: Enterprise Portfolio & Program Management" (mai 2015)Etude PwC "Point of View: Enterprise Portfolio & Program Management" (mai 2015)
Etude PwC "Point of View: Enterprise Portfolio & Program Management" (mai 2015)PwC France
 
Etude PwC "Bridging the gap" sur les investisseurs institutionnels (mai 2015)
Etude PwC "Bridging the gap" sur les investisseurs institutionnels (mai 2015)Etude PwC "Bridging the gap" sur les investisseurs institutionnels (mai 2015)
Etude PwC "Bridging the gap" sur les investisseurs institutionnels (mai 2015)PwC France
 
Etude PwC, AFDEL et SNJV sur "Les 100 digital"
Etude PwC, AFDEL et SNJV sur "Les 100 digital"Etude PwC, AFDEL et SNJV sur "Les 100 digital"
Etude PwC, AFDEL et SNJV sur "Les 100 digital"PwC France
 
Etude PwC Global Economy Watch (mai 2015)
Etude PwC Global Economy Watch (mai 2015)Etude PwC Global Economy Watch (mai 2015)
Etude PwC Global Economy Watch (mai 2015)PwC France
 
Etude PwC sur l'économie collaborative (mai 2015)
Etude PwC sur l'économie collaborative (mai 2015)Etude PwC sur l'économie collaborative (mai 2015)
Etude PwC sur l'économie collaborative (mai 2015)PwC France
 
Etude PwC sur l'intérêt des investisseurs pour l’Afrique (avril 2015)
Etude PwC sur l'intérêt des investisseurs pour l’Afrique (avril 2015)Etude PwC sur l'intérêt des investisseurs pour l’Afrique (avril 2015)
Etude PwC sur l'intérêt des investisseurs pour l’Afrique (avril 2015)PwC France
 

Más de PwC France (20)

Etude PwC "20ème édition de la CEO Survey" - Janvier 2017
Etude PwC "20ème édition de la CEO Survey" - Janvier 2017Etude PwC "20ème édition de la CEO Survey" - Janvier 2017
Etude PwC "20ème édition de la CEO Survey" - Janvier 2017
 
Etude PwC "Carbon Factor" (nov. 2015)
Etude PwC "Carbon Factor" (nov. 2015)Etude PwC "Carbon Factor" (nov. 2015)
Etude PwC "Carbon Factor" (nov. 2015)
 
Etude PwC : La transition énergétique pour la croissance verte (nov 2015)
Etude PwC : La transition énergétique pour la croissance verte (nov 2015)Etude PwC : La transition énergétique pour la croissance verte (nov 2015)
Etude PwC : La transition énergétique pour la croissance verte (nov 2015)
 
Etude PwC "Total Retail 2015" Sur quoi miser aujourd’hui pour réenchanter la ...
Etude PwC "Total Retail 2015" Sur quoi miser aujourd’hui pour réenchanter la ...Etude PwC "Total Retail 2015" Sur quoi miser aujourd’hui pour réenchanter la ...
Etude PwC "Total Retail 2015" Sur quoi miser aujourd’hui pour réenchanter la ...
 
GEMO 2016 : un digital de plus en plus cannibale ?
GEMO 2016  : un digital de plus en plus cannibale ?GEMO 2016  : un digital de plus en plus cannibale ?
GEMO 2016 : un digital de plus en plus cannibale ?
 
Infographie PwC GEMO 2016 sur l'industrie Médias et Loisirs (juin 2015)
Infographie PwC GEMO 2016 sur l'industrie Médias et Loisirs (juin 2015)Infographie PwC GEMO 2016 sur l'industrie Médias et Loisirs (juin 2015)
Infographie PwC GEMO 2016 sur l'industrie Médias et Loisirs (juin 2015)
 
Etude PwC Low Carbon Economy Index (oct. 2015)
Etude PwC Low Carbon Economy Index (oct. 2015)Etude PwC Low Carbon Economy Index (oct. 2015)
Etude PwC Low Carbon Economy Index (oct. 2015)
 
Etude FCD, ESSEC et PwC sur la distribution responsable (août 2015)
Etude FCD, ESSEC et PwC sur la distribution responsable (août 2015)Etude FCD, ESSEC et PwC sur la distribution responsable (août 2015)
Etude FCD, ESSEC et PwC sur la distribution responsable (août 2015)
 
Etude PwC IPO Watch
Etude PwC IPO WatchEtude PwC IPO Watch
Etude PwC IPO Watch
 
Etude PwC CEO Survey Talent "People Strategy for the Digital Age" (juillet 2015)
Etude PwC CEO Survey Talent "People Strategy for the Digital Age" (juillet 2015)Etude PwC CEO Survey Talent "People Strategy for the Digital Age" (juillet 2015)
Etude PwC CEO Survey Talent "People Strategy for the Digital Age" (juillet 2015)
 
Etude PwC Golden Age Index (juin 2015)
Etude PwC Golden Age Index (juin 2015)Etude PwC Golden Age Index (juin 2015)
Etude PwC Golden Age Index (juin 2015)
 
Etude PwC Global Economy Watch (juin 2015)
Etude PwC Global Economy Watch (juin 2015)Etude PwC Global Economy Watch (juin 2015)
Etude PwC Global Economy Watch (juin 2015)
 
Etude PwC et Essec "Grande consommation 1985 - 2015 - 2045"
Etude PwC et Essec "Grande consommation 1985 - 2015 - 2045"Etude PwC et Essec "Grande consommation 1985 - 2015 - 2045"
Etude PwC et Essec "Grande consommation 1985 - 2015 - 2045"
 
Etude PwC sur le Top 100 des entreprises les mieux valorisées au monde en 201...
Etude PwC sur le Top 100 des entreprises les mieux valorisées au monde en 201...Etude PwC sur le Top 100 des entreprises les mieux valorisées au monde en 201...
Etude PwC sur le Top 100 des entreprises les mieux valorisées au monde en 201...
 
Etude PwC "Point of View: Enterprise Portfolio & Program Management" (mai 2015)
Etude PwC "Point of View: Enterprise Portfolio & Program Management" (mai 2015)Etude PwC "Point of View: Enterprise Portfolio & Program Management" (mai 2015)
Etude PwC "Point of View: Enterprise Portfolio & Program Management" (mai 2015)
 
Etude PwC "Bridging the gap" sur les investisseurs institutionnels (mai 2015)
Etude PwC "Bridging the gap" sur les investisseurs institutionnels (mai 2015)Etude PwC "Bridging the gap" sur les investisseurs institutionnels (mai 2015)
Etude PwC "Bridging the gap" sur les investisseurs institutionnels (mai 2015)
 
Etude PwC, AFDEL et SNJV sur "Les 100 digital"
Etude PwC, AFDEL et SNJV sur "Les 100 digital"Etude PwC, AFDEL et SNJV sur "Les 100 digital"
Etude PwC, AFDEL et SNJV sur "Les 100 digital"
 
Etude PwC Global Economy Watch (mai 2015)
Etude PwC Global Economy Watch (mai 2015)Etude PwC Global Economy Watch (mai 2015)
Etude PwC Global Economy Watch (mai 2015)
 
Etude PwC sur l'économie collaborative (mai 2015)
Etude PwC sur l'économie collaborative (mai 2015)Etude PwC sur l'économie collaborative (mai 2015)
Etude PwC sur l'économie collaborative (mai 2015)
 
Etude PwC sur l'intérêt des investisseurs pour l’Afrique (avril 2015)
Etude PwC sur l'intérêt des investisseurs pour l’Afrique (avril 2015)Etude PwC sur l'intérêt des investisseurs pour l’Afrique (avril 2015)
Etude PwC sur l'intérêt des investisseurs pour l’Afrique (avril 2015)
 

Último

Governor Olli Rehn: Dialling back monetary restraint
Governor Olli Rehn: Dialling back monetary restraintGovernor Olli Rehn: Dialling back monetary restraint
Governor Olli Rehn: Dialling back monetary restraintSuomen Pankki
 
House of Commons ; CDC schemes overview document
House of Commons ; CDC schemes overview documentHouse of Commons ; CDC schemes overview document
House of Commons ; CDC schemes overview documentHenry Tapper
 
Unveiling Business Expansion Trends in 2024
Unveiling Business Expansion Trends in 2024Unveiling Business Expansion Trends in 2024
Unveiling Business Expansion Trends in 2024Champak Jhagmag
 
project management information system lecture notes
project management information system lecture notesproject management information system lecture notes
project management information system lecture notesongomchris
 
NO1 Certified Amil Baba In Lahore Kala Jadu In Lahore Best Amil In Lahore Ami...
NO1 Certified Amil Baba In Lahore Kala Jadu In Lahore Best Amil In Lahore Ami...NO1 Certified Amil Baba In Lahore Kala Jadu In Lahore Best Amil In Lahore Ami...
NO1 Certified Amil Baba In Lahore Kala Jadu In Lahore Best Amil In Lahore Ami...Amil baba
 
magnetic-pensions-a-new-blueprint-for-the-dc-landscape.pdf
magnetic-pensions-a-new-blueprint-for-the-dc-landscape.pdfmagnetic-pensions-a-new-blueprint-for-the-dc-landscape.pdf
magnetic-pensions-a-new-blueprint-for-the-dc-landscape.pdfHenry Tapper
 
Kempen ' UK DB Endgame Paper Apr 24 final3.pdf
Kempen ' UK DB Endgame Paper Apr 24 final3.pdfKempen ' UK DB Endgame Paper Apr 24 final3.pdf
Kempen ' UK DB Endgame Paper Apr 24 final3.pdfHenry Tapper
 
Vp Girls near me Delhi Call Now or WhatsApp
Vp Girls near me Delhi Call Now or WhatsAppVp Girls near me Delhi Call Now or WhatsApp
Vp Girls near me Delhi Call Now or WhatsAppmiss dipika
 
Economic Risk Factor Update: April 2024 [SlideShare]
Economic Risk Factor Update: April 2024 [SlideShare]Economic Risk Factor Update: April 2024 [SlideShare]
Economic Risk Factor Update: April 2024 [SlideShare]Commonwealth
 
PMFBY , Pradhan Mantri Fasal bima yojna
PMFBY , Pradhan Mantri  Fasal bima yojnaPMFBY , Pradhan Mantri  Fasal bima yojna
PMFBY , Pradhan Mantri Fasal bima yojnaDharmendra Kumar
 
Role of Information and technology in banking and finance .pptx
Role of Information and technology in banking and finance .pptxRole of Information and technology in banking and finance .pptx
Role of Information and technology in banking and finance .pptxNarayaniTripathi2
 
Financial analysis on Risk and Return.ppt
Financial analysis on Risk and Return.pptFinancial analysis on Risk and Return.ppt
Financial analysis on Risk and Return.ppttadegebreyesus
 
NO1 WorldWide Genuine vashikaran specialist Vashikaran baba near Lahore Vashi...
NO1 WorldWide Genuine vashikaran specialist Vashikaran baba near Lahore Vashi...NO1 WorldWide Genuine vashikaran specialist Vashikaran baba near Lahore Vashi...
NO1 WorldWide Genuine vashikaran specialist Vashikaran baba near Lahore Vashi...Amil baba
 
Stock Market Brief Deck FOR 4/17 video.pdf
Stock Market Brief Deck FOR 4/17 video.pdfStock Market Brief Deck FOR 4/17 video.pdf
Stock Market Brief Deck FOR 4/17 video.pdfMichael Silva
 
The Inspirational Story of Julio Herrera Velutini - Global Finance Leader
The Inspirational Story of Julio Herrera Velutini - Global Finance LeaderThe Inspirational Story of Julio Herrera Velutini - Global Finance Leader
The Inspirational Story of Julio Herrera Velutini - Global Finance LeaderArianna Varetto
 
AnyConv.com__FSS Advance Retail & Distribution - 15.06.17.ppt
AnyConv.com__FSS Advance Retail & Distribution - 15.06.17.pptAnyConv.com__FSS Advance Retail & Distribution - 15.06.17.ppt
AnyConv.com__FSS Advance Retail & Distribution - 15.06.17.pptPriyankaSharma89719
 
fca-bsps-decision-letter-redacted (1).pdf
fca-bsps-decision-letter-redacted (1).pdffca-bsps-decision-letter-redacted (1).pdf
fca-bsps-decision-letter-redacted (1).pdfHenry Tapper
 
SBP-Market-Operations and market managment
SBP-Market-Operations and market managmentSBP-Market-Operations and market managment
SBP-Market-Operations and market managmentfactical
 
原版1:1复刻温哥华岛大学毕业证Vancouver毕业证留信学历认证
原版1:1复刻温哥华岛大学毕业证Vancouver毕业证留信学历认证原版1:1复刻温哥华岛大学毕业证Vancouver毕业证留信学历认证
原版1:1复刻温哥华岛大学毕业证Vancouver毕业证留信学历认证rjrjkk
 

Último (20)

Governor Olli Rehn: Dialling back monetary restraint
Governor Olli Rehn: Dialling back monetary restraintGovernor Olli Rehn: Dialling back monetary restraint
Governor Olli Rehn: Dialling back monetary restraint
 
House of Commons ; CDC schemes overview document
House of Commons ; CDC schemes overview documentHouse of Commons ; CDC schemes overview document
House of Commons ; CDC schemes overview document
 
Unveiling Business Expansion Trends in 2024
Unveiling Business Expansion Trends in 2024Unveiling Business Expansion Trends in 2024
Unveiling Business Expansion Trends in 2024
 
project management information system lecture notes
project management information system lecture notesproject management information system lecture notes
project management information system lecture notes
 
NO1 Certified Amil Baba In Lahore Kala Jadu In Lahore Best Amil In Lahore Ami...
NO1 Certified Amil Baba In Lahore Kala Jadu In Lahore Best Amil In Lahore Ami...NO1 Certified Amil Baba In Lahore Kala Jadu In Lahore Best Amil In Lahore Ami...
NO1 Certified Amil Baba In Lahore Kala Jadu In Lahore Best Amil In Lahore Ami...
 
🔝+919953056974 🔝young Delhi Escort service Pusa Road
🔝+919953056974 🔝young Delhi Escort service Pusa Road🔝+919953056974 🔝young Delhi Escort service Pusa Road
🔝+919953056974 🔝young Delhi Escort service Pusa Road
 
magnetic-pensions-a-new-blueprint-for-the-dc-landscape.pdf
magnetic-pensions-a-new-blueprint-for-the-dc-landscape.pdfmagnetic-pensions-a-new-blueprint-for-the-dc-landscape.pdf
magnetic-pensions-a-new-blueprint-for-the-dc-landscape.pdf
 
Kempen ' UK DB Endgame Paper Apr 24 final3.pdf
Kempen ' UK DB Endgame Paper Apr 24 final3.pdfKempen ' UK DB Endgame Paper Apr 24 final3.pdf
Kempen ' UK DB Endgame Paper Apr 24 final3.pdf
 
Vp Girls near me Delhi Call Now or WhatsApp
Vp Girls near me Delhi Call Now or WhatsAppVp Girls near me Delhi Call Now or WhatsApp
Vp Girls near me Delhi Call Now or WhatsApp
 
Economic Risk Factor Update: April 2024 [SlideShare]
Economic Risk Factor Update: April 2024 [SlideShare]Economic Risk Factor Update: April 2024 [SlideShare]
Economic Risk Factor Update: April 2024 [SlideShare]
 
PMFBY , Pradhan Mantri Fasal bima yojna
PMFBY , Pradhan Mantri  Fasal bima yojnaPMFBY , Pradhan Mantri  Fasal bima yojna
PMFBY , Pradhan Mantri Fasal bima yojna
 
Role of Information and technology in banking and finance .pptx
Role of Information and technology in banking and finance .pptxRole of Information and technology in banking and finance .pptx
Role of Information and technology in banking and finance .pptx
 
Financial analysis on Risk and Return.ppt
Financial analysis on Risk and Return.pptFinancial analysis on Risk and Return.ppt
Financial analysis on Risk and Return.ppt
 
NO1 WorldWide Genuine vashikaran specialist Vashikaran baba near Lahore Vashi...
NO1 WorldWide Genuine vashikaran specialist Vashikaran baba near Lahore Vashi...NO1 WorldWide Genuine vashikaran specialist Vashikaran baba near Lahore Vashi...
NO1 WorldWide Genuine vashikaran specialist Vashikaran baba near Lahore Vashi...
 
Stock Market Brief Deck FOR 4/17 video.pdf
Stock Market Brief Deck FOR 4/17 video.pdfStock Market Brief Deck FOR 4/17 video.pdf
Stock Market Brief Deck FOR 4/17 video.pdf
 
The Inspirational Story of Julio Herrera Velutini - Global Finance Leader
The Inspirational Story of Julio Herrera Velutini - Global Finance LeaderThe Inspirational Story of Julio Herrera Velutini - Global Finance Leader
The Inspirational Story of Julio Herrera Velutini - Global Finance Leader
 
AnyConv.com__FSS Advance Retail & Distribution - 15.06.17.ppt
AnyConv.com__FSS Advance Retail & Distribution - 15.06.17.pptAnyConv.com__FSS Advance Retail & Distribution - 15.06.17.ppt
AnyConv.com__FSS Advance Retail & Distribution - 15.06.17.ppt
 
fca-bsps-decision-letter-redacted (1).pdf
fca-bsps-decision-letter-redacted (1).pdffca-bsps-decision-letter-redacted (1).pdf
fca-bsps-decision-letter-redacted (1).pdf
 
SBP-Market-Operations and market managment
SBP-Market-Operations and market managmentSBP-Market-Operations and market managment
SBP-Market-Operations and market managment
 
原版1:1复刻温哥华岛大学毕业证Vancouver毕业证留信学历认证
原版1:1复刻温哥华岛大学毕业证Vancouver毕业证留信学历认证原版1:1复刻温哥华岛大学毕业证Vancouver毕业证留信学历认证
原版1:1复刻温哥华岛大学毕业证Vancouver毕业证留信学历认证
 

Etude PwC Global Economy Watch (déc. 2014)

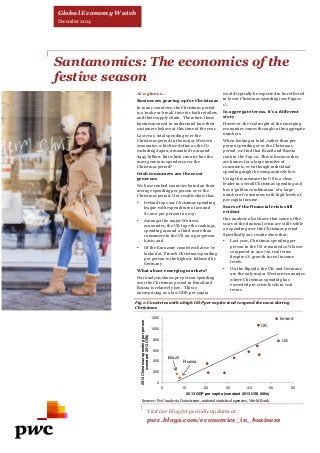
  • 1. Santanomics: The economics of the festive season At a glance… Businesses gearing up for Christmas In many countries, the Christmas period is a ‘make or break’ time for both retailers and their supply chain. Therefore, these businesses need to understand how their customers behave at this time of the year. Last year, total spending over the Christmas period in the majorWestern economies, which we define as the G7 excluding Japan, amounted to around $445 billion. But which country has the most generous spenders over the Christmas period? Irish consumers are themost generous We have ranked countries based on their average spending per person over the Christmas period. Our results show that: • Ireland tops our Christmas spending league with expenditure of around $1,200 per person in 2013; • Amongst the majorWestern economies, the UK tops the rankings, spending around a thirdmore than consumers in the US on a per person basis; and • Of the Eurozone countries that we’ve looked at, French Christmas spending per person is the highest, followed by Germany. What about emergingmarkets? Our analysis shows per person spending over the Christmas period in Brazil and Russia is relatively low. This is unsurprising as a low GDP per capita Fig 1: Countrieswith a high GDP per capita tend to spend themost during Christmas 1200 1000 800 600 400 200 0 would typically be expected to be reflected in lower Christmas spending (see Figure 1). In aggregate terms, it’s a different story However, the real might of the emerging economies comes through in the aggregate numbers. When looking at total, rather than per person spending over the Christmas period, we find that Brazil and Russia rank in the Top 10. This is because they are homes for a large number of consumers, even though individual spendingmight be comparatively low. Using this measure the US is a clear leader in overall Christmas spending as it has a ‘golden combination’ of a large number of consumers with high levels of per capita income. Scars of the financial crisis still evident Our analysis also shows that some of the scars of the financial crisis are still visible on spending over the Christmas period. Specifically our results show that: • Last year, Christmas spending per person in the US remained 10% lower compared to 2007 in real terms despite 1% growth in real income levels. • On the flipside, the UK and Germany are the only majorWestern economies where Christmas spending has exceeded pre-crisis levels in real terms. 0 10 20 30 40 50 60 2013 Christmas spending per person (constant 2013 US$) 2013 GDP per capita (constant 2013 US$ 000s) Sources: PwC analysis, Datastream, national statistical agencies, World Bank Visit our blog for periodic updates at: pwc.blogs.com/economics_in_business Global EconomyWatch December 2014 Ireland UK US Russia Brazil
  • 2. Economic update: China cuts interest rates Fig 2: Slowing economic growth and falling inflation is not just aWesternproblem Below target inflation spurred the Central Bank into action Recent data releases have shown that both GDP growth and inflation are slowing in China. In Q3 output growth moderated slightly to 7.3% year on year, while the October inflation rate dropped to 1.6%, which is significantly below the central bank’s target of 3.5% (see Figure 2). In an attempt to bring the inflation rate in line with the target, the People’s Bank of China (PBoC) took action in November. Sigh of relief for highly indebted private sector What happened? The PBoC cut the one-year benchmark loan interest rate by 0.4 percentage points to 5.6% and the deposit interest rate by 0.25 percentage points to 2.75%. These same percentage point changes were also applied across loans and deposits for other maturities. Impact of rate cut As mentioned in our previous analysis, ‘Growing pains: How fast is too fast for financialisation?’, China’s private sector loans to GDP ratio stands at around 180%, which is high relative to the rest of the E7 economies. Assuming the rate change is passed on by financial institutions to the private sector, this could affect business in two main ways: 1. Those that are highly indebted could refinance their debt and use the savings to either pay down debt or choose to bolster their balance sheet through higher profitability. Either way this could contribute to financial stability as it would keep non-performing loans in check. 2. Businesses which couldn’t access credit because of the higher rates could potentially do so now, with positive effects on economic activity (though the likely effect should not be overstated given the relatively small magnitude of the rate cut). 4 3 2 1 8.5 8.0 7.5 Sources: Datastream, National Bureau of Statistics of China Scars fromfinancial crisis still visible on Christmas spending Emergingmarkets are spendingmore during Christmas…. For most G7 economies real GDP is now above pre-crisis levels. However, does this trend also apply to spending over the Christmas period? To answer this, we estimated spending over the Christmas period using annual household consumption data from theWorld Bank and monthly retail sales data from national statistical agencies (see Assumptions and methodology box for more details). Doing so gave us a broad indication of cross-country differences in spending over the Christmas period as opposed to precise dollar estimations and therefore the results should be treated with some caution. Figure 3 shows that the evidence on the recovery of Christmas spending after the financial crisis is mixed. In the two largest emerging markets that celebrate Christmas, Brazil and Russia, consumers spent more in real terms last year 5 4 3 2 1 sensitive to fluctuations in income levels in the peripheral economies compared to the core economies. This suggests that consumers in the peripheral economies view Christmas spending as something of a luxury and are therefore more likely to cut-back on this type of discretionary spending at times of crisis. • At the other end of the spectrum Irish per person Christmas spending is the least responsive to changes in income compared to the other Eurozone economies in our sample. This could perhaps be explained by cultural differences whereby local traditions assign greater importance to Christmas compared to other events during the year. This trend is also consistent with Figure 1 which shows that real Irish per person Christmas spending is proportionally higher for its level of real GDP per capita. during the Christmas period than in 2007. This makes sense as their economies have grown at reasonably strong rates since the Global Financial Crisis (despite some recent slowdown). …but scars fromthe crisis are still visible in some advanced economies In contrast, the picture is less clear for advanced economies. Figure 3 shows that spending per person over the Christmas period has recovered to above pre-crisis levels in Germany and the UK, but not in the US. This is surprising, as US GDP per capita grew by 1% overall in real terms since 2007 compared to a decrease of 6% overall in the UK. This pattern could suggest that UK consumers are less willing to cut back on Christmas spending compared to those in the US. Focusing on the Eurozone, our analysis suggests a core-periphery divide with those in the periphery cutting back drastically on Christmas spending. In Greece, for example, real per person Christmas spending decreased by around 60% overall in the six years to 2013, which is the worst performance out of the 12 countries in our sample. Figure 3 also shows that Spanish and Portuguese real Christmas spending per person remains significantly below 2007 levels. This makes sense as the austerity measures implemented in the peripheral economies included significant nominal wage cuts, which have directly affected the purchasing power of consumers, and remain at lower levels compared to the pre-crisis era. Christmas a luxury good? Figure 4 shows the sensitivity of real spending per person over the Christmas period to the changes in real GDP per capita (also known as income elasticity of demand for ‘Christmas spending’). This analysis shows that: • Per person Christmas spending is more Fig 4: Christmas spending has been more responsive to income in the periphery since 2007 Sources: PwC analysis, Datastream, national statistical agencies, World Bank Fig 3: Christmas spending in the US has still not recovered since the financial crisis 60% 40% 20% 0% -20% -40% -60% Sources: PwC analysis, Datastream, national statistical agencies, World Bank 0 7.0 CPI inflation rate (%) Real GDP growth in China (Y-o-Y %) Real GDP growth CPI inflation rate 0 Income elasticity of demand of ‘Christmas spending’ (2007-13) -80% Russia Germany UK Brazil Ireland France Canada US Italy Portugal Spain Greece Overall percent change in per person Christmas spending (2007-13)
  • 3. Santanomics: Who spends the most during the festive season? Christmas spending is a ‘make or break’ event for retailers In most countries retail sales spike during the last twomonths of the calendar year. This is because households temporarily increase their discretionary spending for Christmas. Retailers know they have to get it right during the Christmas period, which is a ‘make or break’ event, as poor sales in the last twomonths of the year can have a disproportionate impact on their profitability. But the Christmas period is not just important for retailers as its effects can be felt throughout the entire supply chain. As a result, affected businesses need to have a good understanding of the seasonal spending habits of their customers. So how do countries rank in their Christmas spending patterns and what messages can businesses draw from this? Hey Big Spender! Our analysis (see Table 1 and our ‘Assumptions and methodology’ box below) shows that Ireland emerges as the leader in our league table of spenders over the Christmas period. Specifically, Irish consumers spent around $1,200 per person at Christmas in 2013.We also find that spending increases by around 16% on average during the months of November and December compared to the rest of the year. This emphasises the importance of the festive season for the revenue cycle of affected businesses. However, our analysis for 2013 also points to other important trends within the majorWestern economies, which we define as the G7 excluding Japan. Specifically: • UK households are the most generous spenders in the majorWestern economies during the Christmas period in per person terms (see Table 1), comfortably outstripping their US counterparts by around one third. • From a European perspective, German households spend around half that of their UK peers. • Italian households spend even less than Germany and this appears to have been accentuated by their stagnating economy. Emerging markets small in per person terms… But what about emerging markets? We have looked at the two biggest emerging markets that celebrate Christmas, Brazil and Russia. Table 1 shows that they rank at the bottom in terms of real per person spending over the Christmas period. This is not surprising as Figure 1 shows that there is a strong and positive correlation between GDP per capita and Christmas spending per person. However, this correlation also points out the untapped business potential of emerging markets as we expect that the gradual catch-up of income levels in emerging economies toWestern standards will lead to greater Christmas spending in the future. …but big in aggregate numbers On a more general point, we expect emerging market spending over the Christmas period to continue to grow in the future driven by the following trends: • Gradual convergence 0f income levels in emerging economies towards Western levels (although this will be a very slow process given the large difference in starting points); and • An increase in the number of consumers in some younger emerging markets. This is an important distinction to make and we have captured the latter point by ranking real Christmas spending on an aggregate basis in Table 2. Doing so, gives a more complete picture of Christmas spending. The key messages we draw out are that: • Brazilian Christmas spending is bigger in aggregate terms than that of Italy. This is despite scoring lower on the per person measure and reflects the large consumer base present in Brazil. • But the US remains by far the biggest Christmas spender in the world consuming over $240 billion per annum, which is more than that of the UK, Germany, France and Brazil combined. This is because the US has the ‘golden combination’ of a large and affluent consumer base. Table 1: Irish consumers are themost generouswhen it comes to Christmas spending Rank Christmas spending per person (constant 2013 US$) 2003 2007 2013 Country 2003 2007 2013 1 1 1 Ireland 1156 1244 1184 2 2 2 UK 1018 1033 1065 3 3 3 US 956 862 776 5 4 4 Canada 691 753 682 8 5 5 France 496 606 574 6 8 6 Germany 606 471 520 4 6 7 Italy 754 538 462 9 9 8 Portugal 390 469 357 7 7 9 Greece 498 506 188 10 10 10 Spain 330 258 184 11 11 11 Brazil 132 162 166 12 12 12 Russia 34 67 93 Sources: PwC analysis, Datastream, national statistical agencies, World Bank Table 2: But the US tops the list in aggregate terms 2013 total Christmas spending (constant 2013 US$ bn) Rank Country Spending Rank Country Spending 1 US 245 7 Canada 24 2 UK 68 8 Russia 13 3 Germany 42 9 Spain 9 4 France 38 10 Ireland 5 5 Brazil 33 11 Portugal 4 6 Italy 28 12 Greece 2 Sources: PwC analysis, Datastream, national statistical agencies, World Bank. Assumptions and methodology The following approach was used to obtain estimates of Christmas spending: • We obtained annual household consumption data from theWorld Bank and monthly retail sales data from national statistical agencies. • We used the retail sales data to convert annual household consumption data into a monthly series. To do this we assumed that household consumption follows the same trend as retail sales. • Using this new series we defined and estimated Christmas spending as the excess expenditure arising in November and December compared to the other months of the year. However other seasonal spending patterns may exist during a calendar year and so these numbers should be interpreted as giving a broad indication of cross-country differences in Christmas spending habits as opposed to precise dollar estimates. • We limited our analysis to the G7 excluding Japan, Brazil and Russia, and the peripheral Eurozone economies which we monitor. We excluded China, Japan and India as Christmas is not a traditional holiday in these countries. • All of our numbers are in constant 2013 US dollar terms.
  • 4. Projections: December 2014 Real Share of 2013 world GDP GDP growth Inflat ion PPP* MER* 2013 2014p 2015p 2016-2020p 2013 2014p 2015p 2016-2020p Global (Market Exchange Rates) 100% 2.7 2.8 3.1 3.2 2.4 2.6 2.7 2.6 Global (PPP rates) 100% 3.3 3.3 3.6 3.9 United States 16.4% 22.4% 2.2 2.3 3.2 2.4 1 .5 1 .7 1 .9 1 .9 China 1 5.8% 1 2.7% 7 .7 7 .4 7 .2 7 .0 2.6 2.2 2.3 3.4 Japan 4.6% 6.6% 1 .5 0.5 0.2 1 .2 0.4 2.7 2.0 1 .5 United Kingdom 2.3% 3.4% 1 .7 3.0 2.5 2.3 2.6 1 .6 1 .6 2.0 Eurozone 1 2.3% 1 7 .1% -0.5 0.8 1 .2 1 .5 1 .4 0.5 1 .0 1 .5 France 2.5% 3.8% 0.1 0.5 1 .0 1 .7 1 .0 0.7 1 .0 1 .5 Germany 3.4% 4.9% 0.2 1 .2 1 .2 1 .3 1 .6 0.9 1 .5 1 .7 Greece 0.3% 0.3% -3.9 0.2 1 .8 3.0 -0.9 -1 .2 -0.3 1 .3 Ireland 0.2% 0.3% 0.2 4.2 3.2 2.5 0.5 0.5 1 .0 1 .5 Italy 2.0% 2.8% -1 .8 -0.3 0.6 1 .0 1 .3 0.3 0.5 1 .4 Netherlands 0.8% 1 .1% -0.7 0.8 1 .5 2.0 2.6 0.9 1 .2 1 .4 Portugal 0.3% 0.3% -1 .0 0.9 1 .3 1 .8 0.4 -0.1 0.5 1 .5 Spain 1 .5% 1 .8% -1 .2 1 .3 1 .8 1 .5 1 .5 -0.0 0.5 1 .0 Poland 0.9% 0.7% 1 .6 3.3 3.2 3.5 1 .2 0.2 1 .0 2.5 Russia 3.4% 2.8% 1 .3 0.1 -1 .0 2.0 6.8 7 .8 6.8 5.0 Turkey 1 .4% 1 .1% 4.1 2.8 3.4 4.5 7 .5 8.9 7 .1 4.8 Australia 1 .0% 2.0% 2.3 2.8 2.6 3.1 2.2 2.6 2.5 2.7 India 6.6% 2.5% 4.7 5.4 6.5 6.5 6.3 4.4 4.9 6.0 Indonesia 2.3% 1 .2% 5.8 5.2 5.8 6.3 6.4 6.2 5.9 5.1 South Korea 1 .7% 1 .7% 3.0 3.4 3.6 3.8 1 .3 1 .4 1 .4 2.9 Argentina 0.9% 0.8% 2.9 -0.4 -0.1 3.3 - 25.0 25.0 - Brazil 3.0% 3.0% 2.3 0.5 1 .0 4.0 6.2 6.3 5.5 4.8 Canada 1 .5% 2.4% 2.0 2.4 2.5 2.2 1 .0 2.0 1 .8 2.1 Mexico 2.0% 1 .7% 1 .7 2.3 3.7 3.6 3.8 3.9 3.7 3.6 South Africa 0.7% 0.5% 1 .9 1 .4 2.3 3.8 5.8 6.2 5.6 4.8 Nigeria 1 .0% 0.7% 5.5 6.2 6.2 5.7 8.5 8.4 8.7 7 .3 Saudi Arabia 1 .5% 1 .0% 4.0 4.3 4.2 4.3 3.5 2.8 3.2 4.0 Sources: PwC analysis, National statistical authorities, Thomson Datastream and IMF. All inflation indicators relate to the Consumer Price Index (CPI), with the exception of the Indian indicator which refers to the Wholesale Price Index (WPI). Argentina's inflation projections use the IPCNu Index released by INDEC which is based in the fourth quarter of 2013 (therefore we do not provide a 2013 estimate). We will provide a 2016-2020 inflation projection once a longer time series of data is available. GDP projections for Argentina use the 2004 base year national account data (previously base year 1993). Our Nigeria GDP projections relate to the new rebased GDP figures but are subject to high margins of error. Also note that the tables above form our main scenario projections and are therefore subject to considerable uncertainties. We recommend that our clients look at a range of alternative scenarios. Interest rate outlook of major economies Current rate (Last change) Expectation Next meeting Federal Reserve 0-0.25% (December 2008) Rate to start to rise during the second half of 2015 16-17 December European Central Bank 0.05% (September 2014) Rates on hold following decrease in September 22 January Bank of England 0.5% (March 2009) Rate to start rising gradually during 2015 8 January Richard Boxshall T: +44 (0) 20 7213 2079 E: richard.boxshall@uk.pwc.com Barret Kupelian T: + 44 (0) 20 7213 1579 E: barret.g.kupelian@uk.pwc.com Conor Lambe T: +44 (0) 20 7212 8783 E: conor.r.lambe@uk.pwc.com PwC’s Global Consumer Index Global consumer spending growth has continued its downward trend for the fifth consecutive month, remaining below the long-term average. Although industrial production figures have improved, global stock markets are still experiencing jitters and money supply growth has slowed, underlining weakening growth in China, Japan and Europe, which could dampen consumer spending growth in the short-term. 4.0% 3.5% 3.0% 2.5% 2.0% 1.5% 1.0% 0.5% 0.0% Long-term growth 2.2% Dec-13 Jan-14 Feb-14 Mar-14 Apr-14 May-14 Jun-14 Jul-14 Aug-14 Sep-14 Oct-14 Nov-14 YoY growth The GCI is a monthly updated index providing an early steer on consumer spending and growth prospects in the world’s 20 largest economies. For more information, please visit www.pwc.co.uk/globalconsumerindex We help you understand how big economic, demographic, social, and environmental changes affect your organisation by setting out scenarios that identify growth opportunities and risks on a global, regional, national and local level.We help make strategic and tactical operational, pricing and investment decisions to support business value creation.We work together with you to achieve sustainable growth. This publication has been prepared for general guidance on matters of interest only, and does not constitute professional advice. You should not act upon the information contained in this publication without obtaining specific professional advice. No representation or warranty (express or implied) is given as to the accuracy or completeness of the information contained in this publication, and, to the extent permitted by law, PricewaterhouseCoopers LLP, its members, employees and agents do not accept or assume any liability, responsibility or duty of care for any consequences of you or anyone else acting, or refraining to act, in reliance on the information contained in this publication or for any decision based on it. © 2014 PricewaterhouseCoopers LLP. All rights reserved. In this document, “PwC” refers to the UK member firm, and may sometimes refer to the PwC network. Each member firm is a separate legal entity. Please see www.pwc.com/structure for further details.