SlideShare una empresa de Scribd logo
1 de 6
Descargar para leer sin conexión
QE Intra-Day Movement                                                                                 Market Indicators                          9 Aug 12              8 Aug 12                %Chg.

 8,420                                                                                                  Value Traded (QR mn)                          243.0                 175.9                  38.1
                                                                                                        Exch. Market Cap. (QR mn)                 460,654.9             461,141.6                  (0.1)
 8,410                                                                                                  Volume (mn)                                     5.9                   3.9                  52.5
                                                                                                        Number of Transactions                        3,737                 2,634                  41.9
 8,400
                                                                                                        Companies Traded                                 41                    39                    5.1
 8,390                                                                                                  Market Breadth                                20:16                 17:15                      –

 8,380                                                                                                  Market Indices                 Close         1D%         WTD%            YTD%           TTM P/E
                                                                                                        Total Return                11,390.51           0.2             1.0         2.1             N/A
 8,370                                                                                                  All Share Index              2,024.92           0.2             0.9         5.1             9.5
      9:30        10:00      10:30      11:00      11:30      12:00       12:30    13:00
                                                                                                        Banks                        2,040.96           0.7             0.7         3.3            11.3
  Qatar Commentary                                                                                      Industrials                  2,474.19           0.1             1.0         8.5            11.3
  The QE index rose 0.2% to close at 8,416.5. Gains were led by the Banks &                             Transportation               1,327.98         (0.1)             0.3      (10.0)            10.5
  Financial Services and Real Estate indices, both gained 0.7%. Top gainers                             Real Estate                  1,615.53           0.7           (0.7)       (3.7)             2.8
  were Qatar Cinema & Film Dist. Co. and Islamic Holding Group, rising 9.9% and                         Insurance                    1,974.08         (0.1)             2.8        12.6            12.2
  3.4% respectively. Among the top losers, Medicare Group fell 7.0%, while Qatar                        Telecoms                     1,120.48         (2.3)             3.5        17.7            15.7
  Telecom declined 2.9%.                                                                                Consumer                     4,402.81         (0.1)             0.0        30.0            12.1

  GCC Commentary                                                                                        GCC Top Gainers##              Exchange            Close#       1D%       Vol. ‘000       YTD%
  Saudi Arabia: The TASI index increased 0.5% to close at 6,987.1. Gains were                           Nat. Bank Of Bahrain           Bahrain                 0.55       9.0             25.0     (5.2)
  led by the Hotel & Tourism and Insurance indices, rising 5.1% and 2.7%
  respectively. Both Al Alamiya for Coop. Insurance Co. and Alinma Tokio                                Com. Bank of Kuwait            Kuwait              770.00         5.5              5.0     (2.5)
  Marine Co. rose 9.8%.                                                                                 Deyaar Development             Dubai                   0.37       5.2      26,010.5        71.4
  Dubai: The DFM index gained 1.1% to close at 1,572.4. Gains were led by the
  Telecommunication and Real Estate & Construction indices, increasing 4.6%                             Emirates Int. Tel. Co.         Dubai                   3.40       4.6       2,489.7        17.6
  and 1.7% respectively. Takaful Al Emarat Insurance Co. rose 7.1%, while                               First Gulf Bank                Abu Dhabi              9.75        3.7       2,929.8        26.1
  Deyaar Development increased 5.2%.
                                                                                                                             ##                                   #
  Abu Dhabi: The ADX benchmark index rose 0.8% to close at 2,534.7. Gains                               GCC Top Losers                 Exchange            Close          1D% Vol. ‘000           YTD%
  were led by the Investment & Financial Services and Banking indices, gaining
                                                                                                        Ikarus Petro. Ind.             Kuwait              160.00       (5.9)             0.1      (5.9)
  1.9% and 1.6% respectively. First Gulf Bank increased 3.7%, while Green
  Crescent Insurance Co. rose 3.6%.                                                                     Kuwait Foods Amer.             Kuwait            1,300.00       (3.0)         24.0        (12.2)
  Kuwait: The KSE index declined 0.2% to close at 5,699.4. Losses were led by
                                                                                                        Qatar Telecom                  Qatar               108.90       (2.9)        117.0         15.5
  the Oil & Gas and Insurance indices, falling 1.4% and 0.5% respectively. First
  Takaful Ins. Co. fell 8.1%, while Flex Resorts & Real Estate Co. declined 7.3%.                       Al Ahli Bank                   Qatar                  56.30     (2.9)             0.4       7.2
  Oman: The MSM index increased 0.5% to close at 5,463.4. The Banking &
                                                                                                        Al-Qurain Petro. Co.           Kuwait              172.00       (2.3)        449.9        (19.6)
  Investment index gained 1.5%, while the Industrial index rose 0.4%. Gulf
  International Chemicals gained 7.9%, while Financial Services Co. rose 7.7%.                        Source: Bloomberg (# in Local Currency) (## GCC Top gainers/losers derived from the Bloomberg GCC
                                                                                                      200 Index comprising of the top 200 regional equities based on market capitalization and liquidity)

  Qatar Exchange Top Gainers                     Close*       1D%         Vol. ‘000     YTD%            Qatar Exchange Top Losers                     Close*          1D%        Vol. ‘000       YTD%
  Qatar Cinema & Film Dist. Co.                   63.20         9.9             0.1     (15.0)          Medicare Group                                  41.00         (7.0)         596.0          67.7
  Islamic Holding Group                           27.20         3.4             2.4         7.3         Qatar Telecom                                 108.90          (2.9)         117.0          15.5
  Gulf International Services                     26.90         2.7          463.0        24.1          Al Ahli Bank                                    56.30         (2.9)           0.4           7.2
  Qatari Investors Group                          25.95         2.6          971.4        69.3          Qatar & Oman Investment Co.                     11.57         (1.9)         191.5          15.7
  Qatar Electricity & Water Co.                  136.50         1.6           14.7        (2.2)         Ezdan Real Estate Co.                           19.75         (1.3)           0.8         (11.0)

  Qatar Exchange Top Vol. Trades                 Close*       1D%         Vol. ‘000     YTD%            Qatar Exchange Top Val. Trades                Close*          1D%        Val. ‘000       YTD%
  Qatari Investors Group                          25.95         2.6          971.4        69.3          QNB Group                                     134.90           1.4       42,664.9          (2.4)
  Medicare Group                                  41.00       (7.0)          596.0        67.7          Industries Qatar                              136.50          (0.7)      25,249.0           2.6
  Vodafone Qatar                                    9.04        0.9          520.7        19.7          Qatari Investors Group                          25.95          2.6       24,993.9          69.3
  Qatar Gas Transport Co.                         15.67       (0.4)          465.5      (10.5)          Medicare Group                                  41.00         (7.0)      24,517.8          67.7
  Gulf International Services                     26.90         2.7          463.0        24.1          Qatar Telecom                                 108.90          (2.9)      12,792.7          15.5
                                                                                                      Source: Bloomberg (* in QR)

                                                                                                       Exch. Val. Traded                 Exchange Mkt.                                       Dividend
 Regional Indices               Close            1D%          WTD%           MTD%         YTD%                                                                     P/E**         P/B**
                                                                                                                   ($ mn)                   Cap. ($ mn)                                          Yield
  Qatar*                     8,416.46               0.2             1.0          1.4        (4.1)                   66.73                    126,495.8                 8.9         1.6             4.4
  Dubai                      1,572.37               1.1             1.4          1.9        16.2                    35.50                     49,315.4                14.9         0.7             3.9
  Abu Dhabi                  2,534.72               0.8             1.1          1.1          5.5                   37.60                     76,111.5                 9.2         1.0             4.8
  Saudi Arabia               6,987.06               0.5             0.5          1.6          8.9               1,583.29                     369,971.6                14.4         1.9             3.5
  Kuwait                     5,699.36             (0.2)           (0.4)        (0.4)        (2.0)                   32.14                     98,733.5                26.5         1.1             3.5
  Oman                       5,463.43               0.5           (0.0)          2.0        (4.1)                   17.06                     18,975.9                10.7         1.6             4.6
  Bahrain                    1,079.69               0.5           (1.7)        (1.8)        (5.6)                     0.42                    19,643.3                 9.8         0.8             4.6
Source: Bloomberg, Qatar Exchange, Tadawul, Muscat Securities Exchange, Dubai Financial Market and Zawya (** TTM; * Value traded ($ mn) do not include special trades, if any)
                                                                                                                                                                                           Page 1 of 6
Qatar Market Commentary
 The QE index rose 0.2% to close at 8,416.5. The Banks &
                                                                                                               Overall Activity                     Buy %*             Sell %*                        Net (QR)
  Financial Services and Real Estate indices were the major
  contributors to the gains. The index increased on the back of                                                Qatari                                66.91%            64.50%                      5,851,794.99
  buying support from Qatari shareholders despite selling pressure                                             Non-Qatari                            33.08%            35.50%                    (5,851,794.99)
  from non-Qatari shareholders.
                                                                                                             Source: Qatar Exchange (* as a % of traded value)
 Qatar Cinema & Film Dist. Co. and Islamic Holding Group were
  the top gainers, increasing 9.9% and 3.4% respectively. Among
  the top losers, Medicare Group fell 7.0%, while Qatar Telecom
  declined 2.9%.
 Volume of shares traded on Thursday increased by 52.5% to
  5.9mn from 3.9mn on Wednesday. Further, as compared to the
  30-day moving average of 5.0mn, volume for the day was 18.2%
  higher. Qatari Investors Group and Medicare Group were the
  most active stocks, contributing 16.4% and 10.1% to the total
  volume respectively.
  Earnings
Ratings Updates
  Company                  Agency          Market         Type*                                       Old Rating            New Rating           Rating Change            Outlook           Outlook Change
                                                          LT IDR#/ ST IDR/ VR/ SR/ SR
  Qatar National                                          Floor/ QNB Finance Limited                 A+/ F1/ a/ 1/          A+/ F1/ a/ 1/
                             Fitch          Qatar                                                                                                          –                Stable                    –
  Bank (QNB)                                              Senior Unsecured Notes                       A+/ A+                 A+/ A+
                                                          (guaranteed by QNB)
  Bank Dhofar                                             LT FC IDR#/ ST FC IDR/ VR##/                BBB+/ F2/             BBB+/ F2/
  (BD)
                             Fitch         Oman
                                                          SR/ SR Floor                               bb+/ 2/ BBB+          bb/ 2/ BBB+                                     Stable                    –
                                                          LT FC IDR#/ STFC IDR/ LT LC                 BBB+/ F2/             BBB+/ F2/
  Ahli Bank                  Fitch         Oman           IDR#/ ST LC IDR/ VR/ SR/ SR                 BBB+/ F2/             BBB+/ F2/                      –                Stable                    –
                                                          Floor                                      bb+/ 2/ BBB+          bb+/ 2/ BBB+
                                                                                                                                                                                        #                   ##
Source: News reports (* „ST‟ – Short Term, „LT‟ – Long Term, „VR‟ - Viability Rating, „SR‟ – Support Rating, „IDR‟ - Issuer Default Rating, „FC‟- Foreign Currency, LC - Local Currency ; Outlook Stable,
Downgraded )

Earnings Releases
                                                                                     Revenue             % Change           Operating Profit           % Change           Net Profit (mn)            % Change
  Company                                        Market            Currency
                                                                                    (mn) 2Q12                 YoY                (mn) 2Q12                  YoY                     2Q12                  YoY
   SHUAA Capital (SHUAA)                      Dubai               AED                       22.2            (37.8%)                             –                  –                   (15.9)                    NA
  Al Buhaira National Insurance
                                              Abu Dhabi           AED                       78.2            (20.1%)                             –                  –                     17.1             -43.8%
  Co. (ABNIC)
  Union Insurance Co. (UNION)                 Abu Dhabi           AED                       35.2              53.3%                             –                  –                   (24.3)                    NA
  Alain Ahlia Insurance Co.
                                              Abu Dhabi           AED                       44.8              (2.0%)                            –                  –                     15.4             -36.2%
  (ALAIN)
  United Insurance Co. (UIC)                  Abu Dhabi           AED                       20.9              49.4%                             –                  –                    (0.7)                    NA
  Abu Dhabi National Takaful Co.
                                              Abu Dhabi           AED                       19.8              (1.6%)                            –                  –                        6.2              2.2%
  (TAKAFUL)
  Fujairah Cement Industries Co.
                                              Abu Dhabi           AED                      151.1                8.0%                            –                  –                     15.1                    NA
  (FCI)
  Al Dar Properties Co. (ALDAR)               Abu Dhabi           AED                   4,631.0              497.0%                             –                  –                   417.9              228.0%
  United Real Estate Co. (URC) #              Kuwait              KD                                                                            –                  –                     16.4             223.0%
  Salalah Port Services Co. -
                                              Oman                OMR                       27.9                9.4%                            –                  –                        3.2           274.6%
  (SPSI)
  Bahrain Tourism Co. (BTC)                   Bahrain             BHD                         1.3             63.6%                             –                  –                        0.2                  NM
  Securities and Investment Co.
                                              Bahrain             BHD                           –                    –                          –                  –                        -0.3                 NA
  (SICO) #
                                                      #
Source: Company data, DFM, ADX, Bahrain bourse ( Data for 1H2012)

Global Economic Data
  Date       Market           Source                              Indicator                                              Period                             Actual           Consensus                 Previous

  08/09      US               The Labor Department                Initial Jobless Claims                                 4-August                              361K                   370K                  367K
  08/09      US               The Labor Department                Continuing Claims                                      28-July                           3,332K                  3,275K                 3,279K
  08/09      US               Bloomberg                           Bloomberg Consumer Comfort                             5- August                             -41.9                         –               -39.7
  08/09      US               The Commerce Dept.                  Wholesale Inventories                                  June                              -0.20%                    0.30%                  0.00%
  08/10      US               The Labor Department                Import Price Index (MoM)                               July                              -0.60%                    0.20%                -2.40%
  08/10      US               The Labor Department                Import Price Index (YoY)                               July                              -3.20%                  -2.50%                 -2.50%
  08/10      Germany          Destasis                            Consumer Price Index (MoM)                             July                                  0.40%                 0.40%                -0.10%

                                                                                                                                                                                                    Page 2 of 6
08/10      Germany          Destasis                           Consumer Price Index (YoY)                        Jul y                   1.70%           1.70%         1.70%
  08/10      France           Insee                              Industrial Production (MoM)                       June                    0.00%           0.10%        -2.10%
  08/10      France           Insee                              Industrial Production (YoY)                       June                   -2.30%          -1.80%        -3.70%
  08/10      France           Insee                              Manufacturing Production (MoM)                    June                    0.10%           0.00%        -1.10%
  08/10      France           Insee                              Manufacturing Production (YoY)                    June                   -2.60%          -2.10%        -4.60%
  08/10      Italy            Istat                              CPI - EU Harmonized (MoM)                         July                   -1.70%          -1.60%         0.20%
  08/10      Italy            Istat                              CPI - EU Harmonized (YoY)                         July                    3.60%           3.70%         3.60%
  08/09      China            National Bureau of Stat.           Consumer Price Index (YoY)                        July                    1.80%           1.70%         2.20%
  08/09      China            National Bureau of Stat.           Producer Price Index (YoY)                        July                   -2.90%          -2.50%        -2.10%
  08/09      China            National Bureau of Stat.           Industrial Production (YoY)                       July                    9.20%           9.70%         9.50%
                              Ministry of Economy,
  08/10      Japan                                               Industrial Production (MoM)                       June                    0.40%               –        -3.40%
                              Trade and Industry
                              Ministry of Economy,
  08/10      Japan                                               Industrial Production (YoY)                       June                   -1.50%               –         6.00%
                              Trade and Industry
Source: Bloomberg (s.a. = seasonally adjusted; n.s.a. = non-seasonally adjusted; w.d.a. = working day adjusted)


  News
Qatar                                                                                                         endorsed as the fiber optic broadband infrastructure provider for
                                                                                                              Qatar. (AME Info)
 Dlala Brokerage and Investment Holding Company net
                                                                                                           Salwa Road project on track to meet deadline – According to
  profit declines – Dlala Brokerage and Investment Holding
                                                                                                            a report from an Arabic daily, most of the road networks of
  Company reported a net profit of QR15mn in 2Q2012, indicating
                                                                                                            Salwa road projects have reached at least 70% completion and
  a QoQ decline of 2.1%. Net brokerage and commission income
                                                                                                            will meet the project deadline in the middle of 2013. (Peninsula
  declined 8.4% QoQ to QR7.8mn. Total assets at the end of June
                                                                                                            Qatar)
  30 stood at QR575mn, reflecting an YTD decrease of 20.2%.
  (QE)
                                                                                                         International
 Mannai Corporation net profit up – Mannai Corporation
  reported a net profit of QR93.3mn in 2Q2012, reflecting QoQ                                              IEA sees oil demand growth slowdown on weaker economy
                                                                                                            – The International Energy Agency cut global oil demand
  increase of 23.9%. Revenue increased by 129.9% QoQ to
  QR1,416.6mn. Total assets at the end of June 30 stood at                                                  forecasts for this year and next, estimating that growth will slow
  QR6,487.8mn, indicating YTD increased of 124.1%. Inventories                                              in 2013 amid weaker expectations for the economy and the
  rose by 197.3% YTD to QR2,224.5mn. (QE)                                                                   restart of nuclear plants in Japan. IEA estimates that growth in
                                                                                                            world oil use will decelerate to 800,000 barrels a day, or 0.9%, in
 Qatar National Cement Company to float a global general                                                   2013 from 900,000 a day, or 1%, this year. IEA mentioned that
  tender for construction of new cement plant at Umm Bab –                                                  global demand will average 90.5mn bpd next year, which is
  Qatar National Cement Company has decided to float a global                                               400,000 bpd less than estimated last month, as a result of
  general tender for the construction of New Cement Plant at                                                revisions to data since 2010. (Bloomberg)
  Umm Bab for a capacity of 5,000 TPD Clinker as the first option
                                                                                                           OPEC keeps its forecast unchanged for growth in world oil
  and 7,000 TPD clinker as a second option. Furthermore, the
                                                                                                            demand – Organization of the Petroleum Exporting Countries
  company also said the general tender for the consultancy of the
                                                                                                            left its forecast for growth in world oil demand unchanged from
  project is on the stage of receiving quotations. (QE)
                                                                                                            its estimate last month. OPEC expects demand to expand by
 Mawashi sells 30,000 animals at subsidized prices –                                                       810,000 barrels per day (bpd) next year. OPEC expects world
  Mawashi has sold 30,000 animals at subsidized prices, in                                                  economic growth to slow to 3.2% next year from 3.3% in 2012,
  collaboration with Qatar Development Bank. In an attempt to                                               hindered by a slightly slower expansion in US and China, and
  cater to further demand and in collaboration with the Ministry of                                         weakness in the Euro zone. Furthermore, OPEC trimmed the
  Business and Trade, Mawashi has further increased its supply                                              demand forecast for its own oil this year and in 2013 by 80,000
  of livestock offered at a subsidized price to cover the rest of the                                       bpd and 100,000 bpd, respectively, due to higher supply from
  holy month of Ramadan. Mawashi has also increased its points                                              producers outside OPEC countries. (Reuters)
  of sale to include 15 branches in Qatar with slaughterhouses in
                                                                                                           OECD Chief backs ECB bond-buying policy – The Head of
  Doha, Al Rayyan, Meaizer, Al Khor and Shamal. (Gulf-                                                      the OECD Angel Gurria said he supports the European Central
  Times.com)                                                                                                Bank‟s (ECB) plan to buy sovereign bonds of Euro zone nations.
 QSTec and Gasal sign long term supply agreement for                                                       Gurria stated that countries like Spain or Greece must
  hydrogen and nitrogen – Qatar Solar Technologies (QSTec)                                                  implement strict reforms to become more competitive and make
  and Gasal have signed a hydrogen and nitrogen long term                                                   savings. He also said he wanted Greece to stay in the euro zone
  supply agreement. Under the agreement, GASAL will invest into                                             but called on Athens to respect conditions imposed by the EU
  multiple high purity Hydrogen production units and extend and                                             and the International Monetary Fund in return for bailout
  connect QSTec to its industrial gas pipeline system in Ras                                                packages which are keeping its economy afloat. (Gulf-
  Laffan Industrial City (RLIC) for Nitrogen. The new units will be                                         Times.com)
  designed and built by Air Liquide Engineering and will be                                                FSA: Libor reform risks invalidating mortgages, financial
  commissioned and operated by GASAL through an extension of                                                contracts – UK‟s Financial Services Authority Managing
  its pipeline system in RLIC during 2013. (AME Info)                                                       Director Martin Wheatley said that material changes to the way
 Q.NBN bags a 25-year license to operate fiber optic                                                       Libor is calculated risks invalidating millions of financial
  broadband network in Qatar – Qatar National Broadband                                                     contracts, covering products ranging from mortgages to
  Network (Q.NBN) has received a 25-year license to provide fiber                                           derivatives. He said there needs to be certainty on what would
  optic broadband throughout Qatar. Q.NBN has been officially                                               happen to banks and investors if another benchmark is adopted.
                                                                                                                                                                    Page 3 of 6
He also mentioned that any migration to new benchmarks would         Saudi non-oil exports reaches SR14.48bn in June –
  require a carefully planned and managed transition in order to        According to a report by the Central Department of Statistics
  limit disruption to the huge volume of outstanding contracts that     and Information, value of Saudi non-oil exports stood at
  reference Libor. (Bloomberg)                                          SR14.48bn for June in 2012, indicating a YoY decline of 7.7%.
 Fitch uncertain if Spain MOU will be final reform for sector –        Exports of petrochemical products accounted for 36.7% of total
  Fitch Ratings said it remains "cautious" on whether Spanish           non-oil exports, while plastic products accounted for 29.7% and
  banks will require a further bailout beyond the $123bn already        foodstuffs 7.7%. China topped the list of countries receiving
  pledged, given the weak economy and high costs of borrowing           Saudi non-oil exports, accounting for 12.92% of total exports,
  that the country faces. The ratings firm said the Memorandum of       followed by Singapore and the UAE, 10.15% and 9.28%
  Understanding on bank recapitalization for Spanish banks is           respectively. (GulfBase.com)
  meant to be the final reform required by the sector. (WSJ)           Sino-Saudi Gas to delay Empty Quarter drilling – Sino-Saudi
 Greece to sell €3.125bn 3-month treasury bills – Greece will          Gas, a JV between China-based Sinopec and Saudi Aramco,
  try to raise €3.125bn in an auction of three-month treasury bills     will reportedly delay drilling in the Kingdom‟s Empty Quarter as
  next week to try to avoid a looming cash crunch. A finance            the evaluation of the well is still ongoing. In this regard a
  ministry official said the country faces redeeming a €3.2bn bond      Sinopec executive said no decision has been made on the
  held by the European Central Bank on August 20. (Peninsula            exploration well yet as the company was still evaluating "the
  Qatar)                                                                economic and technical aspects" of the well. (GulfBase.com)
                                                                       SABIC to distribute SR2 per share dividends for 1H2012 –
Regional                                                                Saudi Basic Industries Corporation (SABIC) approved to
                                                                        distribute a dividend of SR2 per share for 1H2012. (Tadawul)
 Bank of Ceylon raises $190m in Mashreqbank-Led
  Syndicated Loan – Bank of Ceylon (BoC) signed an agreement           NCB pioneers Shari’ah-compliant airport financing –
  for a syndicated loan facility of $190mn. Mashreqbank acted as        National Commercial Bank (NCB) said it is the Islamic
  the Co-ordinator, Mandated Lead Arranger (MLA) and                    structuring bank of Tibah Consortium for Madinah International
  Bookrunner along with Commercial Bank of Qatar, Doha Bank             Airport, and providing the bulk of financing. (GulfBase.com)
  and Indian Bank, Singapore Branch (each as MLA and                   Business confidence in UAE tops globally – According to
  Bookrunner) and Bank Muscat (as MLA). A total of 13 banks             Global Economic Conditions Survey (GECS), UAE leads the
  participated in the oversubscribed syndicated deal. This was          world in business confidence and stands alone in positive
  originally planned for $100mn but upsized due to heavy                territory in the global economic survey index, leaving behind US,
  demand. (Bloomberg)                                                   UK, Hong Kong, Singapore and others on negative side of the
 IMF: Saudi net foreign assets to rise sharply – International         index. The GECS Confidence Index across the region and in
  Monetary Fund (IMF) said net foreign assets of the Saudi central      selected markets revealed that the UAE has score of 7.9, while
  bank are set to rise sharply by the end of 2012, boosted by the       rest of the regions and markets covered under the index
  Kingdom‟s buoyant oil revenues. IMF said that higher oil              recorded negative scoring. (GulfBase.com)
  revenues have strengthened fiscal and external balances and          Dana Gas and Crescent Petroleum invests $963mn in
  have boosted social spending and savings for future                   Kurdish region – Dana Gas and its biggest shareholder and
  generations. The IMF projected that the Saudi central bank‟s net      partner, Crescent Petroleum, invested $963mn in the Kurdish
  foreign assets will rise to $701.8bn by the end of 2012, up 19%       region of Iraq by the end of June. Moreover, Dana Gas and
  from the last-reported figure of $591bn reported by the Saudi         Crescent Petroleum said they are in discussions with the
  Arabian Monetary Agency (SAMA) at the end of June this year.          Kurdish government for the next phase of development and
  (Gulf-Times.Com)                                                      expansion. (GulfBase.com)
 Saudi telecom firms most competitive in Arab world –                 ADIB starts community banking – Abu Dhabi Islamic Bank
  According to Arab Advisors Group‟s Cellular Competition               has launched ADIB Community Banking to address the banking
  Intensity Index 2012, Saudi Arabia with a score of 74.56%, has        requirements of non-profit organisations as well as government
  the most competitive telecommunications sector in the Arab            and private companies focused on serving the UAE community.
  world. In the Gulf, Oman was the second most competitive at           (GulfBase.com)
  67.01%, followed by Bahrain (61.01%) and Kuwait (52.58%).
  The index showed that UAE (49.01%) and Qatar (47.14%) were           Kuwait Finance House reports net profit of KD42.1mn –
  the Gulf‟s least competitive markets, while Libya was the worst       Kuwait Finance House reported a net profit of KD42.1mn for
  ranked country in the Arab world (32.68%). However it also            1H2012. Earnings per share stood at 14.8 fils. Total revenues
  showed that the UAE was one of only four markets whose score          increased by 3.7% YoY to KD394.4mn. Total assets increased
  improved compared to the previous ranking in April.                   to KD14bn, while deposits increased to KD8.9bn. (AME Info)
  (GulfBase.com)                                                       Number of fixed line users rises marginally in Oman –
 Saudi cuts oil output to 9.8mn bpd in July – Saudi Arabia             According to Statistics issued by National Center for Statistics
  pumped 9.8mn barrels per day (bpd) of crude oil in July, cutting      and Data (NCSD), subscribers of the fixed phone service in
  output by 300,000 bpd from June. Saudi Arabia supplied 9.7mn          Oman stood at 295,946 at the end of June 2012, reflecting YTD
  bpd to the market in July, while 100,000 bpd of the output was        increase of 3%.The subscribers of the billed fixed phone service
  stored. (GulfBase.com)                                                stood at 219,903 at the end of June 2012 against 215,193
                                                                        subscribers at the end of 2011. Subscribers of pre-paid fixed
 Saudi Arabia’s foreign assets surge by SR205b in 1H2012 –             phone service (Sahl) stood at 25,932 against 26,345 in 2011.
  According to Saudi Arabia Monetary Agency (SAMA), Saudi               (GulfBase.com)
  Arabia‟s foreign assets increased by SR205bn to SR2,263bn in
  1H2012. The increase was mostly in deposits with banks               Bahrain Islamic Bank reports net loss – Bahrain Islamic Bank
  abroad, which soared to SR522bn from SR414bn. Investment in           reported a net loss of BHD16.4mn in 2Q2012 as compared to
  foreign securities swelled to nearly SR1,523bn from SR1,427bn         net profit of BHD1.7mn in 2Q2011. Loss per share stood at
  in the same period. (GulfBase.com)                                    17.56 fils as compared to earnings per share of 1.8fils in

                                                                                                                              Page 4 of 6
2Q2011. Income from Islamic finances declined by 24.7% YoY
  to BHD6.7mn, while total income decreased by 18.3% YoY to
  BHD6.3mn. Total assets at the end of June 30 stood at
  BHD815.2mn, indicating YTD decrease of 2.8%. Murabaha
  receivables rose by 9.6% YTD to BHD221.4mn, while customer
  deposits rose by 9.2% YTD to BHD92.9mn. (Bahrain Bourse)
 TAIB Bank net loss increases – TAIB Bank reported a net loss
  of $7.7mn in 2Q2012, indicating YoY increase in net loss of
  195.2%. Loss per share stood at $0.07 as compared to $0.02 in
  2Q2011. Interest and similar income declined by 70.2% YoY to
  $0.7mn. Total assets at the end of June 30 stood at $150.8mn,
  indicating YTD decline of 22.8%. Loans and advances rose by
  0.9% YTD to $16mn, while Deposits from customers decreased
  by 20.8% YTD to $101.5mn. (Bahrain Bourse)


                                                                  Page 5 of 6
Rebased Performance                                                                                    Daily Index Performance

   140.0                                                                                                   1.2%                                                                                              1.1%

   130.0                                                                                                                                                                                  0.8%
                                                                                                           0.8%
   120.0                                                                                120.9                         0.5%                                      0.5%       0.5%
   110.0                                                                                                   0.4%                          0.2%
                                                                                        107.9
   100.0                                                                                100.3
                                                                                        106.0              0.0%
    90.0
                                                                                        98.2             (0.4%)                                   (0.2%)
    80.0


                                                                                                                          Saudi Arabia


                                                                                                                                                    Kuwait


                                                                                                                                                                 Bahrain


                                                                                                                                                                                           Abu Dhabi


                                                                                                                                                                                                              Dubai
                                                                                                                                          Qatar


                                                                                                                                                                             Oman
          Jan-10 May-10 Sep-10 Jan-11 May-11 Sep-11 Jan-12 May-12
                                                                                           4
                    QE Index               S&P Pan Arab                  S&P GCC


Source: Bloomberg                                                                                     Source: Bloomberg


 Asset/Currency Performance                  Close ($)         1D%        WTD%          YTD%            Global Indices Performance                              Close         1D%         WTD%                    YTD%

 Gold                                         1,620.20           0.2           1.0         3.6          DJ Industrial                                        13,207.95              0.3                0.9             8.1
 Silver                                          28.12          (0.1)          1.2         1.0          S&P 500                                               1,405.87              0.2                1.1            11.8
 Crude Oil (Brent)                              114.42          (0.3)          3.7         5.3          NASDAQ 100                                            3,020.86              0.1                1.8            16.0
 Euro                                              1.23         (0.1)        (0.8)       (5.2)          DAX                                                   6,944.56         (0.3)                   1.1            17.7
 Yen                                             78.28          (0.4)        (0.2)         1.8          FTSE 100                                              5,847.11         (0.1)                   1.0             4.9
 GBP                                               1.57          0.3           0.3         0.9          CAC 40                                                3,435.62         (0.6)                   1.8             8.7
 CHF                                               1.02         (0.1)        (0.7)       (3.9)          Nikkei                                                8,891.44         (1.0)                   3.9             5.2
 AUD                                               1.06         (0.0)          0.1         3.6          Shanghai                                              2,168.81         (0.2)                   1.7            (1.4)
 USD Index                                       82.55          (0.1)          0.2         3.0          BSE Sensex                                           17,557.74         (0.0)                   2.1            13.6
 RUB                                             31.81           0.1         (0.5)       (1.0)          Bovespa                                              59,280.93              0.8                3.5             4.5
 BRL                                               0.50         (0.2)          0.6       (7.6)          RTS                                                   1,427.33         (1.4)                   2.1             3.3
Source: Bloomberg                                                                                     Source: Bloomberg


Contacts

  Ahmed M. Shehada                                     Keith Whitney                                     Saugata Sarkar                                                Sahbi Kasraoui
  Head of Trading                                      Head of Sales                                     Head of Research                                              Manager - HNWI
  Tel: (+974) 4476 6535                                Tel: (+974) 4476 6533                             Tel: (+974) 4476 6534                                         Tel: (+974) 4476 6544
  ahmed.shehada@qnbfs.com.qa                           keith.whitney@qnbfs.com.qa                        saugata.sarkar@qnbfs.com.qa                                   sahbi.alkasraoui@qnbfs.com.qa

                                                                            QNB Financial Services SPC
                                                                            Contact Center: (+974) 4476 6666
                                                                            PO Box 24025
                                                                            Doha, Qatar
DISCLAIMER: This publication has been prepared by QNB Financial Services SPC (“QNBFS”) a wholly-owned subsidiary of Qatar National Bank (“QNB”). QNBFS is regulated by the Qatar
Financial Markets Authority and the Qatar Exchange; QNB is regulated by the Qatar Central Bank. This publication expresses the views and opinions of QNBFS at a given time only. It is not an
offer, promotion or recommendation to buy or sell securities or other investments, nor is it intended to constitute legal, tax, accounting, or financial advice. We therefore strongly advise potential
investors to seek independent professional advice before making any investment decision. Although the information in this report has been obtained from sources that QNBFS believes to be
reliable, we have not independently verified such information and it may not be accurate or complete. While this publication has been prepared with the utmost degree of care by our analysts,
QNBFS does not make any representations or warranties as to the accuracy and completeness of the information it may contain, and declines any liability in that respect. QNBFS reserves the
right to amend the views and opinions expressed in this publication at any time. It may also express viewpoints or make investment decisions that differ significantly from, or even contradict, the
views and opinions included in this report.

COPYRIGHT: No part of this document may be reproduced without the explicit written permission of QNBFS.
                                                                                                                                                                                                        Page 6 of 6

Más contenido relacionado

La actualidad más candente

March presentation final v2
March presentation final v2March presentation final v2
March presentation final v2primero_mining
 
Bank of baroda_q4_fy10
Bank of baroda_q4_fy10Bank of baroda_q4_fy10
Bank of baroda_q4_fy10mittalmanisha
 
Pres 4 q10 in_gx
Pres 4 q10 in_gxPres 4 q10 in_gx
Pres 4 q10 in_gxGafisa RI !
 
04 30 2009 I First Quarter Results 2009 Usgaap
04 30 2009 I First Quarter Results 2009   Usgaap04 30 2009 I First Quarter Results 2009   Usgaap
04 30 2009 I First Quarter Results 2009 UsgaapEmbraer RI
 
Eagle Bulk Q3 FY2012 results presentation
Eagle Bulk Q3 FY2012 results presentationEagle Bulk Q3 FY2012 results presentation
Eagle Bulk Q3 FY2012 results presentationTradeWindsnews
 
Bmo presentation draft 2013 03 28
Bmo presentation draft 2013 03 28Bmo presentation draft 2013 03 28
Bmo presentation draft 2013 03 28primero_mining
 
Banco Sabadell FY10 Results
Banco Sabadell FY10 ResultsBanco Sabadell FY10 Results
Banco Sabadell FY10 ResultsBanco Sabadell
 
Financial Analysis - Osisko Mining Corporation is a gold exploration compa…
Financial Analysis - Osisko Mining Corporation is a gold exploration compa…Financial Analysis - Osisko Mining Corporation is a gold exploration compa…
Financial Analysis - Osisko Mining Corporation is a gold exploration compa…BCV
 
Nordnet Q2 2010 report
Nordnet Q2 2010 reportNordnet Q2 2010 report
Nordnet Q2 2010 reportNordnet
 
EASTW : Opp day Sep 4, 2012
EASTW : Opp day Sep 4, 2012 EASTW : Opp day Sep 4, 2012
EASTW : Opp day Sep 4, 2012 TonHor Hor
 
Embraer 2Q11 Results Final
Embraer 2Q11 Results FinalEmbraer 2Q11 Results Final
Embraer 2Q11 Results FinalEmbraer RI
 
Apresentação do evento santander securities – 17 e 18052010
Apresentação do evento santander securities – 17 e 18052010Apresentação do evento santander securities – 17 e 18052010
Apresentação do evento santander securities – 17 e 18052010risantander
 

La actualidad más candente (17)

Presentation 3Q12
Presentation 3Q12Presentation 3Q12
Presentation 3Q12
 
March presentation final v2
March presentation final v2March presentation final v2
March presentation final v2
 
Bank of baroda_q4_fy10
Bank of baroda_q4_fy10Bank of baroda_q4_fy10
Bank of baroda_q4_fy10
 
Presentation 2Q12
Presentation 2Q12Presentation 2Q12
Presentation 2Q12
 
Pres 4 q10 in_gx
Pres 4 q10 in_gxPres 4 q10 in_gx
Pres 4 q10 in_gx
 
04 30 2009 I First Quarter Results 2009 Usgaap
04 30 2009 I First Quarter Results 2009   Usgaap04 30 2009 I First Quarter Results 2009   Usgaap
04 30 2009 I First Quarter Results 2009 Usgaap
 
Eagle Bulk Q3 FY2012 results presentation
Eagle Bulk Q3 FY2012 results presentationEagle Bulk Q3 FY2012 results presentation
Eagle Bulk Q3 FY2012 results presentation
 
Bmo presentation draft 2013 03 28
Bmo presentation draft 2013 03 28Bmo presentation draft 2013 03 28
Bmo presentation draft 2013 03 28
 
Banco Sabadell FY10 Results
Banco Sabadell FY10 ResultsBanco Sabadell FY10 Results
Banco Sabadell FY10 Results
 
Financial Analysis - Osisko Mining Corporation is a gold exploration compa…
Financial Analysis - Osisko Mining Corporation is a gold exploration compa…Financial Analysis - Osisko Mining Corporation is a gold exploration compa…
Financial Analysis - Osisko Mining Corporation is a gold exploration compa…
 
Daily Newsletter: 4th May, 2011
Daily Newsletter: 4th May, 2011Daily Newsletter: 4th May, 2011
Daily Newsletter: 4th May, 2011
 
Nordnet Q2 2010 report
Nordnet Q2 2010 reportNordnet Q2 2010 report
Nordnet Q2 2010 report
 
EASTW : Opp day Sep 4, 2012
EASTW : Opp day Sep 4, 2012 EASTW : Opp day Sep 4, 2012
EASTW : Opp day Sep 4, 2012
 
Embraer 2Q11 Results Final
Embraer 2Q11 Results FinalEmbraer 2Q11 Results Final
Embraer 2Q11 Results Final
 
credit suisse Quarterly Report Q1/2005
credit suisse Quarterly Report Q1/2005credit suisse Quarterly Report Q1/2005
credit suisse Quarterly Report Q1/2005
 
Apresentação do evento santander securities – 17 e 18052010
Apresentação do evento santander securities – 17 e 18052010Apresentação do evento santander securities – 17 e 18052010
Apresentação do evento santander securities – 17 e 18052010
 
Assest
AssestAssest
Assest
 

Destacado

26 January Daily market report
26 January Daily market report26 January Daily market report
26 January Daily market reportQNB Group
 
2 February Daily technical trader
2 February Daily technical trader 2 February Daily technical trader
2 February Daily technical trader QNB Group
 
14 January Daily market report
14 January Daily market report14 January Daily market report
14 January Daily market reportQNB Group
 
1 February Daily technical trader
1 February Daily technical trader 1 February Daily technical trader
1 February Daily technical trader QNB Group
 
8 January Daily market report
8 January Daily market report 8 January Daily market report
8 January Daily market report QNB Group
 
31 March Daily market report
31 March Daily market report 31 March Daily market report
31 March Daily market report QNB Group
 
1 April Daily technical trader
1 April Daily technical trader 1 April Daily technical trader
1 April Daily technical trader QNB Group
 
8 January Daily technical trader
8 January Daily technical trader 8 January Daily technical trader
8 January Daily technical trader QNB Group
 
Weekly market report
Weekly market report Weekly market report
Weekly market report QNB Group
 
18 May Daily market report
18 May Daily market report 18 May Daily market report
18 May Daily market report QNB Group
 
Weekly market report
Weekly market reportWeekly market report
Weekly market reportQNB Group
 
تأثير طفيف للتطورات في اليونان على المشهد الاقتصادي العالمي
تأثير طفيف للتطورات في اليونان على المشهد الاقتصادي العالميتأثير طفيف للتطورات في اليونان على المشهد الاقتصادي العالمي
تأثير طفيف للتطورات في اليونان على المشهد الاقتصادي العالميQNB Group
 
23 March Daily market report
23 March Daily market report 23 March Daily market report
23 March Daily market report QNB Group
 
21 May Daily market report
21 May Daily market report21 May Daily market report
21 May Daily market reportQNB Group
 
24 February Daily market report
24 February Daily market report 24 February Daily market report
24 February Daily market report QNB Group
 
27 May Daily technical trader
27 May Daily technical trader 27 May Daily technical trader
27 May Daily technical trader QNB Group
 
Qnb platinum sponsor soccer cup english final(1) (2)
Qnb platinum sponsor soccer cup   english final(1) (2)Qnb platinum sponsor soccer cup   english final(1) (2)
Qnb platinum sponsor soccer cup english final(1) (2)QNB Group
 
EC - Radio - Mono stereo-poly
EC - Radio - Mono stereo-polyEC - Radio - Mono stereo-poly
EC - Radio - Mono stereo-polyArzoo Sahni
 
Trabajo final 3º nota 2013
Trabajo final 3º nota 2013Trabajo final 3º nota 2013
Trabajo final 3º nota 2013Romina Fernandez
 

Destacado (20)

26 January Daily market report
26 January Daily market report26 January Daily market report
26 January Daily market report
 
2 February Daily technical trader
2 February Daily technical trader 2 February Daily technical trader
2 February Daily technical trader
 
14 January Daily market report
14 January Daily market report14 January Daily market report
14 January Daily market report
 
1 February Daily technical trader
1 February Daily technical trader 1 February Daily technical trader
1 February Daily technical trader
 
8 January Daily market report
8 January Daily market report 8 January Daily market report
8 January Daily market report
 
31 March Daily market report
31 March Daily market report 31 March Daily market report
31 March Daily market report
 
1 April Daily technical trader
1 April Daily technical trader 1 April Daily technical trader
1 April Daily technical trader
 
8 January Daily technical trader
8 January Daily technical trader 8 January Daily technical trader
8 January Daily technical trader
 
Weekly market report
Weekly market report Weekly market report
Weekly market report
 
18 May Daily market report
18 May Daily market report 18 May Daily market report
18 May Daily market report
 
Weekly market report
Weekly market reportWeekly market report
Weekly market report
 
تأثير طفيف للتطورات في اليونان على المشهد الاقتصادي العالمي
تأثير طفيف للتطورات في اليونان على المشهد الاقتصادي العالميتأثير طفيف للتطورات في اليونان على المشهد الاقتصادي العالمي
تأثير طفيف للتطورات في اليونان على المشهد الاقتصادي العالمي
 
23 March Daily market report
23 March Daily market report 23 March Daily market report
23 March Daily market report
 
21 May Daily market report
21 May Daily market report21 May Daily market report
21 May Daily market report
 
24 February Daily market report
24 February Daily market report 24 February Daily market report
24 February Daily market report
 
27 May Daily technical trader
27 May Daily technical trader 27 May Daily technical trader
27 May Daily technical trader
 
Qnb platinum sponsor soccer cup english final(1) (2)
Qnb platinum sponsor soccer cup   english final(1) (2)Qnb platinum sponsor soccer cup   english final(1) (2)
Qnb platinum sponsor soccer cup english final(1) (2)
 
Trabajo en equipo
Trabajo  en  equipoTrabajo  en  equipo
Trabajo en equipo
 
EC - Radio - Mono stereo-poly
EC - Radio - Mono stereo-polyEC - Radio - Mono stereo-poly
EC - Radio - Mono stereo-poly
 
Trabajo final 3º nota 2013
Trabajo final 3º nota 2013Trabajo final 3º nota 2013
Trabajo final 3º nota 2013
 

Similar a QNB - Daily market report

QNB Daily Market Report
QNB Daily Market ReportQNB Daily Market Report
QNB Daily Market ReportQNB Group
 
QNBFS Daily Market Report November 16, 2021
QNBFS Daily Market Report November 16, 2021QNBFS Daily Market Report November 16, 2021
QNBFS Daily Market Report November 16, 2021QNB Group
 
14 August Daily market report
14 August Daily market report 14 August Daily market report
14 August Daily market report QNB Group
 
QNBFS Daily Market Report April 29, 2021
QNBFS Daily Market Report April 29, 2021QNBFS Daily Market Report April 29, 2021
QNBFS Daily Market Report April 29, 2021QNB Group
 
QNBFS Daily Market Report July 29, 2020
QNBFS Daily Market Report July 29, 2020QNBFS Daily Market Report July 29, 2020
QNBFS Daily Market Report July 29, 2020QNB Group
 
9 July Daily market report
9 July Daily market report9 July Daily market report
9 July Daily market reportQNB Group
 
QNBFS Daily Market Report July 21, 2020
QNBFS Daily Market Report July 21, 2020QNBFS Daily Market Report July 21, 2020
QNBFS Daily Market Report July 21, 2020QNB Group
 
QNBFS Daily Market Report July 28, 2020
QNBFS Daily Market Report July 28, 2020QNBFS Daily Market Report July 28, 2020
QNBFS Daily Market Report July 28, 2020QNB Group
 
12 November Daily Market Report
12 November Daily Market Report 12 November Daily Market Report
12 November Daily Market Report QNB Group
 
28 May Daily market report
28 May Daily market report 28 May Daily market report
28 May Daily market report QNB Group
 
QNBFS Daily Market Report November 07, 2021
QNBFS Daily Market Report November 07, 2021QNBFS Daily Market Report November 07, 2021
QNBFS Daily Market Report November 07, 2021QNB Group
 
QNBFS Daily Market Report May 09, 2022
QNBFS Daily Market Report May 09, 2022QNBFS Daily Market Report May 09, 2022
QNBFS Daily Market Report May 09, 2022QNB Group
 
QNBFS Daily Market Report March 4, 2019
QNBFS Daily Market Report March 4, 2019QNBFS Daily Market Report March 4, 2019
QNBFS Daily Market Report March 4, 2019QNB Group
 
QNBFS Daily Market Report May 05, 2021
QNBFS Daily Market Report May 05, 2021QNBFS Daily Market Report May 05, 2021
QNBFS Daily Market Report May 05, 2021QNB Group
 
QNBFS Daily Market Report April 30, 2019
QNBFS Daily Market Report April 30, 2019QNBFS Daily Market Report April 30, 2019
QNBFS Daily Market Report April 30, 2019QNB Group
 
QNBFS Daily Market Report July 10, 2018
QNBFS Daily Market Report July 10, 2018QNBFS Daily Market Report July 10, 2018
QNBFS Daily Market Report July 10, 2018QNB Group
 
10 March Daily market report
10 March Daily market report 10 March Daily market report
10 March Daily market report QNB Group
 
QNBFS Daily Market Report April 25, 2021
QNBFS Daily Market Report April 25, 2021QNBFS Daily Market Report April 25, 2021
QNBFS Daily Market Report April 25, 2021QNB Group
 
10 February Daily market report
10 February Daily market report 10 February Daily market report
10 February Daily market report QNB Group
 
QNBFS Daily Market Report August 01, 2021
QNBFS Daily Market Report August 01, 2021QNBFS Daily Market Report August 01, 2021
QNBFS Daily Market Report August 01, 2021QNB Group
 

Similar a QNB - Daily market report (20)

QNB Daily Market Report
QNB Daily Market ReportQNB Daily Market Report
QNB Daily Market Report
 
QNBFS Daily Market Report November 16, 2021
QNBFS Daily Market Report November 16, 2021QNBFS Daily Market Report November 16, 2021
QNBFS Daily Market Report November 16, 2021
 
14 August Daily market report
14 August Daily market report 14 August Daily market report
14 August Daily market report
 
QNBFS Daily Market Report April 29, 2021
QNBFS Daily Market Report April 29, 2021QNBFS Daily Market Report April 29, 2021
QNBFS Daily Market Report April 29, 2021
 
QNBFS Daily Market Report July 29, 2020
QNBFS Daily Market Report July 29, 2020QNBFS Daily Market Report July 29, 2020
QNBFS Daily Market Report July 29, 2020
 
9 July Daily market report
9 July Daily market report9 July Daily market report
9 July Daily market report
 
QNBFS Daily Market Report July 21, 2020
QNBFS Daily Market Report July 21, 2020QNBFS Daily Market Report July 21, 2020
QNBFS Daily Market Report July 21, 2020
 
QNBFS Daily Market Report July 28, 2020
QNBFS Daily Market Report July 28, 2020QNBFS Daily Market Report July 28, 2020
QNBFS Daily Market Report July 28, 2020
 
12 November Daily Market Report
12 November Daily Market Report 12 November Daily Market Report
12 November Daily Market Report
 
28 May Daily market report
28 May Daily market report 28 May Daily market report
28 May Daily market report
 
QNBFS Daily Market Report November 07, 2021
QNBFS Daily Market Report November 07, 2021QNBFS Daily Market Report November 07, 2021
QNBFS Daily Market Report November 07, 2021
 
QNBFS Daily Market Report May 09, 2022
QNBFS Daily Market Report May 09, 2022QNBFS Daily Market Report May 09, 2022
QNBFS Daily Market Report May 09, 2022
 
QNBFS Daily Market Report March 4, 2019
QNBFS Daily Market Report March 4, 2019QNBFS Daily Market Report March 4, 2019
QNBFS Daily Market Report March 4, 2019
 
QNBFS Daily Market Report May 05, 2021
QNBFS Daily Market Report May 05, 2021QNBFS Daily Market Report May 05, 2021
QNBFS Daily Market Report May 05, 2021
 
QNBFS Daily Market Report April 30, 2019
QNBFS Daily Market Report April 30, 2019QNBFS Daily Market Report April 30, 2019
QNBFS Daily Market Report April 30, 2019
 
QNBFS Daily Market Report July 10, 2018
QNBFS Daily Market Report July 10, 2018QNBFS Daily Market Report July 10, 2018
QNBFS Daily Market Report July 10, 2018
 
10 March Daily market report
10 March Daily market report 10 March Daily market report
10 March Daily market report
 
QNBFS Daily Market Report April 25, 2021
QNBFS Daily Market Report April 25, 2021QNBFS Daily Market Report April 25, 2021
QNBFS Daily Market Report April 25, 2021
 
10 February Daily market report
10 February Daily market report 10 February Daily market report
10 February Daily market report
 
QNBFS Daily Market Report August 01, 2021
QNBFS Daily Market Report August 01, 2021QNBFS Daily Market Report August 01, 2021
QNBFS Daily Market Report August 01, 2021
 

Más de QNB Group

QNBFS Daily Market Report December 24, 2023
QNBFS Daily Market Report December 24, 2023QNBFS Daily Market Report December 24, 2023
QNBFS Daily Market Report December 24, 2023QNB Group
 
QNBFS Daily Market Report November 29, 2023
QNBFS Daily Market Report November 29, 2023QNBFS Daily Market Report November 29, 2023
QNBFS Daily Market Report November 29, 2023QNB Group
 
QNBFS Weekly Market Report November 23, 2023
QNBFS Weekly Market Report November 23, 2023QNBFS Weekly Market Report November 23, 2023
QNBFS Weekly Market Report November 23, 2023QNB Group
 
QNBFS Weekly Market Report November 16, 2023
QNBFS Weekly Market Report November 16, 2023QNBFS Weekly Market Report November 16, 2023
QNBFS Weekly Market Report November 16, 2023QNB Group
 
QNBFS Daily Technical Trader Qatar - November 14, 2023 التحليل الفني اليومي ل...
QNBFS Daily Technical Trader Qatar - November 14, 2023 التحليل الفني اليومي ل...QNBFS Daily Technical Trader Qatar - November 14, 2023 التحليل الفني اليومي ل...
QNBFS Daily Technical Trader Qatar - November 14, 2023 التحليل الفني اليومي ل...QNB Group
 
QNBFS Daily Technical Trader Qatar - November 06, 2023 التحليل الفني اليومي ل...
QNBFS Daily Technical Trader Qatar - November 06, 2023 التحليل الفني اليومي ل...QNBFS Daily Technical Trader Qatar - November 06, 2023 التحليل الفني اليومي ل...
QNBFS Daily Technical Trader Qatar - November 06, 2023 التحليل الفني اليومي ل...QNB Group
 
QNBFS Daily Market Report October 30, 2023
QNBFS Daily Market Report October 30, 2023QNBFS Daily Market Report October 30, 2023
QNBFS Daily Market Report October 30, 2023QNB Group
 
QNBFS Daily Technical Trader Qatar - October 25, 2023 التحليل الفني اليومي لب...
QNBFS Daily Technical Trader Qatar - October 25, 2023 التحليل الفني اليومي لب...QNBFS Daily Technical Trader Qatar - October 25, 2023 التحليل الفني اليومي لب...
QNBFS Daily Technical Trader Qatar - October 25, 2023 التحليل الفني اليومي لب...QNB Group
 
QNBFS Daily Technical Trader Qatar - October 10, 2023 التحليل الفني اليومي لب...
QNBFS Daily Technical Trader Qatar - October 10, 2023 التحليل الفني اليومي لب...QNBFS Daily Technical Trader Qatar - October 10, 2023 التحليل الفني اليومي لب...
QNBFS Daily Technical Trader Qatar - October 10, 2023 التحليل الفني اليومي لب...QNB Group
 
QNBFS Daily Technical Trader Qatar - October 11, 2023 التحليل الفني اليومي لب...
QNBFS Daily Technical Trader Qatar - October 11, 2023 التحليل الفني اليومي لب...QNBFS Daily Technical Trader Qatar - October 11, 2023 التحليل الفني اليومي لب...
QNBFS Daily Technical Trader Qatar - October 11, 2023 التحليل الفني اليومي لب...QNB Group
 
QNBFS Daily Technical Trader Qatar - October 10, 2023 التحليل الفني اليومي لب...
QNBFS Daily Technical Trader Qatar - October 10, 2023 التحليل الفني اليومي لب...QNBFS Daily Technical Trader Qatar - October 10, 2023 التحليل الفني اليومي لب...
QNBFS Daily Technical Trader Qatar - October 10, 2023 التحليل الفني اليومي لب...QNB Group
 
QNBFS Daily Market Report October 04, 2023
QNBFS Daily Market Report October 04, 2023QNBFS Daily Market Report October 04, 2023
QNBFS Daily Market Report October 04, 2023QNB Group
 
QNBFS Daily Technical Trader Qatar - October 04, 2023 التحليل الفني اليومي لب...
QNBFS Daily Technical Trader Qatar - October 04, 2023 التحليل الفني اليومي لب...QNBFS Daily Technical Trader Qatar - October 04, 2023 التحليل الفني اليومي لب...
QNBFS Daily Technical Trader Qatar - October 04, 2023 التحليل الفني اليومي لب...QNB Group
 
QNBFS Daily Technical Trader Qatar - September 28, 2023 التحليل الفني اليومي ...
QNBFS Daily Technical Trader Qatar - September 28, 2023 التحليل الفني اليومي ...QNBFS Daily Technical Trader Qatar - September 28, 2023 التحليل الفني اليومي ...
QNBFS Daily Technical Trader Qatar - September 28, 2023 التحليل الفني اليومي ...QNB Group
 
QNBFS Daily Market Report September 24, 2023
QNBFS Daily Market Report September 24, 2023QNBFS Daily Market Report September 24, 2023
QNBFS Daily Market Report September 24, 2023QNB Group
 
QNBFS Daily Technical Trader Qatar - September 24, 2023 التحليل الفني اليومي ...
QNBFS Daily Technical Trader Qatar - September 24, 2023 التحليل الفني اليومي ...QNBFS Daily Technical Trader Qatar - September 24, 2023 التحليل الفني اليومي ...
QNBFS Daily Technical Trader Qatar - September 24, 2023 التحليل الفني اليومي ...QNB Group
 
QNBFS Daily Technical Trader Qatar - September 19, 2023 التحليل الفني اليومي ...
QNBFS Daily Technical Trader Qatar - September 19, 2023 التحليل الفني اليومي ...QNBFS Daily Technical Trader Qatar - September 19, 2023 التحليل الفني اليومي ...
QNBFS Daily Technical Trader Qatar - September 19, 2023 التحليل الفني اليومي ...QNB Group
 
QNBFS Daily Market Report September 17, 2023
QNBFS Daily Market Report September 17, 2023QNBFS Daily Market Report September 17, 2023
QNBFS Daily Market Report September 17, 2023QNB Group
 
QNBFS Weekly Market Report September 07, 2023
QNBFS Weekly Market Report September 07, 2023QNBFS Weekly Market Report September 07, 2023
QNBFS Weekly Market Report September 07, 2023QNB Group
 
QNBFS Daily Technical Trader Qatar - September 07, 2023 التحليل الفني اليومي ...
QNBFS Daily Technical Trader Qatar - September 07, 2023 التحليل الفني اليومي ...QNBFS Daily Technical Trader Qatar - September 07, 2023 التحليل الفني اليومي ...
QNBFS Daily Technical Trader Qatar - September 07, 2023 التحليل الفني اليومي ...QNB Group
 

Más de QNB Group (20)

QNBFS Daily Market Report December 24, 2023
QNBFS Daily Market Report December 24, 2023QNBFS Daily Market Report December 24, 2023
QNBFS Daily Market Report December 24, 2023
 
QNBFS Daily Market Report November 29, 2023
QNBFS Daily Market Report November 29, 2023QNBFS Daily Market Report November 29, 2023
QNBFS Daily Market Report November 29, 2023
 
QNBFS Weekly Market Report November 23, 2023
QNBFS Weekly Market Report November 23, 2023QNBFS Weekly Market Report November 23, 2023
QNBFS Weekly Market Report November 23, 2023
 
QNBFS Weekly Market Report November 16, 2023
QNBFS Weekly Market Report November 16, 2023QNBFS Weekly Market Report November 16, 2023
QNBFS Weekly Market Report November 16, 2023
 
QNBFS Daily Technical Trader Qatar - November 14, 2023 التحليل الفني اليومي ل...
QNBFS Daily Technical Trader Qatar - November 14, 2023 التحليل الفني اليومي ل...QNBFS Daily Technical Trader Qatar - November 14, 2023 التحليل الفني اليومي ل...
QNBFS Daily Technical Trader Qatar - November 14, 2023 التحليل الفني اليومي ل...
 
QNBFS Daily Technical Trader Qatar - November 06, 2023 التحليل الفني اليومي ل...
QNBFS Daily Technical Trader Qatar - November 06, 2023 التحليل الفني اليومي ل...QNBFS Daily Technical Trader Qatar - November 06, 2023 التحليل الفني اليومي ل...
QNBFS Daily Technical Trader Qatar - November 06, 2023 التحليل الفني اليومي ل...
 
QNBFS Daily Market Report October 30, 2023
QNBFS Daily Market Report October 30, 2023QNBFS Daily Market Report October 30, 2023
QNBFS Daily Market Report October 30, 2023
 
QNBFS Daily Technical Trader Qatar - October 25, 2023 التحليل الفني اليومي لب...
QNBFS Daily Technical Trader Qatar - October 25, 2023 التحليل الفني اليومي لب...QNBFS Daily Technical Trader Qatar - October 25, 2023 التحليل الفني اليومي لب...
QNBFS Daily Technical Trader Qatar - October 25, 2023 التحليل الفني اليومي لب...
 
QNBFS Daily Technical Trader Qatar - October 10, 2023 التحليل الفني اليومي لب...
QNBFS Daily Technical Trader Qatar - October 10, 2023 التحليل الفني اليومي لب...QNBFS Daily Technical Trader Qatar - October 10, 2023 التحليل الفني اليومي لب...
QNBFS Daily Technical Trader Qatar - October 10, 2023 التحليل الفني اليومي لب...
 
QNBFS Daily Technical Trader Qatar - October 11, 2023 التحليل الفني اليومي لب...
QNBFS Daily Technical Trader Qatar - October 11, 2023 التحليل الفني اليومي لب...QNBFS Daily Technical Trader Qatar - October 11, 2023 التحليل الفني اليومي لب...
QNBFS Daily Technical Trader Qatar - October 11, 2023 التحليل الفني اليومي لب...
 
QNBFS Daily Technical Trader Qatar - October 10, 2023 التحليل الفني اليومي لب...
QNBFS Daily Technical Trader Qatar - October 10, 2023 التحليل الفني اليومي لب...QNBFS Daily Technical Trader Qatar - October 10, 2023 التحليل الفني اليومي لب...
QNBFS Daily Technical Trader Qatar - October 10, 2023 التحليل الفني اليومي لب...
 
QNBFS Daily Market Report October 04, 2023
QNBFS Daily Market Report October 04, 2023QNBFS Daily Market Report October 04, 2023
QNBFS Daily Market Report October 04, 2023
 
QNBFS Daily Technical Trader Qatar - October 04, 2023 التحليل الفني اليومي لب...
QNBFS Daily Technical Trader Qatar - October 04, 2023 التحليل الفني اليومي لب...QNBFS Daily Technical Trader Qatar - October 04, 2023 التحليل الفني اليومي لب...
QNBFS Daily Technical Trader Qatar - October 04, 2023 التحليل الفني اليومي لب...
 
QNBFS Daily Technical Trader Qatar - September 28, 2023 التحليل الفني اليومي ...
QNBFS Daily Technical Trader Qatar - September 28, 2023 التحليل الفني اليومي ...QNBFS Daily Technical Trader Qatar - September 28, 2023 التحليل الفني اليومي ...
QNBFS Daily Technical Trader Qatar - September 28, 2023 التحليل الفني اليومي ...
 
QNBFS Daily Market Report September 24, 2023
QNBFS Daily Market Report September 24, 2023QNBFS Daily Market Report September 24, 2023
QNBFS Daily Market Report September 24, 2023
 
QNBFS Daily Technical Trader Qatar - September 24, 2023 التحليل الفني اليومي ...
QNBFS Daily Technical Trader Qatar - September 24, 2023 التحليل الفني اليومي ...QNBFS Daily Technical Trader Qatar - September 24, 2023 التحليل الفني اليومي ...
QNBFS Daily Technical Trader Qatar - September 24, 2023 التحليل الفني اليومي ...
 
QNBFS Daily Technical Trader Qatar - September 19, 2023 التحليل الفني اليومي ...
QNBFS Daily Technical Trader Qatar - September 19, 2023 التحليل الفني اليومي ...QNBFS Daily Technical Trader Qatar - September 19, 2023 التحليل الفني اليومي ...
QNBFS Daily Technical Trader Qatar - September 19, 2023 التحليل الفني اليومي ...
 
QNBFS Daily Market Report September 17, 2023
QNBFS Daily Market Report September 17, 2023QNBFS Daily Market Report September 17, 2023
QNBFS Daily Market Report September 17, 2023
 
QNBFS Weekly Market Report September 07, 2023
QNBFS Weekly Market Report September 07, 2023QNBFS Weekly Market Report September 07, 2023
QNBFS Weekly Market Report September 07, 2023
 
QNBFS Daily Technical Trader Qatar - September 07, 2023 التحليل الفني اليومي ...
QNBFS Daily Technical Trader Qatar - September 07, 2023 التحليل الفني اليومي ...QNBFS Daily Technical Trader Qatar - September 07, 2023 التحليل الفني اليومي ...
QNBFS Daily Technical Trader Qatar - September 07, 2023 التحليل الفني اليومي ...
 

Último

NO1 Certified Black Magic Specialist Expert In Bahawalpur, Sargodha, Sialkot,...
NO1 Certified Black Magic Specialist Expert In Bahawalpur, Sargodha, Sialkot,...NO1 Certified Black Magic Specialist Expert In Bahawalpur, Sargodha, Sialkot,...
NO1 Certified Black Magic Specialist Expert In Bahawalpur, Sargodha, Sialkot,...Amil baba
 
The AES Investment Code - the go-to counsel for the most well-informed, wise...
The AES Investment Code -  the go-to counsel for the most well-informed, wise...The AES Investment Code -  the go-to counsel for the most well-informed, wise...
The AES Investment Code - the go-to counsel for the most well-informed, wise...AES International
 
cost of capital questions financial management
cost of capital questions financial managementcost of capital questions financial management
cost of capital questions financial managementtanmayarora23
 
Unveiling Business Expansion Trends in 2024
Unveiling Business Expansion Trends in 2024Unveiling Business Expansion Trends in 2024
Unveiling Business Expansion Trends in 2024Champak Jhagmag
 
INTERNATIONAL TRADE INSTITUTIONS[6].pptx
INTERNATIONAL TRADE INSTITUTIONS[6].pptxINTERNATIONAL TRADE INSTITUTIONS[6].pptx
INTERNATIONAL TRADE INSTITUTIONS[6].pptxaymenkhalfallah23
 
Unveiling Poonawalla Fincorp’s Phenomenal Performance Under Abhay Bhutada’s L...
Unveiling Poonawalla Fincorp’s Phenomenal Performance Under Abhay Bhutada’s L...Unveiling Poonawalla Fincorp’s Phenomenal Performance Under Abhay Bhutada’s L...
Unveiling Poonawalla Fincorp’s Phenomenal Performance Under Abhay Bhutada’s L...beulahfernandes8
 
2024 Q1 Crypto Industry Report | CoinGecko
2024 Q1 Crypto Industry Report | CoinGecko2024 Q1 Crypto Industry Report | CoinGecko
2024 Q1 Crypto Industry Report | CoinGeckoCoinGecko
 
Role of Information and technology in banking and finance .pptx
Role of Information and technology in banking and finance .pptxRole of Information and technology in banking and finance .pptx
Role of Information and technology in banking and finance .pptxNarayaniTripathi2
 
Uae-NO1 Black Magic Specialist In Lahore Black magic In Pakistan Kala Ilam Ex...
Uae-NO1 Black Magic Specialist In Lahore Black magic In Pakistan Kala Ilam Ex...Uae-NO1 Black Magic Specialist In Lahore Black magic In Pakistan Kala Ilam Ex...
Uae-NO1 Black Magic Specialist In Lahore Black magic In Pakistan Kala Ilam Ex...Amil baba
 
Unit 4.1 financial markets operations .pdf
Unit 4.1 financial markets operations .pdfUnit 4.1 financial markets operations .pdf
Unit 4.1 financial markets operations .pdfSatyamSinghParihar2
 
PMFBY , Pradhan Mantri Fasal bima yojna
PMFBY , Pradhan Mantri  Fasal bima yojnaPMFBY , Pradhan Mantri  Fasal bima yojna
PMFBY , Pradhan Mantri Fasal bima yojnaDharmendra Kumar
 
Uae-NO1 Pakistani Amil Baba Real Amil baba In Pakistan Najoomi Baba in Pakist...
Uae-NO1 Pakistani Amil Baba Real Amil baba In Pakistan Najoomi Baba in Pakist...Uae-NO1 Pakistani Amil Baba Real Amil baba In Pakistan Najoomi Baba in Pakist...
Uae-NO1 Pakistani Amil Baba Real Amil baba In Pakistan Najoomi Baba in Pakist...Amil baba
 
Liquidity Decisions in Financial management
Liquidity Decisions in Financial managementLiquidity Decisions in Financial management
Liquidity Decisions in Financial managementshrutisingh143670
 
NO1 Certified kala jadu karne wale ka contact number kala jadu karne wale bab...
NO1 Certified kala jadu karne wale ka contact number kala jadu karne wale bab...NO1 Certified kala jadu karne wale ka contact number kala jadu karne wale bab...
NO1 Certified kala jadu karne wale ka contact number kala jadu karne wale bab...Amil baba
 
Kempen ' UK DB Endgame Paper Apr 24 final3.pdf
Kempen ' UK DB Endgame Paper Apr 24 final3.pdfKempen ' UK DB Endgame Paper Apr 24 final3.pdf
Kempen ' UK DB Endgame Paper Apr 24 final3.pdfHenry Tapper
 
Gender and caste discrimination in india
Gender and caste discrimination in indiaGender and caste discrimination in india
Gender and caste discrimination in indiavandanasingh01072003
 
NO1 Certified Black Magic Removal in Uk kala jadu Specialist kala jadu for Lo...
NO1 Certified Black Magic Removal in Uk kala jadu Specialist kala jadu for Lo...NO1 Certified Black Magic Removal in Uk kala jadu Specialist kala jadu for Lo...
NO1 Certified Black Magic Removal in Uk kala jadu Specialist kala jadu for Lo...Amil baba
 
Uae-NO1 Kala Jadu specialist Expert in Pakistan kala ilam specialist Expert i...
Uae-NO1 Kala Jadu specialist Expert in Pakistan kala ilam specialist Expert i...Uae-NO1 Kala Jadu specialist Expert in Pakistan kala ilam specialist Expert i...
Uae-NO1 Kala Jadu specialist Expert in Pakistan kala ilam specialist Expert i...Amil baba
 
Market Morning Updates for 16th April 2024
Market Morning Updates for 16th April 2024Market Morning Updates for 16th April 2024
Market Morning Updates for 16th April 2024Devarsh Vakil
 

Último (20)

NO1 Certified Black Magic Specialist Expert In Bahawalpur, Sargodha, Sialkot,...
NO1 Certified Black Magic Specialist Expert In Bahawalpur, Sargodha, Sialkot,...NO1 Certified Black Magic Specialist Expert In Bahawalpur, Sargodha, Sialkot,...
NO1 Certified Black Magic Specialist Expert In Bahawalpur, Sargodha, Sialkot,...
 
The AES Investment Code - the go-to counsel for the most well-informed, wise...
The AES Investment Code -  the go-to counsel for the most well-informed, wise...The AES Investment Code -  the go-to counsel for the most well-informed, wise...
The AES Investment Code - the go-to counsel for the most well-informed, wise...
 
cost of capital questions financial management
cost of capital questions financial managementcost of capital questions financial management
cost of capital questions financial management
 
Unveiling Business Expansion Trends in 2024
Unveiling Business Expansion Trends in 2024Unveiling Business Expansion Trends in 2024
Unveiling Business Expansion Trends in 2024
 
Q1 2024 Newsletter | Financial Synergies Wealth Advisors
Q1 2024 Newsletter | Financial Synergies Wealth AdvisorsQ1 2024 Newsletter | Financial Synergies Wealth Advisors
Q1 2024 Newsletter | Financial Synergies Wealth Advisors
 
INTERNATIONAL TRADE INSTITUTIONS[6].pptx
INTERNATIONAL TRADE INSTITUTIONS[6].pptxINTERNATIONAL TRADE INSTITUTIONS[6].pptx
INTERNATIONAL TRADE INSTITUTIONS[6].pptx
 
Unveiling Poonawalla Fincorp’s Phenomenal Performance Under Abhay Bhutada’s L...
Unveiling Poonawalla Fincorp’s Phenomenal Performance Under Abhay Bhutada’s L...Unveiling Poonawalla Fincorp’s Phenomenal Performance Under Abhay Bhutada’s L...
Unveiling Poonawalla Fincorp’s Phenomenal Performance Under Abhay Bhutada’s L...
 
2024 Q1 Crypto Industry Report | CoinGecko
2024 Q1 Crypto Industry Report | CoinGecko2024 Q1 Crypto Industry Report | CoinGecko
2024 Q1 Crypto Industry Report | CoinGecko
 
Role of Information and technology in banking and finance .pptx
Role of Information and technology in banking and finance .pptxRole of Information and technology in banking and finance .pptx
Role of Information and technology in banking and finance .pptx
 
Uae-NO1 Black Magic Specialist In Lahore Black magic In Pakistan Kala Ilam Ex...
Uae-NO1 Black Magic Specialist In Lahore Black magic In Pakistan Kala Ilam Ex...Uae-NO1 Black Magic Specialist In Lahore Black magic In Pakistan Kala Ilam Ex...
Uae-NO1 Black Magic Specialist In Lahore Black magic In Pakistan Kala Ilam Ex...
 
Unit 4.1 financial markets operations .pdf
Unit 4.1 financial markets operations .pdfUnit 4.1 financial markets operations .pdf
Unit 4.1 financial markets operations .pdf
 
PMFBY , Pradhan Mantri Fasal bima yojna
PMFBY , Pradhan Mantri  Fasal bima yojnaPMFBY , Pradhan Mantri  Fasal bima yojna
PMFBY , Pradhan Mantri Fasal bima yojna
 
Uae-NO1 Pakistani Amil Baba Real Amil baba In Pakistan Najoomi Baba in Pakist...
Uae-NO1 Pakistani Amil Baba Real Amil baba In Pakistan Najoomi Baba in Pakist...Uae-NO1 Pakistani Amil Baba Real Amil baba In Pakistan Najoomi Baba in Pakist...
Uae-NO1 Pakistani Amil Baba Real Amil baba In Pakistan Najoomi Baba in Pakist...
 
Liquidity Decisions in Financial management
Liquidity Decisions in Financial managementLiquidity Decisions in Financial management
Liquidity Decisions in Financial management
 
NO1 Certified kala jadu karne wale ka contact number kala jadu karne wale bab...
NO1 Certified kala jadu karne wale ka contact number kala jadu karne wale bab...NO1 Certified kala jadu karne wale ka contact number kala jadu karne wale bab...
NO1 Certified kala jadu karne wale ka contact number kala jadu karne wale bab...
 
Kempen ' UK DB Endgame Paper Apr 24 final3.pdf
Kempen ' UK DB Endgame Paper Apr 24 final3.pdfKempen ' UK DB Endgame Paper Apr 24 final3.pdf
Kempen ' UK DB Endgame Paper Apr 24 final3.pdf
 
Gender and caste discrimination in india
Gender and caste discrimination in indiaGender and caste discrimination in india
Gender and caste discrimination in india
 
NO1 Certified Black Magic Removal in Uk kala jadu Specialist kala jadu for Lo...
NO1 Certified Black Magic Removal in Uk kala jadu Specialist kala jadu for Lo...NO1 Certified Black Magic Removal in Uk kala jadu Specialist kala jadu for Lo...
NO1 Certified Black Magic Removal in Uk kala jadu Specialist kala jadu for Lo...
 
Uae-NO1 Kala Jadu specialist Expert in Pakistan kala ilam specialist Expert i...
Uae-NO1 Kala Jadu specialist Expert in Pakistan kala ilam specialist Expert i...Uae-NO1 Kala Jadu specialist Expert in Pakistan kala ilam specialist Expert i...
Uae-NO1 Kala Jadu specialist Expert in Pakistan kala ilam specialist Expert i...
 
Market Morning Updates for 16th April 2024
Market Morning Updates for 16th April 2024Market Morning Updates for 16th April 2024
Market Morning Updates for 16th April 2024
 

QNB - Daily market report

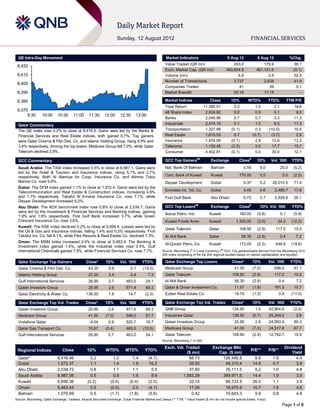
  • 1. QE Intra-Day Movement Market Indicators 9 Aug 12 8 Aug 12 %Chg. 8,420 Value Traded (QR mn) 243.0 175.9 38.1 Exch. Market Cap. (QR mn) 460,654.9 461,141.6 (0.1) 8,410 Volume (mn) 5.9 3.9 52.5 Number of Transactions 3,737 2,634 41.9 8,400 Companies Traded 41 39 5.1 8,390 Market Breadth 20:16 17:15 – 8,380 Market Indices Close 1D% WTD% YTD% TTM P/E Total Return 11,390.51 0.2 1.0 2.1 N/A 8,370 All Share Index 2,024.92 0.2 0.9 5.1 9.5 9:30 10:00 10:30 11:00 11:30 12:00 12:30 13:00 Banks 2,040.96 0.7 0.7 3.3 11.3 Qatar Commentary Industrials 2,474.19 0.1 1.0 8.5 11.3 The QE index rose 0.2% to close at 8,416.5. Gains were led by the Banks & Transportation 1,327.98 (0.1) 0.3 (10.0) 10.5 Financial Services and Real Estate indices, both gained 0.7%. Top gainers Real Estate 1,615.53 0.7 (0.7) (3.7) 2.8 were Qatar Cinema & Film Dist. Co. and Islamic Holding Group, rising 9.9% and Insurance 1,974.08 (0.1) 2.8 12.6 12.2 3.4% respectively. Among the top losers, Medicare Group fell 7.0%, while Qatar Telecoms 1,120.48 (2.3) 3.5 17.7 15.7 Telecom declined 2.9%. Consumer 4,402.81 (0.1) 0.0 30.0 12.1 GCC Commentary GCC Top Gainers## Exchange Close# 1D% Vol. ‘000 YTD% Saudi Arabia: The TASI index increased 0.5% to close at 6,987.1. Gains were Nat. Bank Of Bahrain Bahrain 0.55 9.0 25.0 (5.2) led by the Hotel & Tourism and Insurance indices, rising 5.1% and 2.7% respectively. Both Al Alamiya for Coop. Insurance Co. and Alinma Tokio Com. Bank of Kuwait Kuwait 770.00 5.5 5.0 (2.5) Marine Co. rose 9.8%. Deyaar Development Dubai 0.37 5.2 26,010.5 71.4 Dubai: The DFM index gained 1.1% to close at 1,572.4. Gains were led by the Telecommunication and Real Estate & Construction indices, increasing 4.6% Emirates Int. Tel. Co. Dubai 3.40 4.6 2,489.7 17.6 and 1.7% respectively. Takaful Al Emarat Insurance Co. rose 7.1%, while First Gulf Bank Abu Dhabi 9.75 3.7 2,929.8 26.1 Deyaar Development increased 5.2%. ## # Abu Dhabi: The ADX benchmark index rose 0.8% to close at 2,534.7. Gains GCC Top Losers Exchange Close 1D% Vol. ‘000 YTD% were led by the Investment & Financial Services and Banking indices, gaining Ikarus Petro. Ind. Kuwait 160.00 (5.9) 0.1 (5.9) 1.9% and 1.6% respectively. First Gulf Bank increased 3.7%, while Green Crescent Insurance Co. rose 3.6%. Kuwait Foods Amer. Kuwait 1,300.00 (3.0) 24.0 (12.2) Kuwait: The KSE index declined 0.2% to close at 5,699.4. Losses were led by Qatar Telecom Qatar 108.90 (2.9) 117.0 15.5 the Oil & Gas and Insurance indices, falling 1.4% and 0.5% respectively. First Takaful Ins. Co. fell 8.1%, while Flex Resorts & Real Estate Co. declined 7.3%. Al Ahli Bank Qatar 56.30 (2.9) 0.4 7.2 Oman: The MSM index increased 0.5% to close at 5,463.4. The Banking & Al-Qurain Petro. Co. Kuwait 172.00 (2.3) 449.9 (19.6) Investment index gained 1.5%, while the Industrial index rose 0.4%. Gulf International Chemicals gained 7.9%, while Financial Services Co. rose 7.7%. Source: Bloomberg (# in Local Currency) (## GCC Top gainers/losers derived from the Bloomberg GCC 200 Index comprising of the top 200 regional equities based on market capitalization and liquidity) Qatar Exchange Top Gainers Close* 1D% Vol. ‘000 YTD% Qatar Exchange Top Losers Close* 1D% Vol. ‘000 YTD% Qatar Cinema & Film Dist. Co. 63.20 9.9 0.1 (15.0) Medicare Group 41.00 (7.0) 596.0 67.7 Islamic Holding Group 27.20 3.4 2.4 7.3 Qatar Telecom 108.90 (2.9) 117.0 15.5 Gulf International Services 26.90 2.7 463.0 24.1 Al Ahli Bank 56.30 (2.9) 0.4 7.2 Qatari Investors Group 25.95 2.6 971.4 69.3 Qatar & Oman Investment Co. 11.57 (1.9) 191.5 15.7 Qatar Electricity & Water Co. 136.50 1.6 14.7 (2.2) Ezdan Real Estate Co. 19.75 (1.3) 0.8 (11.0) Qatar Exchange Top Vol. Trades Close* 1D% Vol. ‘000 YTD% Qatar Exchange Top Val. Trades Close* 1D% Val. ‘000 YTD% Qatari Investors Group 25.95 2.6 971.4 69.3 QNB Group 134.90 1.4 42,664.9 (2.4) Medicare Group 41.00 (7.0) 596.0 67.7 Industries Qatar 136.50 (0.7) 25,249.0 2.6 Vodafone Qatar 9.04 0.9 520.7 19.7 Qatari Investors Group 25.95 2.6 24,993.9 69.3 Qatar Gas Transport Co. 15.67 (0.4) 465.5 (10.5) Medicare Group 41.00 (7.0) 24,517.8 67.7 Gulf International Services 26.90 2.7 463.0 24.1 Qatar Telecom 108.90 (2.9) 12,792.7 15.5 Source: Bloomberg (* in QR) Exch. Val. Traded Exchange Mkt. Dividend Regional Indices Close 1D% WTD% MTD% YTD% P/E** P/B** ($ mn) Cap. ($ mn) Yield Qatar* 8,416.46 0.2 1.0 1.4 (4.1) 66.73 126,495.8 8.9 1.6 4.4 Dubai 1,572.37 1.1 1.4 1.9 16.2 35.50 49,315.4 14.9 0.7 3.9 Abu Dhabi 2,534.72 0.8 1.1 1.1 5.5 37.60 76,111.5 9.2 1.0 4.8 Saudi Arabia 6,987.06 0.5 0.5 1.6 8.9 1,583.29 369,971.6 14.4 1.9 3.5 Kuwait 5,699.36 (0.2) (0.4) (0.4) (2.0) 32.14 98,733.5 26.5 1.1 3.5 Oman 5,463.43 0.5 (0.0) 2.0 (4.1) 17.06 18,975.9 10.7 1.6 4.6 Bahrain 1,079.69 0.5 (1.7) (1.8) (5.6) 0.42 19,643.3 9.8 0.8 4.6 Source: Bloomberg, Qatar Exchange, Tadawul, Muscat Securities Exchange, Dubai Financial Market and Zawya (** TTM; * Value traded ($ mn) do not include special trades, if any) Page 1 of 6
  • 2. Qatar Market Commentary  The QE index rose 0.2% to close at 8,416.5. The Banks & Overall Activity Buy %* Sell %* Net (QR) Financial Services and Real Estate indices were the major contributors to the gains. The index increased on the back of Qatari 66.91% 64.50% 5,851,794.99 buying support from Qatari shareholders despite selling pressure Non-Qatari 33.08% 35.50% (5,851,794.99) from non-Qatari shareholders. Source: Qatar Exchange (* as a % of traded value)  Qatar Cinema & Film Dist. Co. and Islamic Holding Group were the top gainers, increasing 9.9% and 3.4% respectively. Among the top losers, Medicare Group fell 7.0%, while Qatar Telecom declined 2.9%.  Volume of shares traded on Thursday increased by 52.5% to 5.9mn from 3.9mn on Wednesday. Further, as compared to the 30-day moving average of 5.0mn, volume for the day was 18.2% higher. Qatari Investors Group and Medicare Group were the most active stocks, contributing 16.4% and 10.1% to the total volume respectively. Earnings Ratings Updates Company Agency Market Type* Old Rating New Rating Rating Change Outlook Outlook Change LT IDR#/ ST IDR/ VR/ SR/ SR Qatar National Floor/ QNB Finance Limited A+/ F1/ a/ 1/ A+/ F1/ a/ 1/ Fitch Qatar – Stable – Bank (QNB) Senior Unsecured Notes A+/ A+ A+/ A+ (guaranteed by QNB) Bank Dhofar LT FC IDR#/ ST FC IDR/ VR##/ BBB+/ F2/ BBB+/ F2/ (BD) Fitch Oman SR/ SR Floor bb+/ 2/ BBB+ bb/ 2/ BBB+  Stable – LT FC IDR#/ STFC IDR/ LT LC BBB+/ F2/ BBB+/ F2/ Ahli Bank Fitch Oman IDR#/ ST LC IDR/ VR/ SR/ SR BBB+/ F2/ BBB+/ F2/ – Stable – Floor bb+/ 2/ BBB+ bb+/ 2/ BBB+ # ## Source: News reports (* „ST‟ – Short Term, „LT‟ – Long Term, „VR‟ - Viability Rating, „SR‟ – Support Rating, „IDR‟ - Issuer Default Rating, „FC‟- Foreign Currency, LC - Local Currency ; Outlook Stable, Downgraded ) Earnings Releases Revenue % Change Operating Profit % Change Net Profit (mn) % Change Company Market Currency (mn) 2Q12 YoY (mn) 2Q12 YoY 2Q12 YoY SHUAA Capital (SHUAA) Dubai AED 22.2 (37.8%) – – (15.9) NA Al Buhaira National Insurance Abu Dhabi AED 78.2 (20.1%) – – 17.1 -43.8% Co. (ABNIC) Union Insurance Co. (UNION) Abu Dhabi AED 35.2 53.3% – – (24.3) NA Alain Ahlia Insurance Co. Abu Dhabi AED 44.8 (2.0%) – – 15.4 -36.2% (ALAIN) United Insurance Co. (UIC) Abu Dhabi AED 20.9 49.4% – – (0.7) NA Abu Dhabi National Takaful Co. Abu Dhabi AED 19.8 (1.6%) – – 6.2 2.2% (TAKAFUL) Fujairah Cement Industries Co. Abu Dhabi AED 151.1 8.0% – – 15.1 NA (FCI) Al Dar Properties Co. (ALDAR) Abu Dhabi AED 4,631.0 497.0% – – 417.9 228.0% United Real Estate Co. (URC) # Kuwait KD – – 16.4 223.0% Salalah Port Services Co. - Oman OMR 27.9 9.4% – – 3.2 274.6% (SPSI) Bahrain Tourism Co. (BTC) Bahrain BHD 1.3 63.6% – – 0.2 NM Securities and Investment Co. Bahrain BHD – – – – -0.3 NA (SICO) # # Source: Company data, DFM, ADX, Bahrain bourse ( Data for 1H2012) Global Economic Data Date Market Source Indicator Period Actual Consensus Previous 08/09 US The Labor Department Initial Jobless Claims 4-August 361K 370K 367K 08/09 US The Labor Department Continuing Claims 28-July 3,332K 3,275K 3,279K 08/09 US Bloomberg Bloomberg Consumer Comfort 5- August -41.9 – -39.7 08/09 US The Commerce Dept. Wholesale Inventories June -0.20% 0.30% 0.00% 08/10 US The Labor Department Import Price Index (MoM) July -0.60% 0.20% -2.40% 08/10 US The Labor Department Import Price Index (YoY) July -3.20% -2.50% -2.50% 08/10 Germany Destasis Consumer Price Index (MoM) July 0.40% 0.40% -0.10% Page 2 of 6
  • 3. 08/10 Germany Destasis Consumer Price Index (YoY) Jul y 1.70% 1.70% 1.70% 08/10 France Insee Industrial Production (MoM) June 0.00% 0.10% -2.10% 08/10 France Insee Industrial Production (YoY) June -2.30% -1.80% -3.70% 08/10 France Insee Manufacturing Production (MoM) June 0.10% 0.00% -1.10% 08/10 France Insee Manufacturing Production (YoY) June -2.60% -2.10% -4.60% 08/10 Italy Istat CPI - EU Harmonized (MoM) July -1.70% -1.60% 0.20% 08/10 Italy Istat CPI - EU Harmonized (YoY) July 3.60% 3.70% 3.60% 08/09 China National Bureau of Stat. Consumer Price Index (YoY) July 1.80% 1.70% 2.20% 08/09 China National Bureau of Stat. Producer Price Index (YoY) July -2.90% -2.50% -2.10% 08/09 China National Bureau of Stat. Industrial Production (YoY) July 9.20% 9.70% 9.50% Ministry of Economy, 08/10 Japan Industrial Production (MoM) June 0.40% – -3.40% Trade and Industry Ministry of Economy, 08/10 Japan Industrial Production (YoY) June -1.50% – 6.00% Trade and Industry Source: Bloomberg (s.a. = seasonally adjusted; n.s.a. = non-seasonally adjusted; w.d.a. = working day adjusted) News Qatar endorsed as the fiber optic broadband infrastructure provider for Qatar. (AME Info)  Dlala Brokerage and Investment Holding Company net  Salwa Road project on track to meet deadline – According to profit declines – Dlala Brokerage and Investment Holding a report from an Arabic daily, most of the road networks of Company reported a net profit of QR15mn in 2Q2012, indicating Salwa road projects have reached at least 70% completion and a QoQ decline of 2.1%. Net brokerage and commission income will meet the project deadline in the middle of 2013. (Peninsula declined 8.4% QoQ to QR7.8mn. Total assets at the end of June Qatar) 30 stood at QR575mn, reflecting an YTD decrease of 20.2%. (QE) International  Mannai Corporation net profit up – Mannai Corporation reported a net profit of QR93.3mn in 2Q2012, reflecting QoQ  IEA sees oil demand growth slowdown on weaker economy – The International Energy Agency cut global oil demand increase of 23.9%. Revenue increased by 129.9% QoQ to QR1,416.6mn. Total assets at the end of June 30 stood at forecasts for this year and next, estimating that growth will slow QR6,487.8mn, indicating YTD increased of 124.1%. Inventories in 2013 amid weaker expectations for the economy and the rose by 197.3% YTD to QR2,224.5mn. (QE) restart of nuclear plants in Japan. IEA estimates that growth in world oil use will decelerate to 800,000 barrels a day, or 0.9%, in  Qatar National Cement Company to float a global general 2013 from 900,000 a day, or 1%, this year. IEA mentioned that tender for construction of new cement plant at Umm Bab – global demand will average 90.5mn bpd next year, which is Qatar National Cement Company has decided to float a global 400,000 bpd less than estimated last month, as a result of general tender for the construction of New Cement Plant at revisions to data since 2010. (Bloomberg) Umm Bab for a capacity of 5,000 TPD Clinker as the first option  OPEC keeps its forecast unchanged for growth in world oil and 7,000 TPD clinker as a second option. Furthermore, the demand – Organization of the Petroleum Exporting Countries company also said the general tender for the consultancy of the left its forecast for growth in world oil demand unchanged from project is on the stage of receiving quotations. (QE) its estimate last month. OPEC expects demand to expand by  Mawashi sells 30,000 animals at subsidized prices – 810,000 barrels per day (bpd) next year. OPEC expects world Mawashi has sold 30,000 animals at subsidized prices, in economic growth to slow to 3.2% next year from 3.3% in 2012, collaboration with Qatar Development Bank. In an attempt to hindered by a slightly slower expansion in US and China, and cater to further demand and in collaboration with the Ministry of weakness in the Euro zone. Furthermore, OPEC trimmed the Business and Trade, Mawashi has further increased its supply demand forecast for its own oil this year and in 2013 by 80,000 of livestock offered at a subsidized price to cover the rest of the bpd and 100,000 bpd, respectively, due to higher supply from holy month of Ramadan. Mawashi has also increased its points producers outside OPEC countries. (Reuters) of sale to include 15 branches in Qatar with slaughterhouses in  OECD Chief backs ECB bond-buying policy – The Head of Doha, Al Rayyan, Meaizer, Al Khor and Shamal. (Gulf- the OECD Angel Gurria said he supports the European Central Times.com) Bank‟s (ECB) plan to buy sovereign bonds of Euro zone nations.  QSTec and Gasal sign long term supply agreement for Gurria stated that countries like Spain or Greece must hydrogen and nitrogen – Qatar Solar Technologies (QSTec) implement strict reforms to become more competitive and make and Gasal have signed a hydrogen and nitrogen long term savings. He also said he wanted Greece to stay in the euro zone supply agreement. Under the agreement, GASAL will invest into but called on Athens to respect conditions imposed by the EU multiple high purity Hydrogen production units and extend and and the International Monetary Fund in return for bailout connect QSTec to its industrial gas pipeline system in Ras packages which are keeping its economy afloat. (Gulf- Laffan Industrial City (RLIC) for Nitrogen. The new units will be Times.com) designed and built by Air Liquide Engineering and will be  FSA: Libor reform risks invalidating mortgages, financial commissioned and operated by GASAL through an extension of contracts – UK‟s Financial Services Authority Managing its pipeline system in RLIC during 2013. (AME Info) Director Martin Wheatley said that material changes to the way  Q.NBN bags a 25-year license to operate fiber optic Libor is calculated risks invalidating millions of financial broadband network in Qatar – Qatar National Broadband contracts, covering products ranging from mortgages to Network (Q.NBN) has received a 25-year license to provide fiber derivatives. He said there needs to be certainty on what would optic broadband throughout Qatar. Q.NBN has been officially happen to banks and investors if another benchmark is adopted. Page 3 of 6
  • 4. He also mentioned that any migration to new benchmarks would  Saudi non-oil exports reaches SR14.48bn in June – require a carefully planned and managed transition in order to According to a report by the Central Department of Statistics limit disruption to the huge volume of outstanding contracts that and Information, value of Saudi non-oil exports stood at reference Libor. (Bloomberg) SR14.48bn for June in 2012, indicating a YoY decline of 7.7%.  Fitch uncertain if Spain MOU will be final reform for sector – Exports of petrochemical products accounted for 36.7% of total Fitch Ratings said it remains "cautious" on whether Spanish non-oil exports, while plastic products accounted for 29.7% and banks will require a further bailout beyond the $123bn already foodstuffs 7.7%. China topped the list of countries receiving pledged, given the weak economy and high costs of borrowing Saudi non-oil exports, accounting for 12.92% of total exports, that the country faces. The ratings firm said the Memorandum of followed by Singapore and the UAE, 10.15% and 9.28% Understanding on bank recapitalization for Spanish banks is respectively. (GulfBase.com) meant to be the final reform required by the sector. (WSJ)  Sino-Saudi Gas to delay Empty Quarter drilling – Sino-Saudi  Greece to sell €3.125bn 3-month treasury bills – Greece will Gas, a JV between China-based Sinopec and Saudi Aramco, try to raise €3.125bn in an auction of three-month treasury bills will reportedly delay drilling in the Kingdom‟s Empty Quarter as next week to try to avoid a looming cash crunch. A finance the evaluation of the well is still ongoing. In this regard a ministry official said the country faces redeeming a €3.2bn bond Sinopec executive said no decision has been made on the held by the European Central Bank on August 20. (Peninsula exploration well yet as the company was still evaluating "the Qatar) economic and technical aspects" of the well. (GulfBase.com)  SABIC to distribute SR2 per share dividends for 1H2012 – Regional Saudi Basic Industries Corporation (SABIC) approved to distribute a dividend of SR2 per share for 1H2012. (Tadawul)  Bank of Ceylon raises $190m in Mashreqbank-Led Syndicated Loan – Bank of Ceylon (BoC) signed an agreement  NCB pioneers Shari’ah-compliant airport financing – for a syndicated loan facility of $190mn. Mashreqbank acted as National Commercial Bank (NCB) said it is the Islamic the Co-ordinator, Mandated Lead Arranger (MLA) and structuring bank of Tibah Consortium for Madinah International Bookrunner along with Commercial Bank of Qatar, Doha Bank Airport, and providing the bulk of financing. (GulfBase.com) and Indian Bank, Singapore Branch (each as MLA and  Business confidence in UAE tops globally – According to Bookrunner) and Bank Muscat (as MLA). A total of 13 banks Global Economic Conditions Survey (GECS), UAE leads the participated in the oversubscribed syndicated deal. This was world in business confidence and stands alone in positive originally planned for $100mn but upsized due to heavy territory in the global economic survey index, leaving behind US, demand. (Bloomberg) UK, Hong Kong, Singapore and others on negative side of the  IMF: Saudi net foreign assets to rise sharply – International index. The GECS Confidence Index across the region and in Monetary Fund (IMF) said net foreign assets of the Saudi central selected markets revealed that the UAE has score of 7.9, while bank are set to rise sharply by the end of 2012, boosted by the rest of the regions and markets covered under the index Kingdom‟s buoyant oil revenues. IMF said that higher oil recorded negative scoring. (GulfBase.com) revenues have strengthened fiscal and external balances and  Dana Gas and Crescent Petroleum invests $963mn in have boosted social spending and savings for future Kurdish region – Dana Gas and its biggest shareholder and generations. The IMF projected that the Saudi central bank‟s net partner, Crescent Petroleum, invested $963mn in the Kurdish foreign assets will rise to $701.8bn by the end of 2012, up 19% region of Iraq by the end of June. Moreover, Dana Gas and from the last-reported figure of $591bn reported by the Saudi Crescent Petroleum said they are in discussions with the Arabian Monetary Agency (SAMA) at the end of June this year. Kurdish government for the next phase of development and (Gulf-Times.Com) expansion. (GulfBase.com)  Saudi telecom firms most competitive in Arab world –  ADIB starts community banking – Abu Dhabi Islamic Bank According to Arab Advisors Group‟s Cellular Competition has launched ADIB Community Banking to address the banking Intensity Index 2012, Saudi Arabia with a score of 74.56%, has requirements of non-profit organisations as well as government the most competitive telecommunications sector in the Arab and private companies focused on serving the UAE community. world. In the Gulf, Oman was the second most competitive at (GulfBase.com) 67.01%, followed by Bahrain (61.01%) and Kuwait (52.58%). The index showed that UAE (49.01%) and Qatar (47.14%) were  Kuwait Finance House reports net profit of KD42.1mn – the Gulf‟s least competitive markets, while Libya was the worst Kuwait Finance House reported a net profit of KD42.1mn for ranked country in the Arab world (32.68%). However it also 1H2012. Earnings per share stood at 14.8 fils. Total revenues showed that the UAE was one of only four markets whose score increased by 3.7% YoY to KD394.4mn. Total assets increased improved compared to the previous ranking in April. to KD14bn, while deposits increased to KD8.9bn. (AME Info) (GulfBase.com)  Number of fixed line users rises marginally in Oman –  Saudi cuts oil output to 9.8mn bpd in July – Saudi Arabia According to Statistics issued by National Center for Statistics pumped 9.8mn barrels per day (bpd) of crude oil in July, cutting and Data (NCSD), subscribers of the fixed phone service in output by 300,000 bpd from June. Saudi Arabia supplied 9.7mn Oman stood at 295,946 at the end of June 2012, reflecting YTD bpd to the market in July, while 100,000 bpd of the output was increase of 3%.The subscribers of the billed fixed phone service stored. (GulfBase.com) stood at 219,903 at the end of June 2012 against 215,193 subscribers at the end of 2011. Subscribers of pre-paid fixed  Saudi Arabia’s foreign assets surge by SR205b in 1H2012 – phone service (Sahl) stood at 25,932 against 26,345 in 2011. According to Saudi Arabia Monetary Agency (SAMA), Saudi (GulfBase.com) Arabia‟s foreign assets increased by SR205bn to SR2,263bn in 1H2012. The increase was mostly in deposits with banks  Bahrain Islamic Bank reports net loss – Bahrain Islamic Bank abroad, which soared to SR522bn from SR414bn. Investment in reported a net loss of BHD16.4mn in 2Q2012 as compared to foreign securities swelled to nearly SR1,523bn from SR1,427bn net profit of BHD1.7mn in 2Q2011. Loss per share stood at in the same period. (GulfBase.com) 17.56 fils as compared to earnings per share of 1.8fils in Page 4 of 6
  • 5. 2Q2011. Income from Islamic finances declined by 24.7% YoY to BHD6.7mn, while total income decreased by 18.3% YoY to BHD6.3mn. Total assets at the end of June 30 stood at BHD815.2mn, indicating YTD decrease of 2.8%. Murabaha receivables rose by 9.6% YTD to BHD221.4mn, while customer deposits rose by 9.2% YTD to BHD92.9mn. (Bahrain Bourse)  TAIB Bank net loss increases – TAIB Bank reported a net loss of $7.7mn in 2Q2012, indicating YoY increase in net loss of 195.2%. Loss per share stood at $0.07 as compared to $0.02 in 2Q2011. Interest and similar income declined by 70.2% YoY to $0.7mn. Total assets at the end of June 30 stood at $150.8mn, indicating YTD decline of 22.8%. Loans and advances rose by 0.9% YTD to $16mn, while Deposits from customers decreased by 20.8% YTD to $101.5mn. (Bahrain Bourse) Page 5 of 6
  • 6. Rebased Performance Daily Index Performance 140.0 1.2% 1.1% 130.0 0.8% 0.8% 120.0 120.9 0.5% 0.5% 0.5% 110.0 0.4% 0.2% 107.9 100.0 100.3 106.0 0.0% 90.0 98.2 (0.4%) (0.2%) 80.0 Saudi Arabia Kuwait Bahrain Abu Dhabi Dubai Qatar Oman Jan-10 May-10 Sep-10 Jan-11 May-11 Sep-11 Jan-12 May-12 4 QE Index S&P Pan Arab S&P GCC Source: Bloomberg Source: Bloomberg Asset/Currency Performance Close ($) 1D% WTD% YTD% Global Indices Performance Close 1D% WTD% YTD% Gold 1,620.20 0.2 1.0 3.6 DJ Industrial 13,207.95 0.3 0.9 8.1 Silver 28.12 (0.1) 1.2 1.0 S&P 500 1,405.87 0.2 1.1 11.8 Crude Oil (Brent) 114.42 (0.3) 3.7 5.3 NASDAQ 100 3,020.86 0.1 1.8 16.0 Euro 1.23 (0.1) (0.8) (5.2) DAX 6,944.56 (0.3) 1.1 17.7 Yen 78.28 (0.4) (0.2) 1.8 FTSE 100 5,847.11 (0.1) 1.0 4.9 GBP 1.57 0.3 0.3 0.9 CAC 40 3,435.62 (0.6) 1.8 8.7 CHF 1.02 (0.1) (0.7) (3.9) Nikkei 8,891.44 (1.0) 3.9 5.2 AUD 1.06 (0.0) 0.1 3.6 Shanghai 2,168.81 (0.2) 1.7 (1.4) USD Index 82.55 (0.1) 0.2 3.0 BSE Sensex 17,557.74 (0.0) 2.1 13.6 RUB 31.81 0.1 (0.5) (1.0) Bovespa 59,280.93 0.8 3.5 4.5 BRL 0.50 (0.2) 0.6 (7.6) RTS 1,427.33 (1.4) 2.1 3.3 Source: Bloomberg Source: Bloomberg Contacts Ahmed M. Shehada Keith Whitney Saugata Sarkar Sahbi Kasraoui Head of Trading Head of Sales Head of Research Manager - HNWI Tel: (+974) 4476 6535 Tel: (+974) 4476 6533 Tel: (+974) 4476 6534 Tel: (+974) 4476 6544 ahmed.shehada@qnbfs.com.qa keith.whitney@qnbfs.com.qa saugata.sarkar@qnbfs.com.qa sahbi.alkasraoui@qnbfs.com.qa QNB Financial Services SPC Contact Center: (+974) 4476 6666 PO Box 24025 Doha, Qatar DISCLAIMER: This publication has been prepared by QNB Financial Services SPC (“QNBFS”) a wholly-owned subsidiary of Qatar National Bank (“QNB”). QNBFS is regulated by the Qatar Financial Markets Authority and the Qatar Exchange; QNB is regulated by the Qatar Central Bank. This publication expresses the views and opinions of QNBFS at a given time only. It is not an offer, promotion or recommendation to buy or sell securities or other investments, nor is it intended to constitute legal, tax, accounting, or financial advice. We therefore strongly advise potential investors to seek independent professional advice before making any investment decision. Although the information in this report has been obtained from sources that QNBFS believes to be reliable, we have not independently verified such information and it may not be accurate or complete. While this publication has been prepared with the utmost degree of care by our analysts, QNBFS does not make any representations or warranties as to the accuracy and completeness of the information it may contain, and declines any liability in that respect. QNBFS reserves the right to amend the views and opinions expressed in this publication at any time. It may also express viewpoints or make investment decisions that differ significantly from, or even contradict, the views and opinions included in this report. COPYRIGHT: No part of this document may be reproduced without the explicit written permission of QNBFS. Page 6 of 6