Weekly market report
•
0 recomendaciones•370 vistas

The QE Index declined 4.05% over the trading week to close at 12,453.76 points. Trading value decreased 22.08% to QR3.2 billion, while volume fell 33.29% to 66.7 million shares. Ooredoo was the worst performing stock, declining 11.80%, while Qatar Cinema & Film Distribution saw the largest gain of 21.52%. Foreign institutions were net sellers of QR132.6 million for the week.

Recomendados
Más contenido relacionado
La actualidad más candente
La actualidad más candente (20)
Similar a Weekly market report
Similar a Weekly market report (20)
Más de QNB Group
Más de QNB Group (20)
Último
Último (20)
Weekly market report
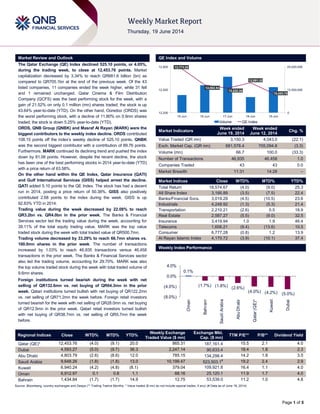
- 1. Page 1 of 5 Market Review and Outlook QE Index and Volume The Qatar Exchange (QE) Index declined 525.10 points, or 4.05%, during the trading week, to close at 12,453.76 points. Market capitalization decreased by 3.34% to reach QR681.6 billion (bn) as compared to QR705.1bn at the end of the previous week. Of the 43 listed companies, 11 companies ended the week higher, while 31 fell and 1 remained unchanged. Qatar Cinema & Film Distribution Company (QCFS) was the best performing stock for the week, with a gain of 21.52% on only 0.1 million (mn) shares traded; the stock is up 43.64% year-to-date (YTD). On the other hand, Ooredoo (ORDS) was the worst performing stock, with a decline of 11.80% on 0.9mn shares traded; the stock is down 5.25% year-to-date (YTD). ORDS, QNB Group (QNBK) and Masraf Al Rayan (MARK) were the biggest contributors to the weekly index decline. ORDS contributed 108.15 points off the index’s weekly decline of 525.10 points. QNBK was the second biggest contributor with a contribution of 89.76 points. Furthermore, MARK continued its declining trend and pushed the index down by 81.06 points. However, despite the recent decline, the stock has been one of the best performing stocks in 2014 year-to-date (YTD) with a price return of 63.58%. On the other hand within the QE Index, Qatar Insurance (QATI) and Gulf International Services (GISS) helped arrest the decline. QATI added 5.10 points to the QE Index. The stock has had a decent run in 2014, posting a price return of 50.38%. GISS also positively contributed 2.68 points to the index during the week. GISS is up 92.83% YTD in 2014. Trading value during the week decreased by 22.08% to reach QR3.2bn vs. QR4.0bn in the prior week. The Banks & Financial Services sector led the trading value during the week, accounting for 39.11% of the total equity trading value. MARK was the top value traded stock during the week with total traded value of QR500.7mn. Trading volume decreased by 33.29% to reach 66.7mn shares vs. 100.0mn shares in the prior week. The number of transactions increased by 1.03% to reach 46,935 transactions versus 46,458 transactions in the prior week. The Banks & Financial Services sector also led the trading volume, accounting for 29.70%. MARK was also the top volume traded stock during the week with total traded volume of 9.6mn shares. Foreign institutions turned bearish during the week with net selling of QR132.6mn vs. net buying of QR64.3mn in the prior week. Qatari institutions turned bullish with net buying of QR122.2mn vs. net selling of QR71.2mn the week before. Foreign retail investors turned bearish for the week with net selling of QR28.0mn vs. net buying of QR12.5mn in the prior week. Qatari retail investors turned bullish with net buying of QR38.7mn vs. net selling of QR5.7mn the week before. Market Indicators Week ended June 19, 2014 Week ended June 12, 2014 Chg. % Value Traded (QR mn) 3,150.3 4,043.0 (22.1) Exch. Market Cap. (QR mn) 681,578.4 705,094.8 (3.3) Volume (mn) 66.7 100.0 (33.3) Number of Transactions 46,935 46,458 1.0 Companies Traded 43 43 0.0 Market Breadth 11:31 14:28 – Market Indices Close WTD% MTD% YTD% Total Return 18,574.67 (4.0) (9.0) 25.3 All Share Index 3,166.89 (3.5) (7.5) 22.4 Banks/Financial Svcs. 3,019.29 (4.5) (10.5) 23.6 Industrials 4,248.92 (1.3) (5.3) 21.4 Transportation 2,210.21 (2.6) 0.5 18.9 Real Estate 2,587.27 (5.5) (9.0) 32.5 Insurance 3,419.94 1.0 1.9 46.4 Telecoms 1,606.21 (9.4) (13.6) 10.5 Consumer 6,777.28 (0.8) 1.2 13.9 Al Rayan Islamic Index 4,170.72 (3.9) (10.1) 37.4 Market Indices Weekly Index Performance Regional Indices Close WTD% MTD% YTD% Weekly Exchange Traded Value ($ mn) Exchange Mkt. Cap. ($ mn) TTM P/E** P/B** Dividend Yield Qatar (QE)* 12,453.76 (4.0) (9.1) 20.0 865.31 187,161.4 15.5 2.1 4.0 Dubai 4,593.27 (5.0) (9.7) 36.3 2,247.14 90,633.4 18.4 1.8 2.3 Abu Dhabi 4,803.79 (2.6) (8.6) 12.0 785.15 134,298.4 14.2 1.8 3.5 Saudi Arabia 9,648.26 (1.8) (1.8) 13.0 10,199.47 523,503.1# 19.2 2.4 2.9 Kuwait 6,940.24 (4.2) (4.8) (8.1) 379.04 109,921.8 16.4 1.1 4.0 Oman 6,912.97 0.1 0.8 1.1 68.16 25,120.1 11.9 1.7 4.0 Bahrain 1,434.84 (1.7) (1.7) 14.9 12.75 53,539.0 11.2 1.0 4.8 Source: Bloomberg, country exchanges and Zawya (** Trailing Twelve Months; * Value traded ($ mn) do not include special trades, if any) (# Data as of June 18, 2014) 12,773.20 12,562.54 12,520.36 12,591.32 12,453.76 0 12,500,000 25,000,000 12,200 12,500 12,800 15-Jun 16-Jun 17-Jun 18-Jun 19-Jun Volume QE Index 0.1% (1.7%) (1.8%) (2.6%) (4.0%) (4.2%) (5.0%) (8.0%) (4.0%) 0.0% 4.0% Oman Bahrain SaudiArabia AbuDhabi Qatar(QE)* Kuwait Dubai
- 2. Page 2 of 5 News Economic News QNBFS: Qatar loan growth outpaces deposits in May – QNB Financial Services (QNBFS) has said that loan growth in Qatar outpaced deposits gains in May due to a pick-up in credit off-take from the international segment. After posting a growth of 0.6% MoM in April 2014, loans grew by 0.4% MoM in May 2014. Deposits continued their gradual growth (+0.2% MoM) and are up 6.8% YTD as compared to a 4.2% YTD growth in the loan book. Hence, the banking sector’s loans-to-deposits ratio (LDR) stood at 103% at the end of May as compared to 105% at end-2013. Going forward, QNBFS expects public sector and large corporate loan growth to be the primary drivers of the overall loan book in 2014, followed by SMEs and consumer lending. QNBFS said its view is based on the expected uptick in project mobilizations over the coming months. The private sector led deposit growth in May 2014, while the public sector deposits declined by 0.9% MoM (+2.4% YTD 2014). Delving into segment details, the government institution segment (representing 54% of public sector deposits) grew by 0.1% MoM (+2.7% YTD 2014). Furthermore, the semi- government institution segment posted 3.9% MoM growth (down 25.6% YTD 2014). On the other hand, the government segment declined by 4.1% MoM (+17.1% YTD). Meanwhile, private sector deposits grew by 0.3% MoM (+10.8% YTD 2014). On the private sector front, the companies and institutions’ segment grew by 1.5% MoM (+12.1% YTD 2014), while the consumer segment declined 0.8% MoM (+9.7% YTD 2014). The overall loan book performance improved by 0.4% MoM in May 2014. International credit was the primary driver for the MoM growth, increasing by 12.2% MoM (+22.1% YTD 2014). The total domestic public sector loans declined by 2.1% MoM and 0.8% YTD. The government segment’s loan book declined by 7.8% MoM (+9.4% YTD 2014). Furthermore, the semi-government institution segment declined by 3.6% MoM and is now down 8.4% YTD. However, the government institution segment (representing 62% of public sector loans) grew by 0.7% MoM, but it is still down 3.0% YTD. Private sector loans gained by 0.6% MoM and is up 5.6% YTD. (Gulf- Times.com) QCB looks to be flexible with govt bond issues – The Qatar Central Bank (QCB) Governor HE Sheikh Abdullah bin Saud al Thani has said the QCB will be more flexible in planning its future auctions of government bonds, adjusting the timing and characteristics of these issues based on market conditions and its policy stance. In March 2013, Qatar had launched quarterly government bond sales to expand the central bank’s policy arsenal and help banks manage liquidity. Since then, the QCB has usually issued QR3bn ($824mn) worth of conventional bonds and QR1bn of Sukuk every quarter with maturities of three and five years. In the last two auctions, however, the central bank varied the pattern, selling QR4bn of solely conventional bonds after offering the same amount of purely Islamic bonds in April. Further, in the last bond auction this week, the QCB included a new seven-year tranche, which is a step toward building a longer yield curve in the riyal- denominated bond market. (Gulf-Times.com) Market & Corporate News Shura Council for taxing foreign stock investors – The Advisory Council is recommending taxing foreign stock investors on capital gains and income earned from cash dividends and interest on bonds, treasury bills and debentures. The Council rejected a proposal by the government to exempt foreign investors in the local equity market from paying the above tax. The State Cabinet had, on February 19, 2014, approved a draft law that sought to allow foreign stock investors, including individuals, corporates and institutions, the above exemption. The Cabinet had argued that the exemption would help increase the inflow of foreign funds into the Qatari equity market from individuals and institutions such as hedge, pension, investment and mutual funds. After it received the draft law from the State Cabinet, the Council referred it to its internal Financial and Economic Affairs Committee for review. The Committee approved the draft and sent it back to the Council, which took it up for a debate at its session recently. The Council objected to the Committee’s approval of the draft and asked it to take a fresh look at it and amend three articles. (Peninsula Qatar) GDI bags QR1.28bn QP deal for Dukhan rig – Gulf Drilling International (GDI) – a subsidiary of Gulf International Services – has bagged a QR1.28bn five-year contract from Qatar Petroleum (QP) to provide offshore drilling rig services. The new rig ‘Dukhan’ will be delivered from Keppel Fels Shipyard in Singapore and would start work for QP during 4Q2014. The Dukhan rig was custom built for GDI with features that enable it to work anywhere in Qatar. It is a high specification hi-tech rig, which can accommodate 150 people. Meanwhile, GDI, with an issued share capital of QR739.6mn, is aiming to enhance its share of the offshore market to 50% by 2015. (Gulf-Times.com) CBQK launches $750mn bond; pricing at tight end – The Commercial Bank of Qatar (CBQK) has launched a $750mn, five-year bond offer that will be priced later, expected to be priced at the tight end of guidance due to strong investor demand. The transaction is set to be priced at a spread of 117 basis points over mid-swaps, which is at the tight end of a revised range of 117-120 bps over the same benchmark given earlier. Pricing was revised twice, with the initial guidance given in the area of 135 basis points, before it was changed to 120- 125 basis points over the benchmark. Investor orders worth more than $3bn have been placed for the transaction. Bank of America-Merrill Lynch, HSBC and Morgan Stanley are arranging the bond sale. (Reuters) Key project to provide logistics facility to private sector – The government has announced a key project that will provide the much-needed storage facility to small & medium-sized companies in the country’s private sector. Under this project, three vast stretches of land outside the city ranging between 498,000-517,000 square meters have been chosen to establish warehouses and other logistic facilities in Qatar. These land plots have been chosen in cooperation with the Ministry of Municipality & Urban Planning. Besides the open storage places, provision to keep chilled items will be made in this facility. We believe Gulf Warehousing (GWCS) could benefit from these plans. (Gulf-Times.com) QIB-UK offers property investment opportunities in London – Qatar Islamic Bank’s (QIBK) wholly owned subsidiary, QIB-UK, is offering unique real estate investment opportunities for premium clients, who seek to purchase properties in London. QIB-UK has assembled a team of real estate specialists who will help in ensuring clients are well placed to get the best real estate opportunities in the market. The bank’s network gives clients an early access to exclusive residential real estate opportunities in the London real estate market. (QE)
- 3. Page 3 of 5 Qatar Exchange Top 5 Gainers Top 5 Decliners Source: Qatar Exchange (QE) Source: Qatar Exchange (QE) Most Active Shares by Value (QR Million) Most Active Shares by Volume (Million) Source: Qatar Exchange (QE) Source: Qatar Exchange (QE) Investor Trading Percentage to Total Value Traded Net Traded Value by Nationality (QR Million) Source: Qatar Exchange (QE) Source: Qatar Exchange (QE) 21.5% 7.5% 3.9% 3.5% 3.1% 0.0% 8.0% 16.0% 24.0% Qatar Cinema & Film Distribution Salam International Investment Aamal Mannai Corp. Al Khaleej Takaful Insurance -11.8% -8.2% -7.9% -7.0% -6.4% -15.0% -10.0% -5.0% 0.0% Ooredoo Mazaya Qatar Barwa Real Estate Qatar Islamic Bank Al Meera Consumer Goods 500.7 303.2 265.3 194.2 184.2 0.0 200.0 400.0 600.0 Masraf Al Rayan QNB Group Barwa Real Estate Gulf International Services Industries Qatar 9.6 7.8 6.8 6.4 4.8 0.0 4.0 8.0 12.0 Masraf Al Rayan Vodafone Qatar Barwa Real Estate Ezdan Real Estate Mazaya Qatar 0% 20% 40% 60% 80% 100% Buy Sell 44.05% 40.17% 17.22% 15.99% 14.99% 15.88% 23.75% 27.96% Qatari Individuals Qatari Institutions Non-Qatari Individuals Non-Qatari Institutions 1,930 1,220 1,769 1,381 161 (161) (500) - 500 1,000 1,500 2,000 2,500 Qatari Non-Qatari Net Investment Total Sold Total Bought
- 4. Page 4 of 5 TECHNICAL ANALYSIS OF THE QE INDEX Source: Bloomberg The QE Index breached its higher highs and higher lows pattern on the charts, as it fell in four of the five trading sessions. The index opened on a positive note on Thursday, but later fell in the day to close at 12,453.76, down 1.09%. The index lost more than 4% during the week, moving below the psychological level of 12,500. However, the index managed to hold on to its support level of 12,450. If this level is broken, the index may move toward its next strong support of 12,250. The index closed at its lowest point of the day on Thursday, which suggests that it remains weak, and may fall further from the current level. The RSI and the MACD continued to trend lower, supporting this negative market view. On the upside the 12,600 level is a strong resistance level for the index. A close above the 21-day moving average (currently at 13,099.58) would indicate a reversal of the short-term downtrend. DEFINITIONS OF KEY TERMS USED IN TECHNICAL ANALYSIS RSI (Relative Strength Index) indicator – RSI is a momentum oscillator that measures the speed and change of price movements. The RSI oscillates between 0 to 100. The index is deemed to be overbought once the RSI approaches the 70 level, indicating that a correction is likely. On the other hand, if the RSI approaches 30, it is an indication that the index may be getting oversold and therefore likely to bounce back. MACD (Moving Average Convergence Divergence) indicator – The indicator consists of the MACD line and a signal line. The divergence or the convergence of the MACD line with the signal line indicates the strength in the momentum during the uptrend or downtrend, as the case may be. When the MACD crosses the signal line from below and trades above it, it gives a positive indication. The reverse is the situation for a bearish trend. Candlestick chart – A candlestick chart is a price chart that displays the high, low, open, and close for a security. The ‘body’ of the chart is portion between the open and close price, while the high and low intraday movements form the ‘shadow’. The candlestick may represent any time frame. We use a one-day candlestick chart (every candlestick represents one trading day) in our analysis. Doji candlestick pattern – A Doji candlestick is formed when a security's open and close are practically equal. The pattern indicates indecisiveness, and based on preceding price actions and future confirmation, may indicate a bullish or bearish trend reversal. Shooting Star/Inverted Hammer candlestick patterns – These candlestick patterns have a small real body (open price and close price are near to each other), and a long upper shadow (large intraday movement on the upside). The Shooting Star is a bearish reversal pattern that forms after a rally. The Inverted Hammer looks exactly like a Shooting Star, but forms after a downtrend. Inverted Hammers represent a potential bullish trend reversal.
- 5. Contacts Saugata Sarkar Abdullah Amin, CFA Shahan Keushgerian Head of Research Senior Research Analyst Senior Research Analyst Tel: (+974) 4476 6534 Tel: (+974) 4476 6569 Tel: (+974) 4476 6509 saugata.sarkar@qnbfs.com.qa abdullah.amin@qnbfs.com.qa shahan.keushgerian@qnbfs.com.qa Sahbi Kasraoui Ahmed Al-Khoudary QNB Financial Services SPC Manager – HNWI Head of Sales Trading – Institutional Contact Center: (+974) 4476 6666 Tel: (+974) 4476 6544 Tel: (+974) 4476 6548 PO Box 24025 sahbi.alkasraoui@qnbfs.com.qa ahmed.alkhoudary@qnbfs.com.qa Doha, Qatar DISCLAIMER: This publication has been prepared by QNB Financial Services SPC (“QNBFS”) a wholly-owned subsidiary of Qatar National Bank (“QNB”). QNBFS is regulated by the Qatar Financial Markets Authority and the Qatar Exchange; QNB is regulated by the Qatar Central Bank. This publication expresses the views and opinions of QNBFS at a given time only. It is not an offer, promotion or recommendation to buy or sell securities or other investments, nor is it intended to constitute legal, tax, accounting, or financial advice. We therefore strongly advise potential investors to seek independent professional advice before making any investment decision. Although the information in this report has been obtained from sources that QNBFS believes to be reliable, we have not independently verified such information and it may not be accurate or complete. While this publication has been prepared with the utmost degree of care by our analysts, QNBFS does not make any representations warranties as to the accuracy and completeness of the information it may contain, and declines any liability in that respect. QNBFS reserves the right to amend the views and opinions expressed in this publication at any time. It may also express viewpoints or make investment decisions that differ significantly from, or even contradict, the views and opinions included in this report. COPYRIGHT: No part of this document may be reproduced without the explicit written permission of QNBFS. Page 5 of 5 Source: Bloomberg Com pany Nam e Price (June 19) % Change 5-Day % Change YTD Market Cap. QR Million TTM P/E P/B Div. Yield Qatar National Bank 176.00 (4.86) 2.33 123,152 12.6 2.4 4.0 Qatar Islamic Bank 91.60 (7.01) 32.75 21,644 15.8 1.9 4.4 Commercial Bank of Qatar 65.50 0.31 11.02 19,449 11.9 1.2 2.5 Doha Bank 58.50 (3.15) 0.52 15,115 10.6 1.4 7.7 Al Ahli Bank 50.00 (1.96) 18.18 8,260 15.3 2.2 N/A Qatar International Islamic Bank 80.00 (5.21) 29.66 12,109 15.7 2.4 4.7 Masraf Al Rayan 51.20 (5.01) 63.58 38,400 22.1 3.9 2.9 Al Khaliji Bank 21.60 (5.88) 8.05 7,776 14.7 1.4 4.6 National Leasing 31.95 (3.62) 5.97 1,581 25.2 1.2 4.7 Dlala Holding 52.00 (3.35) 135.29 1,154 200.0 4.6 N/A Qatar & Oman Investment 15.00 (0.13) 19.81 473 21.6 1.4 4.0 Islamic Holding Group 71.80 (2.97) 56.09 287 29.0 5.2 2.4 Banking and Financial Services 249,401 Zad Holding 79.30 (1.25) 14.10 1,037 9.7 0.7 4.4 Qatar German Co. for Medical Devices 14.66 (2.27) 5.85 169 N/M 1.0 N/A Salam International Investment 17.25 7.54 32.59 1,972 15.3 1.2 5.8 Medicare Group 83.80 (0.95) 59.62 2,358 23.8 3.1 2.1 Qatar Cinema & Film Distribution 57.60 21.52 43.64 329 28.6 2.3 N/A Qatar Fuel 214.80 (1.24) (1.71) 18,142 15.1 3.1 3.6 Qatar Meat and Livestock 59.00 0.68 14.12 1,062 19.8 3.9 3.6 Al Meera Consumer Goods 168.90 (6.43) 26.71 3,378 15.4 2.7 4.7 Consum er Goods and Services 28,448 Qatar Industrial Manufacturing 45.90 (2.13) 8.85 2,181 10.5 1.5 N/A Qatar National Cement 132.50 0.00 11.34 6,506 14.5 2.7 4.5 Industries Qatar 177.20 (2.05) 4.91 107,206 15.2 3.7 6.2 Qatari Investors Group 61.00 (2.56) 39.59 7,584 33.6 3.6 1.2 Qatar Electricity and Water 183.50 (3.47) 10.97 20,185 13.6 3.5 3.7 Mannai Corp. 117.00 3.54 30.14 5,337 10.5 3.0 4.7 Aamal 16.70 3.92 11.33 10,020 18.8 1.4 N/A Gulf International Services 94.10 0.43 92.83 17,488 24.0 5.9 1.7 Mesaieed Petrochemical Holding 32.45 (1.96) N/A 40,768 N/A 3.0 1.1 Industrials 217,275 Qatar Insurance 80.00 1.01 50.38 12,843 16.0 2.5 2.5 Doha Insurance 25.00 (1.57) 0.00 1,250 9.3 1.2 8.0 Qatar General Insurance & Reinsurance 44.65 1.71 11.86 3,089 1.4 0.6 2.8 Al Khaleej Takaful Insurance 45.35 3.07 61.52 1,007 13.6 1.5 N/A Qatar Islamic Insurance 75.20 0.40 29.88 1,128 14.8 4.3 5.0 Insurance 19,317 United Development 24.79 (0.44) 15.12 8,778 18.9 0.8 3.8 Barw a Real Estate 38.70 (7.86) 29.87 15,059 10.2 1.1 5.2 Ezdan Real Estate 21.72 (0.14) 27.76 57,612 46.2 1.9 1.4 Mazaya Qatar Real Estate Development 17.53 (8.22) 56.80 1,753 11.4 1.4 4.3 Real Estate 83,202 Qatar Telecom 130.00 (11.80) (5.25) 41,642 16.0 1.6 3.1 Vodafone Qatar 19.60 (2.24) 83.01 16,570 N/M 2.8 0.9 Telecom s 58,211 Qatar Navigation (Milaha) 91.10 (2.88) 9.76 10,433 10.8 0.8 5.5 Gulf Warehousing 50.70 (4.34) 22.17 2,411 21.9 3.2 3.0 Qatar Gas Transport (Nakilat) 23.00 (2.13) 13.58 12,880 16.8 3.6 4.8 Transportation 25,725 Qatar Exchange 681,578