Participation data 2006
•Download as PPT, PDF•
0 likes•141 views

Data collected by Dustin Coufal in 2006. The latest total livestock participation data for the State of Texas

Recommended
More Related Content
Viewers also liked
Viewers also liked (18)
Similar to Participation data 2006
Similar to Participation data 2006 (16)
Recently uploaded
Recently uploaded (20)
Participation data 2006
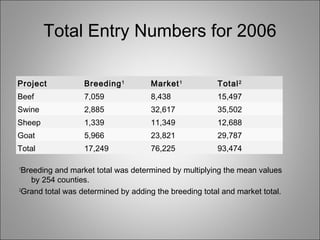
- 1. Total Entry Numbers for 2006 Project Breeding1 Market1 Total2 Beef 7,059 8,438 15,497 Swine 2,885 32,617 35,502 Sheep 1,339 11,349 12,688 Goat 5,966 23,821 29,787 Total 17,249 76,225 93,474 1 Breeding and market total was determined by multiplying the mean values by 254 counties. 2 Grand total was determined by adding the breeding total and market total.
- 2. Total Market Entry Numbers for 2001 and 2006 Project 2001 Entries 2006 Entries Percent Change1 Beef 7,582 8,438 11.29 Swine 34,126 32,617 -4.42 Sheep 11,837 11,349 -4.12 Goats 17,651 23,821 34.95 Total 71,196 76,225 7.06 1 Percent change was determined by this formula: (2006 entries-2001 entries)/2001 entries * 100
- 3. Regional Results Region Breeding Market East Beef 2,173.89 2,412.22 Swine 1,093.00 8,223.00 Sheep 388.84 2,836.79 Goats 1,037.90 6,209.60 Total 4,693.63 19,681.60 North Beef 872.67 1,639.52 Swine 613.16 8,935.55 Sheep 190.55 2,301.48 Goats 424.95 3,815.26 Total 2,101.32 16,691.82 Region Breeding Market South Beef 3,171.54 2,411.23 Swine 443.77 7,517.74 Sheep 174.34 2,394.26 Goats 282.15 5,094.92 Total 4,071.81 17,418.15 West Beef 778.59 1,902.93 Swine 725.30 8081.48 Sheep 595.56 3845.59 Goats 4,221.00 8,582.38 Total 6,320.44 22,412.38