Technical Report: Canadian International Minerals (2009)
•
1 recomendación•373 vistas

Technical Report on the Carbo Property of Canadian Intrnational Minerlas.

Recomendados
Recomendados
Más contenido relacionado
Destacado
Destacado (7)
Similar a Technical Report: Canadian International Minerals (2009)
Similar a Technical Report: Canadian International Minerals (2009) (20)
Más de Rocky Mountain Rare Metal Belt
Más de Rocky Mountain Rare Metal Belt (20)
Último
Último (20)
Technical Report: Canadian International Minerals (2009)
- 1. TECHNICAL REPORT ON THE CARBO PROPERTY East-Central British Columbia Approximate Geographic Coordinates 54° 30' N, 120° 03' W NTS Map Sheets 93J/08 and 93J/09 For: Canadian International Minerals Inc. Suite 950, 789 West Pender Street Vancouver, BC V6C-1H2 By: Michael Guo, P.Geol. April 2nd, 2009
- 2. TABLE OF CONTENTS ITEM 3: SUMMARY.......................................................................................................................... - 1 - ITEM 4: INTRODUCTION ............................................................................................................... - 2 - ITEM 5: RELIANCE ON OTHER EXPERTS ................................................................................. - 2 - ITEM 6: PROPERY DESCRIPTION AND LOCATION ................................................................. - 2 - ITEM 7: ACCESSIBILITY, CLIMATE, LOCAL RESOURCES, ................................................... - 3 - INFRASTRUCTURE AND PHYSIOGRAPHY .................................................................................... - 3 - ITEM 8: HISTORY ............................................................................................................................ - 4 - ITEM 9: GEOLOGIC SETTING ....................................................................................................... - 7 - ITEM 9A: REGIONAL GEOLOGY ................................................................................................. - 7 - ITEM 9B: PROPERTY GEOLOGY ................................................................................................. - 7 - ITEM 10: DEPOSIT TYPE.............................................................................................................. - 8 - ITEM 11: MINERALIZATION ....................................................................................................... - 9 - ITEM 12: EXPLORATION ............................................................................................................. - 9 - ITEM 13: DRILLING .................................................................................................................... - 11 - ITEM 14: SAMPLING METHOD AND APPROACH................................................................. - 12 - ITEM 15: SAMPLE PREPARATION, ANALYSES AND SECURITY ....................................... - 14 - ITEM 16: DATA VERIFICATION ............................................................................................... - 15 - ITEM 17: ADJACENT PROPERTIES ......................................................................................... - 16 - ITEM 18: MINERAL PROCESSING AND MEALLURGICAL TESTING ............................... - 16 - ITEM 19: MINERAL RESOURCES AND MINERAL RESERVE ESTIMATES ..................... - 16 - ITEM 20: OTHER RELEVENT DATA AND INFORMATION ................................................. - 16 - ITEM 21: INTERPRETATION AND CONCLUSIONS .............................................................. - 17 - ITEM 22: RECOMMENDATIONS............................................................................................... - 17 - ITEM 23: REFERENCES ............................................................................................................. - 20 - ITEM 24: DATE AND SIGNATURE PAGE ................................................................................ - 21 - ITEM 25: ADDITIONAL REQUIREMENTS FOR TECHNICAL REPORTS ON DEVELOPMENT PROPERTIES AND PRODUCTION PROPERTIES .......................................... - 22 - ITEM 26: ILLUSTRATIONS ............................................................................................................... I i
- 3. LIST OF ILLUSTRATIONS Page Figure 6.1 Location Map ............................................................................................... At end Figure 6.2 Property Map ............................................................................................... At end Figure 8.1 Location of Historic Mineral Claims.............................................................. At end Figure 8.2 Location of Historic Exploration Grids .......................................................... At end Figure 8.3 George Grid – Niobium Soil Geochemistry, Historic Samples...................... At end Figure 8.4 George Grid – Cerium Soil Geochemistry, Historic Samples ....................... At end Figure 8.5 George Grid – Barium Soil Geochemistry, Historic Samples ....................... At end Figure 8.6 George Grid – Niobium and REE Rock and Soil Geochemistry, Historic Samples .............................................. At end Figure 8.7 George Grid – Magnetometer Survey, Historic ............................................ At end Figure 8.8 Prince Grid – Niobium Soil Geochemistry, Historic Samples ....................... At end Figure 8.9 Prince Grid – Cerium Soil Geochemistry, Historic Samples ......................... At end Figure 8.10 Prince Grid – Barium Soil Geochemistry, Historic Samples ......................... At end Figure 8.11 Prince Grid – Niobium and REE Rock and Soil Geochemistry, Historic Samples, Carbo Property................................................... At end Figure 8.12 Prince Grid – Niobium and REE Rock Geochemistry, Historic Samples, Adjacent Property .............................................. At end Figure 8.13 Prince Grid – Magnetometer Survey, Historic .............................................. At end Figure 8.14 D Grid – Niobium Soil Geochemistry, Historic Samples ............................... At end Figure 8.15 D Grid – Cerium Soil Geochemistry, Historic Samples ................................ At end Figure 8.16 D Grid – Barium Soil Geochemistry, Historic Samples................................. At end Figure 9.1 Regional Geology ........................................................................................ At end Figure 9.2 George Grid – Property Geology ................................................................. At end Figure 9.3 Prince Grid – Property Geology ................................................................... At end Figure 12.1 2006-2007 Sampling – Niobium Soil Geochemistry .................................... At end Figure 12.2 2006-2007 Sampling – Cerium Soil Geochemistry ..................................... At end Figure 12.3 2006-2007 Sampling – Barium Soil Geochemistry....................................... At end Figure 12.4 2006-2007 Sampling – Niobium Rock Geochemistry ................................... At end Figure 12.5 2006-2007 Sampling – REE Rock Geochemistry ........................................ At end Figure 12.6 2006-2007 Work – Magnetometer Survey ................................................... At end Figure 12.7 2006-2007 Work – Scintillometer Survey ..................................................... At end Figure 12.8 2006-2007 Sampling – Gold anomaly and Verification ................................ At end ii
- 4. LIST OF TABLES Page Table 1 Carbo Property ............................................................................................ 3 Table 2 Expenditures between 2006 and 2009 ........................................................ 10 Table 3 Proposed Exploration of the Carbo Property ............................................... 19 LIST OF APPENDICES Page Appendix 1 Location of Rock Samples………………………….…………………………… A1 Appendix 2 Location of Soil Samples……………………………………………………... .. A3 Appendix 3 Acme Analytical Laboratories Ltd. Analytical Results………………………….…………………………… ................ A4 iii
- 5. ITEM 3: SUMMARY The Carbo Property encompasses a series of Niobium and Rare Earth Element bearing carbonatite and alkaline intrusions, located about 80 km northeast of Prince George and 50 km east of Bear Lake, British Columbia. The property was acquired during 2005 and 2006, by Jody Dahrouge, on behalf of Commerce Resources Corporation (Commerce). It consists of four claims: Carbo1, Carbo2, Carbo3 and Carbo West, totalling 14.63 sq. km. The property is subject to a mineral property option agreement dated February 10, 2009 between Commerce and Canadian International Minerals Inc. (CIN). Under the terms of the agreement, CIN will acquire a 75% interest in and to the Carbo Claims, subject to regulatory approval. The property is underlain by Cambrian Kechika Group sedimentary rocks, which consist mainly of interbedded limestone with calcareous argillite and phyllite. Several dike-like or sill-like, carbonatite and alkaline intrusions with associated Niobium and Rare Earth Element (ΣREE) mineralization were identified at the property,and adjacent areas. The mineralized intrusives outcrop intermittently across several kilometres strike length at Bear Ridge, a northwest trending ridge with several hundred meters relief above the local topography. The mineralization includes radiometric anomalies, soil geochemical anomalies, and grab samples from outcrops and trenches. The soil geochemical anomalies are enriched in the light REE’s (La, Ce, Pr, Nd), and locally exceed 2,000 ppm Cerium. Soil geochemical anomalism is also noted for Niobium, with values in excess of 3,000 ppm Niobium. The soil anomalies coincide with or are partly displaced downslope from buried outcrops of carbonatite and/or alkaline intrusions. Mineralized outcrops have returned from 0.09 to 0.20% Nb2O5, and trenches from background values to 0.95% Nb2O5. Historic samples from trenches within claim Carbo2 also returned from background concentrations to 8.37% P2O5 and generally less than 0.5% total REE’s + Y. Less than 600 carbonatite occurrences are known worldwide. They are or have yielded a variety of commodities that include: Niobium, REE’s, Phosphate, Vermiculite, and Copper. The Carbo Property is considered an early stage of exploration project for Niobium and REE mineralization; and is of sufficient merit to warrant further exploration. Geological mapping, trenching and a small drilling program are proposed to continue evaluated the known mineralization at the property. The exploration proposed herein, is estimated to cost approximately $197,500, not including GST. -1-
- 6. ITEM 4: INTRODUCTION The author has been retained by Canadian International Minerals Inc. to prepare an independent technical review of the Carbo Property. The purpose of this report is to review the exploration potential of the Carbo Property and recommend further work, if warranted. This report has been prepared in compliance with the standards outlined in National Instrument 43-101, for the Canadian Securities Administration. The information used in the preparation of this technical report includes public assessment reports, maps, academic publications, and results of exploration work conducted by Dahrouge Geological Consulting Ltd. (Dahrouge) during 2006 and 2007. A detailed summary of these items is provided in the section entitled “Item 23:References”. The author planned and supervised the exploration of the Carbo Property, while and employee of Dahrouge, and personally visited the property from May 30, 2006 to June 16, 2006 and June 11, 2007 to June 16, 2007. ITEM 5: RELIANCE ON OTHER EXPERTS This technical report is based upon both published and unpublished data, which includes historic third party reports. Although authors with post second degrees in geology prepared the majority of the historic third party reports and supervised the historic exploration work described herein, the author does not take responsibly for the accuracy of this information. The author reviewed the tenure and ownership of the Carbo Property as available from the British Columbia Energy and Mines online mineral tenure system, Mineral Title Online BC (MTO), and believes the information to be reliable. The author is unaware of any outstanding environmental or other liabilities relating to the property. ITEM 6: PROPERY DESCRIPTION AND LOCATION The Carbo Property encompasses about 14.63 sq. km, situated within the Cariboo Mining Division (Figure 6.1; Table 1). Throughout this report the term Carbo Property refers to the four mineral claims, Carbo1 (515430), Carbo2 (515432) and Carbo3 (515433) and Carbo West (536347) (Figure 6.2). The Carbo Property is located southeast of Whicheeda Lake between Wicheika Creek and -2-
- 7. Parsnip River, 80 km northeast of Prince George and 50 km east of Bear Lake, British Columbia. Most of the property is within NTS map area 93J/08, only a small part of claim Carbo3 lies within 93J/09 (Figure 6.1). The property is centered at approximately 54° 30′ N latitude and 120° 03′ W longitude. The current Carbo Property was staked in June 2005 and June 2006 by Jody Dahrouge on behalf of Commerce. Sufficient work has been completed to keep the Carbo Property in good standing to Dec. 31, 2012. Table 1: List of Mineral Claims Tenure Number Claim Name Map Number Good To Date Mining Division Area (ha) 515430 Carbo1 093J09 2012/DEC/31 CARIBOO 469 515432 Carbo2 093J09 2012/DEC/31 CARIBOO 469 515433 Carbo3 093J09/08 2012/DEC/31 CARIBOO 187 536347 Carbo West 093J09 2012DEC/31 CARIBOO 338 On February 10, 2009 Commerce Resources Corp. (Commerce) entered into a Mineral Property Option Agreement with Canadian International Minerals Inc. (CIN) in respect of the Carbo Property. Under the terms of the agreement, CIN will acquire a 75% interest in and to the Carbo Claims, subject to regulatory approval. In consideration for the interest in the Carbo Claims, CIN will pay to Commerce a total of $30,000 cash: $10,000 on signing of the agreement (paid), $10,000 on the first year anniversary and $10,000 on the second year anniversary. CIN will also issue the Company a total of 1,500,000 common shares: 500,000 common shares with five days of the filing of the property acquisition with the regulatory authorities, 500,000 common shares on the first year anniversary and 500,000 common shares on the second year anniversary. CIN is also required to incur a total of $198,000 in exploration expenditures on the Carbo Claims: $66,000 in the first year of the agreement, $66,000 in the second year and $66,000 in the third year. The Company will also retain a 2% NSR Royalty on the Carbo Claims (Commerce Resources Corp., 2009). ITEM 7: ACCESSIBILITY, CLIMATE, LOCAL RESOURCES, INFRASTRUCTURE AND PHYSIOGRAPHY The Carbo Property is located about 80 km northeast of the city of Prince George and 50 km -3-
- 8. east of the village of Bear Lake, British Columbia. Bear Lake is accessible from B.C. Highway 97 (Figure 6.1), and the property can be reached from Bear Lake along local No. 700 gravel road, which branches from Highway 97 at the village. Trails and logging roads provide access to the northeast and southwest edges of the property. The main line of the Canadian National Railway passes through Bear Lake. Limited supplies and accommodations are available at Bear Lake. Summers tend to be warm and dry; winters cooler, but less moist. Local temperature extremes range from -30° to +30°C, with normal ranges from -15° to 25°C. Within the upper reaches of the property, partial snow cover may last until the middle June. The Carbo Property is between 900 m and 1520 m elevation above sea level, and covers portions of a northerly trending ridge that is several kilometres in length, termed Bear Ridge. Slopes are moderately steep and typically covered by thick undergrowth consisting of buck brush and devil’s club at lower elevations. Areas along the ridge are covered by alder and white pine. Infrastructure within the property is poor with logging roads leading to the edges of the property only. Access within the property is by foot or helicopter. The area is considered sparsely populated and historically is reliant on the lumber industry. In recent years the lumber industry has suffered due to the Pine Beetle infestation. Bear Lake (pop. 170) is the nearest community to the property, and at best, provides basic accommodations and supplies. Future exploration can be based in Bear Lake, while most supplies can be obtained from Prince George. ITEM 8: HISTORY In 1961 the Geophysics Division of the Geological Survey of Canada completed a 1:63360 scale aeromagnetic survey across parts of British Columbia. A significant magnetic anomaly was identified on what is currently the Carbo Property (GSC, Geophysics Paper 1546, 1964). In 1976 and 1977 Kol Lovang prospected the area and staked two claims on minor base metal showings, but no follow-up was reported and the claims were permitted to lapse. Later assaying of Lovang’s samples by Teck Corporation indicated anomalous values of Niobium (Betmanis A.I., 1987). During April, 1986, Teck Exploration Limited staked the initial 4 Ole claims (Ole 1 to Ole 4) after entering an agreement with Lovang, seven more claims were staked during and after the exploration work during 1986: PG1, PG2, Fata, Morgana, Prince, Lake and George. All 11 claims were continuous and grouped into the Prince and George groups (Figure 8.1). Teck Corporation acted as operated of the 1986 exploration, which included a stream silt geochemical survey, -4-
- 9. geological mapping, geochemical soil sampling, a magnetic surveying and limited trenching. The exploration located carbonatitic and syentitic intrusions at the Prince George and Prince grids. Three rock samples from trench PT 5-7 returned high concentrations of Niobium and REE values. One sample from trench pit-6 returned approximately 0.95% Nb2O5. In 1988, Mader and Greenwood. conducted an academic field survey which focused on the carbonatites and related rocks. They provide a detailed description and map of the carbonatites in the area. Historic exploration data from Teck Exploration Limited has been compiled and georeferenced in a GIS database. Teck established five exploration grids during 1986: George Grid, Prince Grid, Lake Grid, “D” Grid and “F” Grid. The George Grid, Prince Grid and “D” Grid are entirely or partially within the Carbo Property. The Lake and “F” grid’s are within an adjacent property (Figure 8.2). Some information on these grids from Teck Exploration Ltd.’s historic work, include information on adjacent claims. These historic claims are located to the north and south of the current Carbo Property and are currently covered by claims owned by Spectrum Mining Corp. (Figure 8.2). All of the maps in Section 8: History of this report clearly define the property boundary of the current Carbo claims. The author has not verified the results reported in these adjacent claims, and the information reported on these claims is not necessarily indicative of the mineralization on the Carbo property. George Grid A small portion of the northeast part of the historic George Grid lies within claim Carbo1; work included soil sampling, a magnetometer survey and geological mapping (Figures 8.1 – 8.6, 8.13). Minimal outcrop is reported from the grid area. Within claim Carbo1, soil samples were collected from lines spaced 100-m apart, at 50-m intervals. They are slightly anomalous in Niobium, with peak values of 319 ppm within claim Carbo1 and 883 ppm on the adjacent property (Figure 8.3); these results suggest the presence of a buried alkaline intrusion(s). Cerium and Barium are locally enriched, and appear to partly correlate with Niobium (Figures 8.4 and 8.5); both constituents may be used to help locate the intrusive bodies. A peak value of 2,061 ppm Ce is reported within the claim Carbo1, and 25,905 ppm Ce on the adjacent property. Samples with enrichment in Cerium, additionally show considerable enrichment in the other light REE’s, La, Pr, Nd and Sm. Geological mapping outlined a narrow dioritic to granodioritic dyke in claim Carbo1, and one rock sample was analyzed showing a low concentration of 0.04% Nb (Figure 8.6). -5-
- 10. Sampling of the adjacent property on the George Grid revealed elevated REE concentration in soil and rock samples (Figure 8.6). Soil sample “L72+00W – 0+50S” overlying the syenite outcrop and trench GT-1 returned a value of 4.11% REE. The 1987 sampling of trench GT-2 on the George Grid revealed a composite value of 1.11% REE over a width of 42 meters (samples 10871-10878); and a high value of 1.36% REE over a width of five meters (sample 10873). For the 1987 sampling of the trenches on the George Grid (Lovang and Meyer, 1987), it should be noted that several elements reported were over their detection limits including La, Nd, and Ce. Also, only La, Ce, Nd, Sm, Eu, Tb, Dy and Lu values were reported. Magnetometer surveys indicate higher than background magnetic readings in the area of the soil anomaly (Figure 8.7), which may be due to narrow and weakly magnetic dykes (Betmanis, 1987). Prince Grid A majority of the 1986 exploration was conducted at the Prince Grid. This included soil sampling, trenching, rock sampling and a magnetometer survey (Betmanis, 1987). About half of the work was within the current claims Carbo2 and Carbo3, and the remainder was on an adjacent property (Figures 8.8 to 8.13). Within the Prince Grid, soil samples were collected from lines spaced 100-m apart, at 50-m intervals. They are strongly anomalous in Niobium, with peak values of 3,192 ppm within claim Carbo2, and 4,597 ppm on the adjacent property; these values correlate to mapped carbonatite in bedrock (Figure 8.8). Cerium and Barium are locally enriched (Figures 8.9; and 8.10), and appear to partly correlate with Niobium; both constituents may be used to help locate the intrusive bodies. A peak value of 2,017 ppm Ce is reported within claim Carbo2, and 914 ppm Ce on the adjacent property. Samples elevated in Cerium, additionally show considerable enrichment in the other light REE’s La, Pr, Nd and Sm. Geological mapping in the Prince Grid outlined a carbonatite dyke at least 2 km long, with a northwest strike (Figure 9.3). Eleven regional rock samples were collected from within claim Carbo2, and returned up to 0.19% Nb (Figure 8.11). Seven trenches were blasted and cleared on the Prince Grid for a total 79.5 m (Betmanis, 1987). Among them trenches PT 5, PT6 and PT7 are within claim Carbo2 (Figure 8.11), the greatest concentrations of Niobium and REE in rock samples at the Prince Grid were collected from these trenches, with values up to approximately 0.95 %Nb2O5 (trench 6) and 0.43% REE (trench 5). -6-
- 11. A magnetic high of at least 100 gammas above background coincides with the carbonatite on the Prince Grid (Figure 8.13). A distinct change in the background magnetic readings is apparent in the area of the mapped carbonatite outcrop. Northeast of the outcrop, values are between 400 and 450 gammas, whereas gamma values are above 450 gammas to the southwest of the outcrop. This is likely due differing host rock lithologies on either side of the carbonatite outcrop, with calcareous argillite mapped to the southwest and limestone to the northeast. “D” Grid A majority of the “D” Grid lies within the Carbo West Claim, on the west flank of Bear Ridge. (Figures 8.14 to 8.16). Within the “D” Grid, soil samples were collected from lines spaced 100-m apart, at 50-m intervals. They are weakly anomalous in Niobium, with a peak values of 136 ppm within claim Carbo West. Cerium and Barium show weakly elevated values above background. No rock sampling or other geological/geophysical work was conducted on “D” Grid. ITEM 9: GEOLOGIC SETTING ITEM 9A: REGIONAL GEOLOGY The property and adjacent area are underlain primarily by upper Cambrian and lower Ordovician Kechika Group limestone, marble, slate siltstone, argillite and other calcareous sediments (Armstrong et al., 1969; and Massey et al., 2005). The strata strikes between 120° to 140° with steep dips to both the east and west. Several faults have been mapped, and are generally parallel to Wicheika Creek (040°/50° NW). One fault in the area strikes northeastly and post-dates the northwestly faults (Figure 9.1). ITEM 9B: PROPERTY GEOLOGY During 1996, portions of the Carbo Property (Carbo2 and Carbo3) were mapped at a scale of 1:5,000 by Teck Corporation (Betmanis, 1987). The Carbo 2 and 3 claims, partly underlie the historic Prince Grid (Betmanis, 1987; Figures 9.2 and 9.3), while a small portion of the George Grid overlaps with claim Carbo 1. The Prince Grid is underlain by interbedded limestone, calcareous argillite and phyllite. The lithologies to the northeast consist primarily of massive white limestone interbedded with, less massive, and thinner bedded medium- to dark-grey limestone. Towards the southwest, the -7-
- 12. limestone units are more silty. Lithologies in the southwest part of the grid include interbedded, light-grey calcareous argillite and weakly calcareous phyllite, which are locally ferruginous. Several dike or sill-like alkaline intrusions were mapped by Teck Corporation (Betmanis, 1987; Figure 9.2 and 9.3). The main intrusion is sub parallel with the main bedding orientations of the host lithologies, and was traced for about 2,700 m along strike. It varies in composition and thickness, along strike. The intrusions are carbonatitic or syentitic. The carbonatites vary from almost pure white to black, and are locally pyroxenite-rich. Betmanis (1987) indicates the carbonatites are coarse- to medium-grained, generally quartz free, and contain feldspar, carbonate, pyroxene and micas. Pyrite is a common accessory mineral. Fine-grained pyrochlore was identified by scanning electron microprobe (Betmanis, 1987). Lithologies atop the main peak on the Prince Grid are distinctly different than the surrounding sediments, suggesting the presence of a west dipping thrust. Several other faults were identified by the displacement of the local stratigraphy, by drainage patterns, and by local depressions in the topography. Faults are interpreted to be moderate to steep dipping. ITEM 10: DEPOSIT TYPE The host rocks to the mineral occurrences on the Carbo Property are carbonatites, which are defined as intrusive or extrusive igneous rocks composed of more than 50 percent, by volume, carbonate minerals. They typically occur within zoned alkalic complexes with other under-saturated alkaline rocks (feldspathoidal syenites and rocks of the ijolite suite), and can form intrusive plugs, dykes or sills. Carbonatites are relatively enriched in alkali elements, with classification based on the presence of calcite, dolomite, ferrorcarbonate minerals, and natrocarbonate minerals (Wolley and Kempe, 1989). A majority of carbonatites are located within stable, intra-plate areas; however, some are spatially related to plate margins. Carbonatites tend to occur in groups or provinces. Over 527 examples are known (Woolley and Kjarsgaard, 2008). Carbonatite-related deposits are classified as magmatic or metasomatic types (Richardson and Birkett, 1996), and their supergene equivalents (Mariano, 1989). Deposits of niobium and/or tantalum within carbonatites are generally formed by primary magmatic concentration. According to Mariano (1989), carbonatites associated REE deposits occur as follows: (a) primary, from carbonatite melts (ex. Mountain Pass, USA), -8-
- 13. (b) hydrothermal (ex. Bayan Obo, China), and (c) supergene, developed in carbonatite-derived laterites (Araxa and Catalao I Brazil; Mt. Weld, Australia). Carbonatites contain the greatest contents of REE’s and highest LREE:HREE ratios of any igneous rocks (Cullers and Graf, 1984). Additional examples of carbonatite-associated deposits include: Cargill, Ontario (phosphate); Niobec and Oka, Quebec (niobium); Mountain Pass, California (REE, barium); Araxa and Catalao, Brazil (niobium, phosphate, REE); and Palabora, South Africa (copper, phosphate, REE). ITEM 11: MINERALIZATION Mineralization within the Carbo Property is hosted by carbonatite and related alkaline intrusions. Betmanis,1987 noted that the better grades of Niobium and REE are from sections of weathered intrusive rock with black gouge or whitish clay on fractures. This indicates the possibility of remobilization of elements during structural events after emplacement of the carbonatite intrusions. Rock samples collected from the historic open pits and trenches during 2006 returned a maximum value of 3258 ppm Nb (sample 24455; Figure 12.4). A sample from a nearby outcrop returned a maximum value of 4673 ppm REE’s (sample 24018; Figure 12.5). Several alkaline intrusions with high gamma (CPS) readings were identified within claims Carbo1, Carbo2 and Carbo West, where surface outcrops from the areas returned values to 1526 ppm Nb (Sample 24459; Figure 12.4). ITEM 12: EXPLORATION After acquiring Carbo1, Carbo2 and Carbo3 claims in 2005, personnel of Dahrouge Geological Consulting Ltd. on behalf Commerce Resources Corp., conducted an exploration program during the summers of 2006 and 2007 (Guo and Dahrouge, 2006; Guo, 2007). The work programs included a soil geochemical survey, rock sampling, ground scintillometer and magnetometer geophysical surveys and prospecting. Table 2 summarizes the expenditures per year between 2006 and 2009. Most of the work was within the Carbo2 and Carbo3 claims. Claim CarboWest was staked after the 2006 exploration, and prior to the 2007 exploration. -9-
- 14. Table 2: Expenditures between 2006 and 2009 Year 2006 2007 2009 Expenditures $74,973.61 $31,554.77 $ 9,559.20 Total $116,087.58 Soil Sampling In total, 345 soil samples were collected during 2006 and 2007 (291 in 2006 and 54 in 2007 (Figures 12.1 to 12.3). Soil geochemistry maps (Figures 12.1 to 12.3) were prepared for Nb, Ce, and Ba. The historic work indicates that anomalous Niobium in soils correspond to the location of the underlying carbonatite, which suggests there was little lateral dispersion in soils (Betmanis, A.I,1987). Cerium shows a weak correlation with Niobium (Figure 12.1 and 12.2), with several spot highs exceeding 400 ppm Ce. During 2006 a soil sample collected from claim Carbo2, returned highly anomalous concentrations of Au (sample 24204: 1,739.9 ppb; Figure 12.8). Follow-up exploration during 2007, around this location included a grid with 25 soil samples collected every 12.5 m; in addition, six rock samples were collected and analyzed for Au. One soil sample was also collected from the same location as the 2006 sample. Both sets of samples were analyzed with Acme Analytical Analysis: Group 1DX (0.50 gram sample leached with 3 ml 2-2-2 HCL-HNO3-H2O at 95 DEG. C for one hour, diluted to 10 ml, analysed by ICP-MS. The follow-up soil and rock sampling revealed only background gold values in and around the area of the 2006, sample 24204. Rock Samples A total of 56 rock samples were collected from intrusive outcrops and float during 2006 and 2007 (Figures 12.4 and 12.5). Forty-five of the samples are carbonatitic and other alkaline intrusive rocks, with high REE and Niobium concentrations. Niobium contents range from background to1525.6 ppm Nb, and average 537 ppm (Figure 12.4). Total REE values range from 72.79 to 4672.57 ppm, and average 1330.84 ppm (Figure 12.5). Soil sampling near grid coordinate 3600E / 200N reveals a consistent enrichment in Niobium, Cerium and Barium values (Figures 12.1 to 12.3); as well as, being a large radioactive anomaly (Figure 12.7). Rock sample 28508 measured 1800 CPS, and returned 247.4 ppm Thorium, 810.6 - 10 -
- 15. ppm Niobium and 1022.19 ppm REEs from a limonite-stained phyllite outcrop. Sample 28531 from Carbo1 was relatively enrichment in Pb and Zn, with 3,027 ppm and 2,377 ppm, respectively. It also contained 31,025 ppm Barium. Geophysical Surveys Magnetic high anomalies do not appear to closely correlate with the radioactivity of the ground or the content of Niobium, Cerium or Barium in soil samples (Figure 12.6). One sample (24169), revealed 281.4 ppm Nb, 224.3 ppm Ce and 1125.4 ppm Ba (Figures 12.1 to 12.3) in an area of elevated magnetic readings, indicating the possibility for a buried carbonatite outcrop. Rock sampling was not conducted in this area. There appears to be a variation in background magnetic readings on either side of the large magnetic anomaly trending NW-SE, similar to the trend occurring on the historic Prince Grid (Section 8B); with higher magnetics to the southwest, and lower to the northeast. The magnetic high (greater than 56,128 gammas) appears to be on-trend with the historically mapped carbonatite outcrop and historic magnetic anomaly on the Prince Grid (Figure 8.13), further indicating the possibility for buried carbonatite. Moderate to strong radioactivity is noted within the southern portion of the Carbo1 and Carbo2 claims during the 2006 and 2007 scintillometer survey (Figure 12.7). The background radioactivity of the grid area is approximately 50-200 CPS. A NW-SE trending radioactive anomaly is apparent in the central part of the survey area. The anomalous trend likely outlines the location of the syenite that was sampled; returning elevated REE (up to 1573 ppm, sample 24001) and moderate Niobium concentrations (up to 843 ppm, sample 24003) (Figures 12.4 and 12.5). Radioactive readings were also taken during rock sampling. Elevated radioactivity appears to be caused by elevated Thorium concentrations. A moderate relationship between radioactivity (Thorium content) and Niobium/REE concentrations is indicated. For example, the rock sample 28505 measured 8200 CPS, and returned 1522.5 ppm Thorium, 731.6 ppm Niobium and 1030.64 ppm REEs from a syenite outcrop. Other rock samples that measured above 1000 CPS returned above average values of Thorium and Niobium; and near average REE values. ITEM 13: DRILLING - 11 -
- 16. There is no known drilling within the property. ITEM 14: SAMPLING METHOD AND APPROACH Information regarding sampling methods and approach employed by Dahrouge during the exploration of the Carbo Property is included in prior mineral claim Assessment Reports (Guo and Dahrouge, 2007; Guo, 2007), filed with the B.C. Ministry of Energy, Mines & Petroleum Resources. These descriptions have been supplemented by the author’s first hand knowledge of the exploration activities conducted during 2006-2007. The 2006 and 2007 exploration programs were under the direct supervision of the author. During 2006 and 2007, a total of 56 rock samples and 345 soil samples were collected from the property. In addition, approximately 20 line-km’s of ground scintillometer and magnetometer geophysical surveys were completed. The exploration was conducted throughout Carbo Property, with a majority of work completed within the Carbo2, Carbo3 and Carbo West claims. Rock Samples Rock sample locations and type are listed in Appendix 1, and shown on Figures 12.4 and 12.5. All the rock samples are grab samples, and may not accurately represent the grade of mineralization at the given location. Trenching accompanied by channel sampling, composite chip sampling, and/or diamond drilling will be required to obtain an estimate of the representative grade for the carbonatite complex. Rock sample UTM locations were recorded using Garmin 76 GPS, with an accuracy of approximately 5-10m. Due to the density of the forest cover within the work area, the accuracy of some locations is poor. The coordinate system used is NAD 1983, UTM Zone10. Soil Sampling Soil sampling was carried out across parts of the Carbo Property during 2006 and 2007 (Figures 12.1 to 12.3). Sample locations and type are listed in Appendix 2. The objective of this work was to delineate possible near surface occurrences of carbonatite or alkaline rocks, using characteristic geochemical tracers (Nb, REE’s and Ba), in order to aid in locating possible sites for follow-up hand trenching and prospecting. Soil surveys previously employed by Commerce Resources Corp. have proved to be an efficient technique in locating carbonatites within mountainous terrains of British Columbia. - 12 -
- 17. The soil survey on the Carbo Property was carried out over an area measuring approximately 1500 by 2500 meters, covering approximately 3.75 sq. km. (Figures 12.1 to 12.3). Samples were collected from 50 meter stations on grid-lines spaced 150 m apart. The survey was planned in advance, and the coordinates of each station were calculated and imported to Garmin 76 GPS. The locations were navigated to with the GPS and flagged in the field. Soil samples were taken from a presumed ‘B-horizon’ between 0.1 m -1.0 m below surface, depending on vegetation and thickness of overburden (which varied across the sampled areas). Most samples were collected from 0.2 to 0.5 m below surface. Alluvial beds were avoided wherever possible. Any visible rock fragments larger than 1-2 cm, including both glacial and colluvial material; as well as, organics were hand-removed. Sample depth, colour, particle size, wetness, amount of rock fragments and their lithology, and the amount and characteristics of organics were recorded. Whenever a gravel-rich, impenetrable layer was reached using a shovel, it was assumed to be immediately above the bedrock, and the sample was taken from that layer. The soil samples weighed between 0.5 - 1.5 kg, and were packed in pre-labelled plastic bags with the detached paper tag from a sample book together with a piece of a flagging tape marked with the sample number using a felt marker, and were tie-locked. The samples were shipped to Acme Analytical Laboratories Ltd. in Vancouver, where the pulps and rejects are stored. Geophysical Surveys Scintllometer and magnetometer surveys were completed at 12.5 meter stations on the 150 m interval grid lines (Figures 12.6 and 12.7). The surveys used the same grid locations established for the soil lithogeochemical program. Magnetic and radiometric surveys in combination with soil sampling by Commerce Resources Corp. in the Blue River area have proved to be an efficient technique in locating buried carbonatite rocks (Gorham, 2007). A GR-110G/E portable gamma-ray scintillometer with a 4.5 cubic inch sodium-iodide detector was used for both the 2006 and 2007 surveys. The gamma-ray scintillometer was certified by Exploranium G.S. Ltd. The GR-110G scintillometer measures total intensity of gamma-ray emissions from the following three naturally occurring radionuclides: 40K (1.46 MeV); 214Bi (0.609 238 208 – 2.44 MeV) – a product of U-series decay; and Tl (0.277 –2.62 MeV) – a product of 232 Th-series decay. The scintillometer’s operating minimum energy threshold is 45 KeV, with the maximum count rate of 9,999 counts per second (cps). The battery voltage and the count rate from a provided sample of 137Cs radionuclide were routinely checked before each survey session - 13 -
- 18. to ensure that the instrument operates within the specified parameters. In addition, the local background count rate level was measured at ~1 m above the ground before each survey session. The specified background level varies from 40 to 100 cps, but is up to 200 cps due to metasediment’s or alkaline rocks composed of potassium-bearing minerals such as micas and feldspar (sources of the gamma radiation from 40K). During the survey sessions, the scintillometer was always kept in its leather case to reduce the risk of an accidental mechanical shock and to minimize the detector’s surface contamination. All measurements were carried out at 1 sec count rate, recording an approximate average of 20 – 60 readings (in cps) integrated during a 20 – 60 sec counting interval, respectively, for each measurement. The detector was put on the ground at all times during measurements. The ground radiometric survey is a potentially useful supplement to the soil litho-geochemical survey as the carbonatites and alkaline rocks contain concentrations of Thorium within apatitie, pyrochlore, or some rare earth minerals. These minerals are relatively resistant and accumulate in the soil, thus causing elevated radiation above the background. A GSM-19 Overhauser Magnetometer was used for the 2006 magnetic survey. The measurements of the magnetic field (in nT) were taken at 12.5 m intervals following the soil lithogeochemical / radiometric survey grid. The magnetometers’ internal clocks were synchronized before beginning of the survey session. One of the instruments operated in the base mode in a magnetically quiet place away from power lines, roads and any metal constructions, while another was used for surveying the grid in a semi-automated, pre-programmed mode. All measured signals were of excellent quality. The diurnal corrections were made automatically at the end of the survey session. The survey was designed to supplement the soil lithogeochemical and radiometric surveys, in view of the common, to locally abundant, magnetite or pyrrhotite commonly found in carbonatites. Presence of the magnetic minerals in the carbonatites renders magnetic survey a potentially very efficient exploration technique. ITEM 15: SAMPLE PREPARATION, ANALYSES AND SECURITY Personnel of Dahrouge collected all the samples during 2006 and 2007 from the property. At the time of sample collection, the samples were bagged, tagged and recorded. All the samples were reordered and checked at the end of day and then stored in sealed 5 gallon plastic pale. Sample chain of custody was maintained by personnel of Dahrouge. The samples were stored at - 14 -
- 19. the site until the crew demobilization. The samples were brought back to the Dahrouge Geological Consulting Ltd. office in Edmonton, Alberta with the field crews, and then shipped to ACME Analytical Laboratories Ltd in Vancouver via courier for analysis. There was no indication from the lab that the samples were tampered with. The sampling was under the direct supervision of the author. It is the opinion of the author that sample preparation, security, and analytical procedures employed during the 2006 and 2007 exploration programs conform to industry standards. This opinion is based upon the author’s first hand knowledge of the exploration techniques and protocols employed, as a result of his participation in the exploration. As a consequence of this, the author has not specifically verified any of the sampling data, taken any samples that were not part of the exploration program, or conducted a specific follow-up site visit. At Acme Analytical laboratories Ltd., rock samples were crushed using ACME R150 preparation procedure: crushing the rock to -10 mesh (>70) and then pulverized a 250 g split to >90% -150 mesh. Soil samples were pulverized to -100 mesh ASTM in a mild-still pulverizer. All rock and soil samples were analyzed using their Group 4B (Full Suite) and Group 4A (intrusive rocks only): rare earth and refractory elements are determined by ICP mass spectrometer following a lithium metraborate/tetraborate fusion and nitric acid digestion of a 0.2 g sample. In addition, a separate 0.5 g split is digested in aqua regia and analysed by ICP-Mass spectrometer to obtain precious and base metals values (Appendix 3). Group 4A: 0.2 g sample were analysed by ICP-emission spectrometry following a lithium metraborate/ tetraborate fusion and dilute nitric digestion. Repeat analyses for random samples was completed, as was the periodic analyses of a standard. Given the stages of the exploration at the Carbo Property, quality control procedures such as duplicate samples, sample blanks and standards were not conducted. The author is of the opinion that the sample preparation, security and analytical procedure were adequate for the early stage of the exploration at Carbo Property. ITEM 16: DATA VERIFICATION ACME Analytical Laboratories Ltd. completed routine QA/QC through the sample preparation and analysis procedure, which includes internal duplicates and standards (Appendix 3). No external duplicates, blanks and standards were inserted to the sample suite prior to analysis. The author verified the 2006 and 2007 results obtained by the lab and compared them to the - 15 -
- 20. historic analysis. The author is of opinion that the exploration conducted by Teck Explorations Limited in 1986 and 1987 is of a high quality. ITEM 17: ADJACENT PROPERTIES Some information obtained in Section 8: History, of this report includes the review of exploration results from the adjacent historic claims, such as George and Lake claims. These historic claims are located to the north and south of the current Carbo Property and are currently covered by claims owned by Spectrum Mining Corp. (Figure 8.2). All of the maps in Section 8: History of this report clearly define the property boundary of the current Carbo claim. The author has not verified the results reported in these adjacent claims, and the information reported on these claims is not necessarily indicative of the mineralization on the Carbo property. All of the information included in Section 12; Exploration, of this report is on the current Carbo Property. ITEM 18: MINERAL PROCESSING AND MEALLURGICAL TESTING This section is not applicable to the subject property. ITEM 19: MINERAL RESOURCES AND MINERAL RESERVE ESTIMATES This section is not applicable to the subject property. ITEM 20: OTHER RELEVENT DATA AND INFORMATION There appear to be no environmental, permitting, legal, title, taxation, socio-economic, or political issues that adversely affect the potential development of the property. The exploration at the Carbo Property to date has shown that the Carbonatite System locally contains anomalous values of thorium as an accessory element. Analytical results of rock and soil samples from the 2006 and 2007 exploration indicate considerable variation in thorium concentrations. The exploration conducted during 2006 and 2007 has monitored the levels of these elements in the various samples collected, both as an exploration tool and for environmental assessment purposes. Analyses indicate that both elements are present in low amounts in the mineralized - 16 -
- 21. areas; other than a single sample, all of the 2006 and 2007 rock sampling results were below the 0.05% uranium and 0.15% thorium reporting thresholds as defined in the “Mineral Exploration Code: Part 11.13" 24 of the “Health, Safety and Reclamation Code for Mines in British Columbia, May 1998". One sample contained the threshold value of 0.15% thorium, whereas the average value within most carbonatite samples was between 0.005% and 0.05% thorium. It is important that Commerce continue monitoring thorium levels in subsequent programs. ITEM 21: INTERPRETATION AND CONCLUSIONS Historic work located a carbonatite complex and related alkaline intrusive rocks that extend for several kilometres along Bear Ridge, and which are partly within the Carbo Property. The intrusive rocks are highly anomalous in Niobium and REE’s. The Niobium-bearing mineral, pyrochlore, is generally <0.3 mm in size (Betmanis, A.I,1987, Mader 1988). Pyrochlore content may have strong correlation with the elevated gamma activity (due to Thorium content), therefore, areas of higher scintillometer readings may indicate high Niobium carbonatite location. Exploration conducted during 2006 and 2007 confirmed the Niobium mineralization and high REE concentration of carbonatite, syenite and related alkaline rocks in the property. The re-sampling of the historic trenches 5 to 7 on the Carbo2 claim returned lower Niobium and REE contents compared to the historic work. Soil geochemical and magnetic anomalies may indicate the presence of buried carbonatite or alkaline intrusions and follow-up work is required to verify this. Alkaline intrusions at the property have a high radiometric background, with up to 8200 CPS. Assay results indicate that the radioactivity is due to the high thorium content. ITEM 22: RECOMMENDATIONS Based on the historic exploration on the Carbo Property and favourable geological setting, the Carbo Property is of sufficient merit to warrant further exploration. The author recommends the following further exploration work: Year 1 • Compile and interpret the existing geological, geophysical and geochemical data in the area. • Only a portion of the property has been mapped. In order to understand the economic potential of the property detailed 1:10,000 geological mapping is recommended, with particular attention - 17 -
- 22. paid to the alkaline intrusions and their relationship to the regional and local structures. Attention should also be paid to the magnetic and radioactive anomalies defined by the 2006 and 2007 surveying. • Prospect the areas that have not been covered in the 2006 and 2007 exploration work, which include the northern part of the Carbo2 claim and the southern part of Carbo3 claim. The magnetic anomaly discovered in 2006 should be verified with rock sampling. • Complete magnetic and radiometric surveys on remaining portions of the property, as these tools in combination with soil sampling have proven to be cost-effective exploration methods for carbonatite and alkaline intrusions. Year 2 • Trenching and channel sampling of potential carbonate and alkaline intrusions below soil and radioactive/magnetic anomalies. Due to the limited exposure of bedrock only limited rock samples have been collected. The size and spatial orientation of these intrusions are still not clear, and trenching will be used evaluate the relevant chemical and physical properties. • Continue to prospect areas that were defined in the geophysical or geochemical prospecting of the exploration in year 1. Year 3 • 500 m AQ backpack drilling in the historic trench area, and other areas identified in the exploration of years 1 and 2. Due to the rough terrain and steep slope, a helicopter will be required to mobilize drill and other heavy equipment. The establishment of an exploration camp in the claim block would also be suggested at this stage of exploration. - 18 -
- 23. Table 3: Proposed Exploration of the Carbo Property Year 1 Exploration compilation of historic data, fieldwork planning $ 7,500.00 Geological Mapping & rock sampling $ 20,000.00 Geophysical surveying and in‐fill soil sampling $ 30,000.00 $ 57,500.00 Year 2 Exploration Geological Mapping & rock sampling $ 20,000.00 Trenching and channel sampling $ 40,000.00 $ 60,000.00 Year 3 Exploration 500 meters AQ core drilling $ 80,000.00 $ 80,000.00 $ 197,500.00 Total - 19 -
- 24. ITEM 23: REFERENCES Armstrong, J.D., Tipper, H.W., and Hoadley, J.W. (1969), Geology of McLeod Lake, British Columbia; Geol. Surv. Can., Map 1204A. Betmanis, A. I. (1987). Report on Geological, Geochemical and Magnetometer Surveys on the Prince and George Groups, Cariboo Mining Division, B.C.; B.C. Min. Energy, Mines Petr. Res. Ass. Rept. 15944. Commerce Resources Corp. (2009) Joint Venture Established for Carbo Rare Earth Property, Corporate News Release dated February 10, 2009. Cullers, R.L. and Graf, J.L. (1984) Rare earth elements in igneous rocks of the continental curst: predominately basic and ultrabasic rocks. In Developments in Geochemistry, Vol. 2: Rare earth element geochemistry, P. Henderson (ed.), Amsterdam: Elsevier, pp. 237-274. GSC, (1964), Geophysics paper 1546. Aeromagnetic Series, Hominka River, B.C. Guo, M and Dahrouge J. (2006), 2006 Exploration at the Carbo Property; B.C. Min. Energy, Mines Petr. Res. Ass. Rept. 28528. Guo, M. (2007) 2007 Exploration at the Carbo Property; B.C. Min. Energy, Mines Petr. Res. Ass. Rep t. 29280. Gorham, J. (2007) 2007 Diamond Drilling and Exploration at the Blue River Property; B.C. Min. Energy, Mines Petr. Res. Ass. Rep t. (currently confidential). Lovang, G. And Meyer, W. (1987). Report on Treching, Stream Silt Concentrate and Soil Sampling on the George Group, Cariboo Mining Division, B.C.; Min. Energy, Mines Petr. Res. Ass. Rept. 16264, Mader U.K. and Greenwood H.(1988) Carbonatites and Related Rocks of the Prince and George Claims, Northern Rocky Mountains. B.C. Ministry of Energy, Mines and Petroleum Resources, Geological Fieldwork 1987, Paper 1988-1, Pages 375-380 Mariano A.N. (1989). Nature of Economic Mineralization in Carbonatites and Related Rocks. In Carbonatites, Genesis and Evolution, Keith Bell (ed.), London, Unwin Hyman Ltd., pp. 149-176. Massey, N.W.D., MacIntyre, D.G., Desjardins, P.J. and Cooney, R.T. (2005) Digital Geology Map of British Columbia: Tile NN10 Central B.C., B.C. Min. Energy and Mines, GeoFile 2005-6; GeoFile Number 2005-6. Richardson, D.G. and Birkett, T.C. (1996). Carbonatite-associated deposits. in Geology of Canadian Mineral Deposit Types, (ed.) O.R. Eckstrand, W.D. Sinclair and R.I. Thorpe; Geol. Surv. Can., Geology of Canada, no. 8, p. 541-558. Wolley, A.R. and Kempe, D.R.C. (1989) Carbonatites: nomenclature, average chemical compositions and element distribution. In Carbonatites, Genesis and Evolution, Keith Bell (ed.), London, Unwin Hyman Ltd., pp. 1-14. - 20 -
- 26. ITEM 25: ADDITIONAL REQUIREMENTS FOR TECHNICAL REPORTS ON DEVELOPMENT PROPERTIES AND PRODUCTION PROPERTIES This section is not applicable to the subject property - 22 -
- 27. ITEM 26: ILLUSTRATIONS
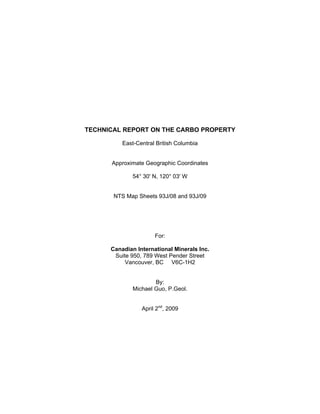
- 28. 123°30'0"W 123°0'0"W 122°30'0"W 122°0'0"W 093J12 093J10 093I12 093J11 Davie Lake 093J09 Property Location 54°30'0"N BRITISH 54°30'0"N Bear Lake COLUMBIA Property Location 093J05 093J06 093J07 093J08 093I05 Summit Lake 54°15'0"N 54°15'0"N 093J04 093J03 093J02 093I04 093J01 54°0'0"N 54°0'0"N CANADIAN INTERNATIONAL MINERALS INC. Figure 6.1 Location Map Prince George 093G13 093G16 0 5 10 093G14 20 093G15 093H13 Cluculz Lake Kilometers NM 1:500,000 2009.03 123°30'0"W 123°0'0"W 122°30'0"W 122°0'0"W
- 29. 122°6'0"W 122°3'0"W 122°0'0"W 54°33'0"N CANADIAN INTERNATIONAL 54°33'0"N 591827 MINERALS INC. Wicheedda Lake Figure 6.2 Property Map 516124 NM 1:40,000 2009.03 516121 591829 Current Carbo Property Spectrum Mining Corp. 515430 516112 CARBO1 54°31'30"N 54°31'30"N 591828 515432 CARBO2 Wic hc ika 536347 CARBO WEST Cr 516117 eek 516115 54°30'0"N 515433 54°30'0"N CARBO3 0 0.5 1 2 598208 Kilometers Coordinate System: NAD 1983 UTM Zone 10 122°6'0"W 122°3'0"W 122°0'0"W
- 30. 556000 558000 560000 562000 564000 566000 CANADIAN INTERNATIONAL MINERALS INC. 6044000 Figure 8.1 Location of Historic Mineral Claims 515430 CARBO1 NM 1:50,000 2009.03 6042000 Current Carbo Property 515432 CARBO2 536347 CARBO WEST 6040000 515433 CARBO3 6038000 0 0.5 1 2 Kilometers Coordinate System: NAD 1983 UTM Zone 10
- 31. 556000 558000 560000 562000 564000 566000 568000 CANADIAN INTERNATIONAL MINERALS INC. 6044000 Figure 8.2 Location of Historic Exploration Grids NM 1:50,000 2009.03 Current Carbo Property 6042000 Other Claims 6040000 6038000 0 0.5 1 2 6036000 Kilometers Coordinate System: NAD 1983 UTM Zone 10