
Recomendados
Más contenido relacionado
Destacado
AthleticsAttendanceReport
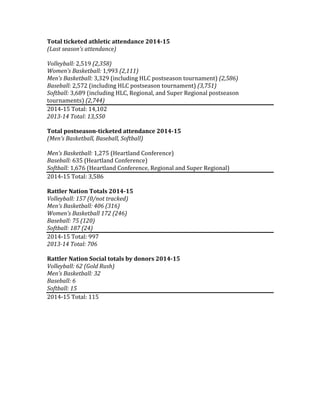
- 1. Total ticketed athletic attendance 2014-15 (Last season’s attendance) Volleyball: 2,519 (2,358) Women’s Basketball: 1,993 (2,111) Men’s Basketball: 3,329 (including HLC postseason tournament) (2,586) Baseball: 2,572 (including HLC postseason tournament) (3,751) Softball: 3,689 (including HLC, Regional, and Super Regional postseason tournaments) (2,744) 2014-‐15 Total: 14,102 2013-14 Total: 13,550 Total postseason-ticketed attendance 2014-15 (Men’s Basketball, Baseball, Softball) Men’s Basketball: 1,275 (Heartland Conference) Baseball: 635 (Heartland Conference) Softball: 1,676 (Heartland Conference, Regional and Super Regional) 2014-‐15 Total: 3,586 Rattler Nation Totals 2014-15 Volleyball: 157 (0/not tracked) Men’s Basketball: 406 (316) Women’s Basketball 172 (246) Baseball: 75 (120) Softball: 187 (24) 2014-‐15 Total: 997 2013-14 Total: 706 Rattler Nation Social totals by donors 2014-15 Volleyball: 62 (Gold Rush) Men’s Basketball: 32 Baseball: 6 Softball: 15 2014-‐15 Total: 115
- 2. 2014-15 Attendance Highlights/Notes Volleyball: • 2014-‐Breast Cancer Awareness Match was highest student/faculty/staff (S/F/S) and total attendance in four years: 2014: 326 S/F/S, 404 total 2013: 237 S/F/S, 273 total 2012: 130 S/F/S, 173 total 2011: 185 S/F/S, 215 total • Highest total attendance was Gold Rush (462), with 228 S/F/S Cost of Gold Rush: Food truck, Inflatables/games, Rattler Nation social, beer, estimated $3,000 • Highest total attendance average in four years: 209.91 2014: 209.91 total, 94 S/F/S (11-‐14 overall record) 2013: 178.5 total, 133.4 S/F/S (14-‐15 overall record) 2012: 181.44 total, 146.11 S/F/S (17-‐12 overall record) 2011: 182.7 total, 157.3 S/F/S (17-‐13 overall record) While average total attendance is increasing each year, student/faculty/staff is steadily decreasing each year, possibly due to overall record • Themed Nights (4): “Class of” Night (180 S/F/S), Gold Rush (228 S/F/S), Breast Cancer Awareness (326 S/F/S), Senior Day (32 S/F/S) • Themed nights with exception of Senior Day saw season’s three highest attendance figures in both total attendance and S/F/S Women’s Basketball: • Four of 12 home games where during Thanksgiving and Christmas/New Years Holiday, one game two days after FA ’15 semester began • Total attendance decreased from 2013-‐15, but total average increased, maintaining steady increase 2014-15: 166.08 total, 46.412 S/F/S 2013-14: 129.73, 53.73 S/F/S 2012-13: 141.2, 48.09 S/F/S 2011-12: 96.79, 46.91 S/F/S • As first season hosting Operation Drive to the Basket for WBB, was one of highest total attendance games of the season (212) • Highest total attendance of season was Senior Day (242) • Highest student attendance was at Spurs Superbox Ticket Giveaway night (120) • Themed Nights (4): Study Break Night (70 S/F/S), Operation Drive to the Basket (85 S/F/S), Spurs Superbox Ticket Giveaway night (120), Senior Day (242 total, 27 S/F/S) • Themed nights with saw season’s four highest attendance figures in total attendance, three themed nights (exclusion of Senior Day) saw three highest S/F/S attendance • Broke over 200 total attendance three times, the most in four seasons • Rattler Nation average decreased (22.36 to 14.33)
- 3. Men’s Basketball: • Four of 12 home games where during Thanksgiving and Christmas/New Years Holiday, one game two days after FA ’15 semester began • Total attendance and total attendance average (188.67 to 221.93) increased from 2013-‐14 • Rattler Nation attendance saw marginal increase • Highest total attendance (combined for entire day) and S/F/S was Heartland Conference Tournament opening game Cost of HLC Tournament opening: Zero for Athletics Provided for event: 100 T-‐shirts ($500) provided by SATP and Dean of Students, Cupcake Food Truck provided by Res Life, Taco Food Truck provided by SATP and Dean of Students (Res Life?) • Highest total attendance other than HLC Tournament was Operation Drive to the Basket (258) and had one of highest attendance from Rattler Nation (52) • Highest Rattler Nation attendance was HLC Championship game (55) • While total attendance (667) was highest in three seasons at HLC Tournament, it did not yield a higher attendance than the rivalry with Incarnate Word in 2011-‐12 (717) Baseball: • Total attendance average increased from 2014 (147.42 to 160.75) • S/F/S decreased attendance may be due to long length of baseball games compared to other sports • One of highest S/F/S attended game was Spurs Superbox Ticket Giveaway game (62), also highest total attendance game other than Spring Fling Chili Cookoff (277) • Highest S/F/S game was Student-‐Athlete Recognition Night, (89), Tuesday night game, 13-‐inning victory in addition to Spring Fling Chili Cookoff • Total attendance decreased from 2014, likely due to high attendance from 2014 Dickson Stadium Grand Opening (estimated 950 fans) Softball: • Total attendance average increased from 2014 (120.4 to 204.94 • Highest total attendance and S/F/S attendance for regular season was Spurs Superbox Ticket Giveaway (199 total, 37 S/F/S) • Neon Night saw one of highest S/F/S attended games • Total attendance increased largely due to hosting of three postseason tournaments • Highest attendance for S/F/S was HLC Championship game (52) • Unclear if berm seating is included in attendance figures. If they are not, berm seating would greatly increase total attendance for the season, as well as averages
- 4. Conclusions: 1.) Themed/Targeted games across all sports are producing highest attended games for both total fans and students, faculty and staff for the season, indicating successful implementation of promotional marketing plan 2.) This season was the first time we’ve had accurate student, faculty and staff numbers because previous years they were lumped together with comps (12U, Pass Lists) 3.) Total attendance increased for all ticketed sports (Vball, M/WBBall, Baseball, Softball), indicating successful marketing strategies 4.) Targeted/themed games yield high attendance figures, but sustainably (loyalty) of fans needs to improve, which will increase averages and total attendance further 5.) Rattler Nation Socials yield no significant increase of donors attending game with the exception of Gold Rush at Volleyball’s Rattler Nation Social 6.) Pass Lists may be discouraging Rattler Nation donations from parents since Pass List allows them free admission 7.) Overall/total Rattler Nation donors attending games increased in 2014-‐15, indicating outreach marketing is working Improvements/Goals: 1.) Continue to outreach students and put more emphasis on outreach to faculty and staff as well 2.) Continue to target games for themed nights during each season 3.) Encourage Rattler Nation donors to attend themed/targeted games or host Rattler Nation socials only at themed nights (Gold Rush, Spring Fling, Rattler Madness is a great event) as these events are what students, faculty and staff are attending the most 4.) Increase efforts to target St. Mary’s alumni to come back to campus for games, Rattler Madness, to increase fan base and loyalty and alumni involvement 5.) Track attendance metrics on more of a weekly/monthly basis for clearer analysis (trying to remember a volleyball game in Sept. in June is more difficult than analyzing it the week after) 6.) Continue to increase total attendance/averages for each sport