
Recomendados
Recomendados
Más contenido relacionado
La actualidad más candente
Destacado
Destacado (12)
Similar a Our Marketing Report
Similar a Our Marketing Report (20)
Our Marketing Report
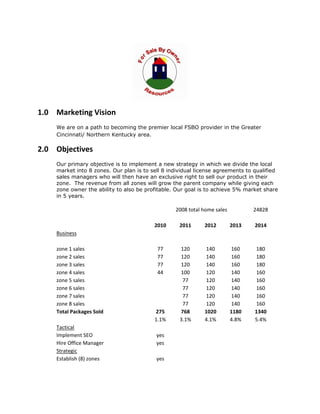
- 1. 1.0 Marketing Vision We are on a path to becoming the premier local FSBO provider in the Greater Cincinnati/ Northern Kentucky area. 2.0 Objectives Our primary objective is to implement a new strategy in which we divide the local market into 8 zones. Our plan is to sell 8 individual license agreements to qualified sales managers who will then have an exclusive right to sell our product in their zone. The revenue from all zones will grow the parent company while giving each zone owner the ability to also be profitable. Our goal is to achieve 5% market share in 5 years. 2008 total home sales 24828 2010 2011 2012 2013 2014 Business zone 1 sales 77 120 140 160 180 zone 2 sales 77 120 140 160 180 zone 3 sales 77 120 140 160 180 zone 4 sales 44 100 120 140 160 zone 5 sales 77 120 140 160 zone 6 sales 77 120 140 160 zone 7 sales 77 120 140 160 zone 8 sales 77 120 140 160 Total Packages Sold 275 768 1020 1180 1340 1.1% 3.1% 4.1% 4.8% 5.4% Tactical Implement SEO yes Hire Office Manager yes Strategic Establish (8) zones yes
- 2. 3.0 Ideal Customer The ideal customer for us is anybody who wants to sell their home and save money in the process. The most important reason for selling a home “For Sale By Owner” is the desire to avoid a commission fee. The 2008 NAR report indicates that 59 percent of sellers who sold without the assistance of an agent were motivated by the desire to avoid a commission or fee. Our marketing packages are designed to help all home sellers achieve this goal. For Sale By Owner Profile The median age of FSBO and Agent-assisted sellers is 47. Agent-assisted sellers are slightly younger (46) and tend to have a higher income. FSBO sellers who knew the buyer of their home tended to be older (49). FSBO sellers who did not know the buyer tended to be younger (46). These demographics describe what we commonly refer to as Generation X. We believe that the FSBO market is moving from an early adopter phase into a new type of market with a new breed of services. This new breed of services must be tailored to helping the Gen Ys through the home selling process. Although Generation X remains a logical target for our services, Generation Y is a critical target for us to cross the chasm and really penetrate the FSBO market in the future. Generation X - The generation born from 1960s to late 1970s. (age 39 - 49) Generation Y - The generation born from 1976 to late 1990s. (age 19 - 33)
- 3. Agent Assisted Seller Profile AGE - The median age of sellers who sold a home between mid-2007 and mid-2008 was 47. Sellers in the Midwest were often somewhat younger, although the variation across regions is relatively narrow. INCOME - The median 2007 income of recent home sellers was $91,000. Sellers in the West reported highest median income at $95,700 while sellers in the Midwest had generally lower incomes with a median of $87,700. HOUSEHOLD COMPOSITION - Married couple households continue to account for three- quarters of home sellers, a long-standing trend. Single person households represented more than one in five recent sellers with single females accounting for the greatest proportion. CHILDREN - Like most buyer households, most sellers (57 percent) have no children under 18 years old at home. Of those with children at home, most have two. RACE AND ETHNICITY - Ninety-two percent of recent home sellers were white. The largest share of minority sellers was in the West where more than one in ten described themselves as non-White, most frequently Hispanic/Latino or Asian. PRIMARY LANGUAGE - By a wide margin, a majority of home sellers indicated that the primary language spoken is English. Regionally, non-English speakers are a somewhat greater share of sellers in the West than elsewhere. REASONS FOR SELLING HOME - The most frequently cited reason for selling a home is job relocation, reported by 22 percent of recent sellers. Selling a home because it was too small was the reason given by 17 percent of sellers and the top reason among sellers aged 44 years or younger. Moving closer to friends or family was the chief reason for selling a home among those 65 or older, cited by one-third of the sellers in this age group. METHOD USED TO SELL HOME – Of the 87% who sold using and agent, 3% first tried to sell it themselves, but then used an agent. Of the 13% who sold home without using a real estate agent or broker, 2% first listed with and agent, but then sold home themselves. TIME ON THE MARKET - The median time on the market for recently sold homes was eight weeks. However, one-third of homes were on the market for 17 weeks or more compared with the one-quarter of home sales reported in last year’s survey. Regionally, the median time on the market varied little. However, time on the market in the Midwest fell from 10 weeks in 2007 to eight weeks in 2008 and rose from six weeks in the West and South in 2007 to eight and nine weeks in 2008, respectively. 4.0 Lead Generation Community Recorders, Metromix, Yellow Pages, Local TV, Community Yellow Cab, High Ranking Search Engines, Craig's List (daily), Homefinder.com, Stand-out Yard Signs, www.NKY.com, Client Testimonials, Community Events, E-newsletters, Flyers, Network of Partners, Email Broadcasts
- 4. 5.0 Critical Numbers Our sales forecast and marketing expense forecasts are shown in the following tables. We believe that our strategy to divide up into zones and to sell licenses will yield the sales that we need to be profitable and to gain market share. 6.0 Sales Forecast and Marketing Expense Budget Even though selling your home is possible all year long, many customers still see it as seasonal. The sales forecast reflects this as our sales rise and fall in the sales of our packages. The sales projections below are for any one zone. Sales projections for any one zone (see financial section) 7.0 Marketing Expense Budget (see financial section) 8.0 Cash Flow Analysis (see financial section) 9.0 The National FSBO Market Share In 2008, All FSBO sales increased marginally to13 percent. At the same time, agent assisted sales decreased slightly to 84 percent from 85 percent one year earlier (2008 NAR Report).
- 5. NATIONAL FSBO TRANSACTIONS: 1987 Total Existing Home Sales = 3,526,000 x 20% = 705,200 1997 Total Existing Home Sales = 4,382,000 x 18% = 788,760 2005 Total Existing Home Sales = 7,075,000 x 13% = 919,750 2006 Total Existing Home Sales = 6,180,000 x 12% = 741,600* 2007 Total Existing Home Sales = 5,652,000 x 12% = 678,240 (NAR EHS Report) 2008 Total Existing Home Sales = 4,913,000 x 13% = 638,690 (NAR EHS Report) What is not indicated within these statistics is how many people actually try to sell their home FSBO? ADDITIONAL MARKET SHARE? The NAR report it indicates that 9% used minimal “MLS only” listings. This “MLS” only option did not really exist just five years ago. This is actually a FSBO who is aggressively marketing his property and paying a small fee to an agent to list the property on the MLS. The NAR appears to be counting this as a REALTOR transaction… We don’t think so. We guess that the “real” number of FSBO’s for 2008 is 22%, which is the 13%, stated by NAR plus the 9% “MLS only” power FSBO. This would mean that the actual number of FSBO transactions for 2008 is closer to: 1,080,860 or 22%. EVEN MORE MARKET SHARE? Additionally, another 9% used a limited service agent, possibly an “ala carte” type service where they paid 2 or 3% commission or just a flat fee for a particular service like negotiation or anything that is beyond the flat fee MLS entry only. There is a very good chance that the people that used these types of companies where originally FSBO. If you consider the traditional FSBO and these alternative / power FSBO’s that means that FSBO type transactions actually amounted to 31% of total homes sold for 2008… which is: 1,523,030 and was probably higher in 2007. Proof is in the NAR report. - 13% FSBO only - 9% MLS only - 9% Alternative / Discount Total = 31% Market Share is alternative / discount / mls only and FSBO Conclusion: Traditional Real Estate Model Actually Losing Ground... may be only 69% Market Share in 2008. We are set to take advantage of this trend!
- 6. 10.0 The Local FSBO Market Share THE TRI STATE MARKET Tri-State Total Home Sales in 2008 were 24,829 (Enquirer Media – Excel workbook). The National Association of Realtors 2008 Profile of Home Buyers and Sellers reports that in 2008, all FSBO sales increased marginally to13 percent of total home sales (see chart above). If we assume that the local figures are collected and reported in the same manner as the NAR figures, and if we assume that the tri-state reflects the national average then we can estimate that in 2008 that the tri-state FSBO market was approximately 13% of total home sales or 3,227. Note: Tri-state area includes Tristate area includes the counties of Butler, Clermont, Hamilton and Warren in OH; Boone, Bracken, Campbell, Carroll, Gallatin, Grant, Kenton, Mason, Owen and Pendleton in KY; Dearborn, Decatur, Franklin, Jefferson, Jennings, Johnson, Ohio, Ripley, Rush, Scott, Switzerland and Wayne in IN. THE TARGET MARKET PER OUR ZONES? Listed below are the eight zones for Cincinnati and Northern Kentucky along with the number of residential properties listed with real estate agents in 2009 thru 10/1/09. These numbers indicate what the potential market can be for 2010. Zone1 – 5,479 Zone2 – 6,241 Zone3 – 4,375 Zone4 – 3,285 Zone5 – 5,109 Zone6 – 4,014 Zone7 – 3,090 Zone8 – 3,797 Conclusion: The Zone figures above represent a large and legitimate market segment that we can target in 2010. It is reasonable to believe that “listings” such as these in 2010 and in subsequent years can be converted to “first time “by owner” home sellers. These figures are the basis for our conservative and sound sales projections. 11.0 Our Current Market Share Our Northern Kentucky operations over the last three years is the best data from which we have to gage our performance. In 2006 we booked (17) packages. In 2007 we booked (44) packages. In 2008 we booked (58) packages. Tri-State Total Home Sales in Kentucky in 2008 were 5,126 (Enquirer Media – Excel workbook).
- 7. The National Association of Realtors 2008 Profile of Home Buyers and Sellers reports that in 2008, all FSBO sales increased marginally to13 percent of total home sales. If we assume that the local figures are collected and reported in the same manner as the NAR figures, and if we assume that the tri-state reflects the national average then we can estimate that in 2008 that the tri-state FSBO market in Northern Kentucky was approximately 13% of total home sales or 666. This means that we accounted for 1% of the FSBO market in 2008. 12.0 Economic Factors Much of the recent news regarding the mortgage meltdown and waves of possible foreclosures due to individuals who can’t refinance and can’t sell due to lack of equity raises the question if more people will sell their homes “For Sale by Owner”. In August of 2009 the National Association of Realtors reported "existing home sales" dropped 2.7% from July. This is no surprise and should not be a shock. For the next 15-18 months, we anticipate months of increases along with months of decreases. Meaning, the industry as a whole will not see 12 straight months of non-stop increases. The weak economy, unsteady housing market, weak job prospects, and foreclosure volumes will combine to make the housing market uncertain and a bit unpredictable. That said, we believe consumers have the opportunity and power to sell their properties if they know and understand their market. Today, more than ever, consumers who sell their home via the For Sale By Owner process have more access to resources, knowledge and information to correctly price their home. In this market, selling For Sale By Owner gives you an extra 6% of pricing power against your competition. Example: If you competition is listed at $300k, price your home at $295k. Your competitor who is using an agent will only take home $282k ($300 - $18k in commissions) so you come out way ahead. Conclusion: We think that the number of FSBO listings will increase over the next few years due to a few reasons. We think this increase will be fueled by a “need” not a “desire” to sell FSBO. Here are some of the scenarios where homeowners will attempt to sell their homes for sale by owner. (http://www.forsalebyownercenter.com/blog/) - Homeowners with little or no equity will be facing foreclosure. They may need to sell FSBO because they don’t have at least 10% equity in their homes to pay the real estate agent commissions and they don’t want to incur the possible tax liability of a real estate short sale. - Homeowners with adjusting sub-prime loans that don’t qualify for the new FHA Secure refinance. After the first adjustment of their ARM mortgages these individuals realize they cannot afford the home and cannot refinance. They will tend to try and sell FSBO again due to a lack of equity.
- 8. - Tightening underwriting standards may cause sellers to sell by owner to protect net proceeds from sell. Appraisals will come in short or get cut by some lenders. Some of these sellers may try to sell FSBO after the initial transaction cancels, eliminating the real estate commission they can drop the price but maintain their net proceeds. 13.0 How FSBO Sellers will sell their current home Does selling For Sale By Owner work? Many real estate agents lead consumers to believe that those who attempt to sell a home FSBO and those that do will use a real estate agent the next time. According to the 2008 NAR Profile of Home Buyers and Sellers, FSBO's where asked if they would sell by owner the next time. Here are the results if they did not know their buyer personally. ‐ Yes, will go FSBO again: 24.5% ‐ Not sure: 46% ‐ No, will use an agent next time: 29.5% Surprised... 24.5% of for sale by owners, indicated they would do it again! The other 46% was "not sure" but obviously the experience / savings were good enough for most to consider going FSBO again. That is 70.5% of FSBO's will or may do it again. Sure, only 29.5% indicated that they would use a real estate agent the next time but this does not support the horror stories that the real estate community shares regarding FSBO wishing they had used an agent. What was interesting is that if the FSBO seller sold it to someone they knew, the stats reflected a total of 62% (46% + 16%) will or may sell FSBO again, while 38% would use an agent. We guess that if they did use an agent it would be at a discount, considering they did find the ready and willing buyer.
- 9. 14.0 Industry Opportunities Our analysis shows a large opportunity for For Sale By Owner Resources in the underserved process guidance section of the market. Process guidance has been defined as a type of home selling consultation service that focuses on essential legal and process tasks, as opposed to finding home sellers and buyers. As indicated in the following chart, there is a high projected market need for these services, mainly due to the fear associated with selling a home without any help. Sellers are frustrated with high commissions of realtors, but there is little other choice in the market if a seller is looking for help (as indicated by the red line showing the percent current market share). Appendix E provides more detail and traces the lineage of this analysis in a step by step format. From this analysis, it is evident that the biggest threat facing For Sale By Owner Resources is trying to compete directly with larger providers on technology, brand and visibility. There is a place for niche players in the market and the key is to capitalize on this niche.
- 10. 15.0 Web Site Traffic Conclusion: As technology and websites like NKYHomeForSale.com and CincyHomeForSale.com makes the FSBO transaction easier, we feel that the FSBO market will continue to grow. We also believe that the “FSBO” and “MLS Only” discount models will continue to build on their current 31% market share and probably continue to increase within the next few years. Especially since most successful FSBO home sellers are already willing to do it again and reap the rewards of significant real estate commissions savings and equity protection.
- 11. 16.0 Appendix 2008 NAR Sellers and Buyers Profile NAR EHS Report Enquirer Media – Excel workbook (http://www.forsalebyownercenter.com/blog/)