1. June 2015
Chart of the Month
Gareth Lewis
CHIEF INVESTMENT OFFICER
Louie French
RESEARCH ANALYST
MARKET COMMENTARY
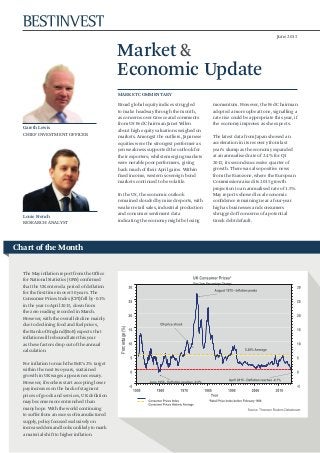
The May inflation report from the Office
for National Statistics (ONS) confirmed
that the UK entered a period of deflation
for the first time in over 50 years. The
Consumer Prices Index (CPI) fell by -0.1%
in the year to April 2015, down from
the zero reading recorded in March.
However, with the overall decline mainly
due to declining food and fuel prices,
the Bank of England (BoE) expects that
inflation will rebound later this year
as these factors drop out of the annual
calculation.
For inflation to reach the BoE’s 2% target
within the next two years, sustained
growth in UK wages appears necessary.
However, if workers start accepting lower
pay increases on the back of stagnant
prices of goods and services, UK deflation
may become more entrenched than
many hope. With the world continuing
to suffer from an excess of manufactured
supply, policy focused exclusively on
increased demand looks unlikely to mark
a material shift to higher inflation.
momentum. However, the Fed Chairman
adopted a more upbeat tone, signalling a
rate rise could be appropriate this year, if
the economy improves as she expects.
The latest data from Japan showed an
acceleration in its recovery from last
year’s slump as the economy expanded
at an annualised rate of 2.4% for Q1
2015, its second successive quarter of
growth. There was also positive news
from the Eurozone, where the European
Commission raised its 2015 growth
projection to an annualised rate of 1.5%.
May reports showed local economic
confidence remaining near a four-year
high as businesses and consumers
shrugged off concerns of a potential
Greek debt default.
Broad global equity indices struggled
to make headway through the month,
as concerns over Greece and comments
from US Fed Chairman Janet Yellen
about high equity valuations weighed on
markets. Amongst the outliers, Japanese
equities were the strongest performer as
yen weakness supported the outlook for
their exporters; whilst emerging markets
were notable poor performers, giving
back much of their April gains. Within
fixed income, western sovereign bond
markets continued to be volatile.
In the US, the economic outlook
remained clouded by mixed reports, with
weaker retail sales, industrial production
and consumer sentiment data
indicating the economy might be losing
Percentage(%)
Market &
Economic Update
2. June 2015
Our view – asset allocation summary
GENERAL SUMMARY
• Over the last seven years Central banks across the developed world have added over US$7 trillion
of additional liquidity to the global economy in an attempt to stave off the worst effects of the
banking crisis. While this stimulus has helped prevent a more severe downturn in activity, it is
clear that much of this monetary largesse has become trapped within the financial system.
• While the flow of liquidity will dwindle now the US Federal Reserve has ended its asset-purchase
programme, the pace of reduction will be mollified by the stimulative policies being pursued
within the Eurozone and Japan.
• The recent increase in bond and currency market volatility points to investor uncertainty over how
these two forces will play out.
EQUITIES
• Following the prolonged rally in prices most equity markets now look fair value relative to their
own history. The outlier is probably the US where the combination of aggressive share buybacks
and debt refinancing has driven corporate margins to historic highs.
• In contrast Eurozone equities valuations remain realistic, reflecting the more subdued levels of
economic activity. However, as ECB QE increases liquidity flows and pushes down the currency,
we would expect the region’s equity markets to benefit as investors reappraise prospects.
• Despite their strong performance last year, Japanese equities continue to look good value as rising
corporate earnings and strong investor flows sustain prices.
• We are cognisant that investment in the UK market exposes performance to commodity prices
from the large-cap mining stocks based here, but believe that much of the concern is already in
the price. The UK market also offers income in this low-growth, low-inflation environment.
• There is a performance differential between Emerging Markets and Asia Pacific, with the former
more closely correlated to commodity prices. Additionally, there is increasing dispersion between
country and region in terms of valuation and returns, with many Asia Pacific currencies pegged
to the US dollar, and competitiveness being eroded in the face of Japan and devaluation of
its currency.
FIXED INCOME
• As expected Eurozone bond markets have responded to the ECB asset purchase programme by
selling off aggressively. QE is an inherently pro-growth and pro-inflation policy which does not sit
easily with the low yields on offer across Europe during Q1.
• One worrying aspect that this has highlighted is the deteriorating conditions for all world bond
markets, with falling prices rapidly transmitting elsewhere, despite more rational valuations.
The resulting rise in yields in both the US and the UK leave Government bond markets in these
countries look realistically priced for the current uncertain economic climate.
• Emerging market hard currency debt is a concern, across sovereign, corporate and bank debt.
Many of these countries are commodity dependent, and the continued strength of the US dollar
is seen as a negative. There is a lack of liquidity in this market, which is likely to be accentuated
during risk-off periods.
• The Asset Allocation Committee reduced the weighting to fixed income by 3% in May adding the
3% to cash. High yield was reduced by 1.5% with the lack of liquidity in the high yield market a
particular concern.
COMMERCIAL
PROPERTY
• Commercial property prices remain well below their 2007 highs, and the IPD forecasts are positive.
The UK economy is relatively strong and property returns are believed to be more attractive. We
are overweight UK commercial property.
COMMODITIES • We believe the asset class remains relatively unappealing, even more so due to US dollar strength.
Market & Economic Update
2 Market & Economic Update • June 2015
3. NORTH AMERICA, UK AND WESTERN EUROPE
jobs data was positive in the month,
with the US non-farm payrolls data
showing 223,000 jobs were created
in April. The unemployment rate
was down from 5.5% to 5.4%, whilst
wages were up by only 0.1% month on
month. Retail sales were flat on the
previous month, missing expectations
of a 0.2% increase. Meanwhile the
Fed Chairman Janet Yellen adopted
a more upbeat tone, signalling in her
latest speech that a rate rise could be
appropriate this year, if the economy
improves as she expects.
• In the UK the second estimate of GDP
growth in the first quarter of 2015
disappointed, with growth confirmed
at only 0.3%, its lowest level since the
fourth quarter of 2012. The extent to
which the first quarter GDP figures
were affected by political uncertainty
is yet to be seen, but the Bank of
England did lower its UK growth
forecast in its quarterly inflation
report released in May. The BoE
estimates that full-year GDP growth
will be around 2.5%, down from the
2.9% estimated in February, and has
similarly downgraded the forecasts
for 2016 and 2017. However, in the
supporting commentary the BoE
did state that the outlook for growth
remains solid and that it expected
inflation to pick up towards the end
of the year (see chart of the month
text). Other data releases in May were
more positive on the health of the UK
economy. Firstly, the UK continued
its recent trend of strong job creation,
with the unemployment rate falling
again by 0.1% to 5.5%, whilst average
wages rose by 1.9% year on year. UK
retail sales were also up, rebounding
strongly in April and smashing
forecasts, with volumes up 1.2%
month on month and 4.7% year on
year. UK manufacturing PMI for May
remained in expansionary territory.
However, productivity growth and the
trade deficit remain a challenge for the
UK economy, as the rebalancing of the
UK economy remains a slow process.
• European economic data showed
signs of improvement as first quarter
GDP expanded by 0.4%, up 1%
from the same quarter last year. A
combination of low inflation and a
weaker euro – linked to the European
Central Bank’s quantitative easing
programme – clearly providing a boost
to the bloc’s fortunes as household
expenditure rose. Notable country
performance came from France,
which beat expectations by growing
0.6% in the first quarter. With
periphery countries such as Spain also
showing signs of improvement, the
European Commission has raised its
growth forecast for the Eurozone in
2015 to an annualised rate of 1.5%.
Flash estimates of May’s inflation data
were also up, with headline inflation
up from zero to 0.3% year on year, as
the price of food and services showed
modest increases. Core inflation,
which excludes energy, food, alcohol
and tobacco, was also up to 0.9% year
on year. However, with unemployment
in a number of countries still high
and the well reported Greek debt
crisis showing few signs of reaching a
resolution, the Eurozone bloc needs a
continued spell of economic growth.
The extent to which loose monetary
policy from the ECB will help the
underlying economies in the long run
is yet to be seen.
DEVELOPED EQUITY
MARKET VALUATIONS:
S&P 500 – PE: 20.4x, Yield: 2.1%
FTSE All Share – PE: 16.0x, Yield: 3.3%
*DataStream Total European Market –
PE: 18.0x, Yield: 3.0%
*Includes the UK.
• Developed market equities struggled
to make headway in May, with the
FTSE 100 TR returning only 0.72%
in the month. After a strong month
in April, key large-cap sectors, such
as basic materials and oil & gas,
were down in May, returning on a
total return basis -2.60% and -3.48%
respectively. UK mid and small caps
delivered stronger returns in May as
investor confidence in the UK rose
following the Conservative’s surprise
majority victory in the UK General
Election. The FTSE 250 TR was up
4.20% over the month, whilst the
FTSE Small Cap TR returned 3.20%.
• Meanwhile, in Europe the FTSE World
Europe ex UK TR index returned
1.30% in local currency terms and
-0.19% in sterling terms, highlighting
a weaker month for the euro versus
sterling. The earnings outlook for
European equities appears much
brighter, but uncertainty over Greece
continues to dampen investor
confidence. In the US the S&P 500 TR
was up 1.29% in local currency terms
and 2.0% in sterling terms in May.
• In the US, the economic outlook
remained clouded by mixed reports.
Firstly, already weak Q1 GDP data was
revised down from an annualised rate
of 0.2% to -0.7%, as a strong dollar
and unfavourable weather conditions
saw GDP growth drop dramatically
from the 2.2% recorded in the fourth
quarter of 2014. The Chicago PMI,
which is a leading economic indicator,
was also sharply down in May, falling
to 46.2 from 52.3 in April, casting
doubts over the expected rebound
of the US economy in the second
quarter of 2015. However, the latest US
Source: FactSet
Performance(%)
DEVELOPED MARKETS, PERCENTAGE GROWTH, TOTAL RETURN
FTSE 100 TR S&P 500 TR FTSE World Europe ex UK TR
Dec 14 Jan 15 Feb 15 Mar 15 Apr 15 May 15
90
95
100
105
110
115
120
Market & Economic Update
3
4. ASIA, JAPAN AND THE EMERGING MARKETS
Source: FactSet
Performance(%)
MSCI AC Asia Pacific ex Japan TR
Topix TR
MSCI Emerging Markets TR
ASIAN & EMERGING MARKETS, PERCENTAGE GROWTH, TOTAL RETURN
Dec 14 Jan 15 Feb 15 Mar 15 Apr 15 May 15
90
95
100
105
110
115
120
125
sterling terms. In US dollar terms,
the MSCI AC Asia Pacific ex Japan TR
index was down -2.65%, whilst the
MSCI Emerging Markets TR index
fell -3.99%. Notable poor performers
in the Emerging Markets were
the Brazilian and Russian equity
markets, which fell -11.7% and -5.7%
respectively in US dollar terms. In
Asia the Shanghai Composite index
was again one of the strongest
performers over the month rising
4.0% in US dollar terms. However,
with the MSCI still not including
domestic Chinese A shares in its
index calculations, the MSCI China
TR was down -3.69% in May following
a weaker month for Hong Kong’s
Hang Seng index and highlighting
some of the complexities of investing
in China.
• Staying in China, the People’s Bank of
China cut interest rates for the third
time in six months as its economy
continued to show signs of slowing.
The Central bank cut the benchmark
deposit and lending rates by 25bps
whilst at the same time also relaxing
some of the controls around interest
rates as part of another step towards
rate liberalisation. The news followed
softer-than-expected inflation data,
which was 1.5% year on year, and
the latest producer price index data,
which was down -4.6% year on year.
The Chinese property market also
continued to show signs of weakness,
with the average house price down
-6.1% from a year ago.
Topix PE: 19.7x, Yield: 1.6%
• Japanese equities led the way
again in May, with the Topix TR
returning 5.08% in local currency
terms and 2.05% in sterling terms.
With the Nikkei 225 index above
20,000 index points for the first
time in 15 years and the yen trading
around its ten-year low versus the
US dollar, Japanese equities have
evidently been supported by the
Bank of Japan’s asset-purchase
programme. Additionally, with a
number of Japanese pension funds
reportedly set to transfer a large
percentage of their asset allocation
from government bonds to domestic
stocks, this momentum appears set
to continue.
• On the economic front, the latest
data from Japan showed an
acceleration in its recovery from
last year’s slump as the economy
expanded at an annualised rate of
2.4% in the first quarter of 2015,
its second-successive quarter of
growth. Lower oil prices and higher
investment income have also resulted
in Japan having its largest current
account surplus in seven years at ¥2.8
trillion. The labour market continued
to tighten with the unemployment
rate falling again in April to 3.3%.
• Outside Japan, broader Asia Pacific
and Emerging Market indices had
a poor month after performing
strongly in April. The MSCI AC Asia
Pacific ex Japan TR index returned
-2.0% and the MSCI Emerging
Markets TR index returned -3.3% in
Market & Economic Update
4
Market & Economic Update
5. June 2015
Source: FactSet
BofA Merrill Lynch Global High Yield TR
BofA Merrill Lynch Sterling Corporate Bond TR
Performance(%)
FIXED INTEREST MARKETS, PERCENTAGE GROWTH
Dec 14 Jan 15 Feb 15 Mar 15 Apr 15 May 1594
96
98
100
102
104
106
108
• In Europe bond yields continued to
rise amid the backdrop of the ECB’s
inflationary quantitative easing
programme and the ongoing
Greek debt crisis. German 10-year
bund yields rose 18bps in May,
starting the month at 0.36% before
finishing May at 0.54%. Yields had
reached 0.73% in the middle of
the month.
FIXED INCOME
• The BofA Merrill Lynch Sterling
Corporate Bond TR and the
BofA Merrill Lynch Global High
Yield TR indices were both up
moderately in sterling terms during
May, returning 0.5% and 0.7%
respectively.
• However, May was a subdued
month for high yield returns in
local currency terms following a
relatively strong start to 2015. The
BofA Merrill Lynch Global High
Yield TR index returned 0.04% in
May and is up 2.90% year to date in
US dollar terms.
• Meanwhile, the removal of political
uncertainty following the UK
General Election was positive for
gilts in May, with the Barclays
Sterling Gilt TR index returning
0.45% over the month. UK 10-year
gilt yields ended the month roughly
where they began at around 1.86%,
but had reached 2.0% in the middle
of the month before a late rally.
• US treasuries experienced similar
movements to their European
counterparts in May, with US
10-year yields finishing the month
15bps up at 2.18%, after reaching
2.29% towards the middle of
the month.
Market & Economic Update
6. June 2015
CURRENCIES
• After a weak month in April, the US
dollar was up 0.70% versus sterling
in May, with sterling starting the
month strongly following the
Conservatives surprise election
result before weakening against the
dollar towards the end of the month
as US interest rate expectations rose.
• Meanwhile, the euro and the
Japanese yen were weak in May, with
the backdrop of their individual
quantitative easing programmes
continuing to impact currency
valuations. The euro was down
-1.47% in sterling terms and -2.16%
in US dollar terms, whilst the
Japanese yen fell -2.88% in sterling
terms and -3.57% in US dollar terms.
• Lastly, the Russian rouble was down
-1.92% against the US dollar in May,
as its rebound from a weak 2014
showed signs of slowing.
Dec 14 Jan 15 Feb 15 Mar 15 Apr 15 May 15
85
90
95
100
105
110
Source: FactSet
Euro
Japanese yen
US dollar
Performance(%)
CURRENCY RETURNS RELATIVE TO GBP, PERCENTAGE GROWTH
Market & Economic Update
6 Market & Economic Update • June 2015
7. COMMODITIES PERFORMANCE – 1st
- 31st
MAY 2015
Index Total Return Level % Change
-12 -10 -8 -6 -4 -2 0 2 4 6
Aluminum
Nickel
Sugar
Coffee
Natural Gas
Copper
Cotton
Soybeans
Brent Crude
Corn
Bloomberg Commodity Index
S&P GSCI
Platinum
Heating Oil
Gas Oil
Crude Oil
Kansas Wheat
Wheat
Unleaded Gas
Live Cattle
Lean Hogs
Silver
Feeder Cattle
Cocoa
Gold
Zinc
Lead
COMMODITIES
S&P GSCI Industrial Metals sector,
which fell dramatically by -7.70%
after a positive month in April. The
Agriculture and Energy sub-sectors
were also down in the month, falling
-3.49% and -0.64% respectively. The
Livestock and Precious Metals sub-
sectors produced positive returns of
1.87% and 0.93% respectively.
• Unsurprisingly, the worst-performing
individual commodity indices in
May were Aluminium and Nickel,
which like a number of commodities,
have seen their prices fall as supply
continues to outweigh demand,
particularly from China.
• After leading the way in April, the
individual oil commodity indices
were down moderately in May on a
total return basis. Prices rose towards
the end of the month following news
of further reductions in the US rig
count, but with little prospect of
OPEC cutting production, prices are
unlikely to rise dramatically in the
near future without some form of
geopolitical crisis occurring.
• Overall May was a weak month for
commodity markets, with only a
relatively small number of individual
commodity indices producing
positive returns.
• The two headline indices, the
Bloomberg Commodity index and
the S&P GSCI index, had previously
produced positive returns in April.
However, both were down in May,
falling -2.70% and -2.00% respectively
in US dollar terms.
• Performances of the S&P GSCI sub-
sectors were mixed in May, with
the worst returns coming from the
Commodity monthly performance, May 2015. Indices highlighted in yellow. Data in the above table in US dollars. Source: FactSet
Market & Economic Update
7 Market & Economic Update • June 2015
8. June 2015
Source: FactSetHFRX Global Hedge Fund GBP
Performance(%)
HEDGE FUND RETURNS, TOTAL RETURN
Dec 14 Jan 15 Feb 15 Mar 15 Apr 15 May 15
96
97
98
99
100
101
102
103
HEDGE FUNDS
• May was a relatively flat month for
the HFRX sub-indices, with returns
ranging from 0.34% to -1.01% in
sterling terms.
• The worst-performing sub-index in
the month was the HFRX Equity
Market Neutral returning -1.01% in
sterling terms.
• The best-performing sub-index in
May was the HFRX Macro/CTA, which
returned 0.34%.
• The headline index, the HFRX Global
Hedge Fund GBP, returned 0.3%
in May.
Source: FactSet
0
0.5
1
1.5
2
2.5
Performance(%)
Capital growth
Income return
Jul 14Jun 14 Aug 14 Sep 14 Oct 14 Nov 14 Dec 14 Jan 15 Feb 15 Mar 15 Apr 15
MONTHLY IPD RETURNS*
Source: FactSet
0
0.5
1
1.5
2
2.5
Performance(%)
Capital growth
Income return
Jul 14Jun 14 Aug 14 Sep 14 Oct 14 Nov 14 Dec 14 Jan 15 Feb 15 Mar 15 Apr 15
MONTHLY IPD RETURNS*PROPERTY
• The IPD UK Property Monthly Total
Return index increased by 0.99%
in April, compared to 1.3% in the
previous month.
• Whilst income returns remained
stable at 0.46%, capital returns were
down from 0.83% in March to 0.53%
in April.
• The Office and Industrial sectors
were once again the best performing
in April, increasing by 1.4% and 1.2%
respectively on a total return basis
over the month. The Retail sector
produced a total return of 0.6%
in April.
*Index data is released mid-month and therefore figures are only available
with a one month lag.
Market & Economic Update
8 Market & Economic Update • June 2015
10. IMPORTANT INFORMATION
The value of your investments, and the income derived from them, can go
down as well as up, and you can get back less than you originally invested.
Any indication of past performance or quoted yields is not an indicator of future
returns. Before investing in funds, please check the specific risk factors on the key
features document or refer to our risk warning notice, as some funds can be high-
risk or complex, or can be susceptible to risks particular to the geographical area or
industry sector in which they invest. Prevailing tax rates and relief are dependent on
your individual circumstances and are subject to change.
Any research or analysis contained in this document has been undertaken by us for
our own use and may be acted on in that connection. The contents of the document
are based on sources of information believed to be reliable; however, save to the extent
required by applicable law or regulations, no guarantee, warranty or representation
is given as to its accuracy or completeness. The document may include forward-looking
statements which are based on our current opinions, expectations and projections.
It is provided to you only incidentally, and should not be considered a personal
recommendation or advice to invest. Any opinions expressed are subject to change
without notice.
150615-1415
Market & Economic Update
10 Market & Economic Update • June 2015
Bestinvest (Brokers) Limited (Reg. No. 2830297) and Bestinvest (Consultants) Limited(Reg. No. 1550116)
are both registered in England and are authorised and regulated bythe Financial Conduct Authority.
Registered office: 6 Chesterfield Gardens, Mayfair, London W1J 5BQ.