SlideShare una empresa de Scribd logo
1 de 1
Descargar para leer sin conexión
IT as a Value Added Component of Teaching and Learning: Excerpts from a Path Analysis
                                          Martin E. Sandler, Ph.D., Assistant Director, Assessment, TLTC, Seton Hall University


           Abstract: Student attitudes and perceptions of the use of instructional technology are mapped in a structural equation model derived from survey data and an instrument
           developed in part on the principles of undergraduate practice of Chickering & Gamson (1999) and the capacity of computer environments as a tool for enhancing learning
                   (Azevedo 2005). IT Academic Use, Course Learning Management, and IT as a Value Added component of teaching and learning are focally examined.


      Introduction and Conceptual Framework                                        Excerpts from a path analysis are focally examined including                                                                                     Discussion and Conclusion
                                                                                   IT Academic Use (R2 = .158) with eight total effects, Course
A path analytic procedure was conducted on survey data yielding a                  Managements Improves Learning, (R2 = .584) with five total effects,                                                         By employing path analysis derived from reliable measures,
structural equation model as a means to map the experience of                      and IT Value Added for learning (R2 = .195), the criterion dependent                                                        assessment can assist practitioners and faculty in understanding the role of
undergraduate learners using technology. The survey examined how                   variable in the model, with six total effects (see Figure 1). Total                                                         IT as a value added component of undergraduate education. Path analysis
technology affected learning inside and outside the classroom and was in part      effects are assumed to be causal such that the cause precedes the                                                           empowers the assessment professional with skills to address the call for
based on the principles of undergraduate practice of Chickering & Gamson           effect in direction and temporal order.                                                                                     accountability made by accrediting bodies with reliable measures. In this
(1999) and the capacity of computer environments as a tool for enhancing                                                                                                                                       instance clear evidence was obtained about the focal variables examined
learning (Azevedo 2005).                                                           Accordingly, the largest total effect arose from students’                                                                  and in particular of IT as a value added component of academic life.
                                                                                   Math and Verbal SAT Score AT .859 (p < .001), that is, for every unit
A structural model was determined from measurement data to                         increase in Cumulative GPA there is a corresponding eighty-six (86)                                                         Importance and Relevance to Other Institutions
explore the impact of technology on Academic Performance (Cumulative GPA),         percent increase in students’ SAT scores. The SAT proved to be a very                                                       By mapping and tracing effects using path analysis, structural
IT Academic Usage, Course Learning Management, and IT Value Added, four            strong contributor/predictor of the explained variance of Cumulative                                                   equation modeling enables assessment professionals, instructional designers,
focal variables in a path analysis that included twenty-four (24) variables. For   GPA totaling seventy-nine (79 )percent.                                                                                and faculty to explore survey data through a powerful new lens close to the
ease of understanding the reader may interchange the meaning of IT to                                                                                                                                                                                     respondents’ experience,
represent Information Technology or Instructional Technology.                                                                                                                                                                                             thereby explaining elements of
                                                                                           GENDER                                                                                                                                                         teaching and learning with
    Methodology, Sample and Data Reduction                                                   X1
                                                                                                                                                                                                                                                          technology with greater clarity.
                                                                                           ETHNICITY/                                                                                                                                                     The findings confirm the
Eleven hundred fifty-two (1152) undergraduate students were                                  RACE
                                                                                                                                                                                                      - .120
                                                                                                                                                                                                                       Endogenous                         ongoing importance of the
                                                                                                                                                                                                                         Variables
                                                                                              X2                 IT USE NON -
included in an on-line survey administration during the spring 2008 semester.                                                                            IT SKILL LEVEL
                                                                                                                  ACADEMIC
                                                                                                                                                  .317          Y5                 .119***
                                                                                                                                                                                               COURSE MGMT.
                                                                                                                                                                                                                                                          principles of Chickering &
                                                                                           PARENTS’
With a forty-four (44) percent online survey response rate, the sample for                EDUCATION                  2
                                                                                                                      Y1                                    R2 = 0.114
                                                                                                                                                                                  .261           IMPROVES                                                 Gamson (1999) and the utility
                                                                                          AL LEVEL X3              R = 0.078
analysis included (N=509).                                                                                                                                                                      LEARNING/Bb
                                                                                                                                                                                                          2
                                                                                                                                                                                                                                                          of computer environments as a
                                                                                                                                                                                   .665          Y9 R = 0.584
                                                                                          HOUSEHOLD
                                                                                                                                                         .104
                                                                                                                                                                    .666                            .212                          .228
                                                                                                                                                                                                                                                          tool for enhancing learning
                                                                                           INCOME X4                                                        .179
After a principal components analysis of the survey data, eleven                                                                                                                                   .081***                                                (Azevedo 2005).
                                                                                                                                                         CLASSROOM                                                         .072                             .081***
reliable measures were determined with coefficients between .68 and .89.                  PREFERRED              IT DISTRACTS/                           MEDIA IMPRS.
                                                                                                                                                                             .163
                                                                                                                                                                                                                                .497
                                                                                                                                                                              .079***
Subsequently, twenty-four (24) variables were included in the path analysis               LEVEL IT IN
                                                                                          COURSE X5
                                                                                                                    IMPEDES
                                                                                                                 LEARNING Y2
                                                                                                                               - .112
                                                                                                                                                         LEARNING Y6
                                                                                                                                                                2                                                              - .108
                                                                                                                                                                                                                                                                     .085                               References
                                                                                                                                                            R = 0.246
that included twelve (12) endogenous; eleven arose from the subscale factors                                       R2 = 0.001                     .443                                            IT TEAM
                                                                                                                                                                                                                                                IT-VALUE

addressed. Cumulative GPA was added as the twelfth endogenous variable;                    VERBAL &                                                                  -.133                     COORDINATION                    - .173
                                                                                                                                                                                                                                                 ADDED                                            Azevedo, R. (2005).
                                                                                           MATH SAT                                                                                                                                                Y12
twelve (12) exogenous variables denoting student background were included.                    X6
                                                                                                                  .072
                                                                                                                                                                                                     Y10
                                                                                                                                                                                                                      .062**                    R2 = 0.195                                        “Computer Environments as
                                                                                                                                                                                                      R2 = 0.047
                                                                                          ACADEMIC
                                                                                                        - .391
                                                                                                                         - .436**
                                                                                                                                       .162
                                                                                                                                                                                               .212                                     .505                                                      MetacognitiveTools for
                                                                                                                                                         SATISFACTION                                                                                 .331
                                                                                          ASPIRATION
                                                                                                                                                         WITH WIRELESS                                                                                                                            Enhancing Learning,”
               Structural Equation Modeling                                                   X7                    IT USE
                                                                                                                   ACADEMIC
                                                                                                                                           .308           NETWORK Y7                                                                                                                              Educational Psychologist,
                                                                                                                       Y3                                   R2 = 0.027
Descriptive, transformational, and inferential statistics were
                                                                                          YEARS TO
                                                                                           COLLEGE                  R2 = 0.158
                                                                                                                                                                                                      - .296                                                                                      40(4), 193-197.
                                                                                          DEGREE X8      .108                                                                                 CUMULATIVE
                                                                                                                                                                                        .253
obtained using SPSS 16. Structural Equation Modeling (SEM) using a weighted                                       - .164            .165
                                                                                                                                                                                              GRADE POINT
least squares (WLS) estimator followed by employing LISREL 8.80 after a                   CUMULATIVE                                                                                    .859 AVERAGE - GPA                      b                                                                 Chickering, A.W. and
                                                                                             HOURS                                                                                                                                  The conventional syntax used in
                                                                                                                                                                                               Y11 R2 = 0.785
pretreatment phase with PRELIS 2.50. As a simple indication of Model Fit, the              PASSED X9
                                                                                                                                                           DIVERSE
                                                                                                                                                                                                                                    path diagrams may be deviated                                 Gamson, Z.F. (1999).
                                                                                                                                                                                           - .162                                      from in order to simplify
ratio of Chi-Square / degrees of freedom = 50.335/193 = 0.261 providing                                                                                   TALENTS Y8
                                                                                                                                                                                                                                            representation.
                                                                                                                                                                                                                                                                                                  “Development and
                                                                                            HOURS                SATISFACTION                               R2 = 0.035
evidence of a fine fit; ratios below 2.00 are recognized as very good.                      STUDY
                                                                                             X10
                                                                                                                 WITH LAPTOP                                                                                                                                                                      Adaptations of the Seven
                                                                                                                      Y4                                                                                                                                                                          Principles for Good Practice in
                                                                                                                    R2 = 0.008                                                   Chi-Square with 193 degrees of freedom = 50.335 (p = 1.000). All total effects represented
                                Findings                                                    HOURS
                                                                                          EMPLOYED                                                                                 are significant atp <.001 with the exception of those marked * at p <.01, ** at p < .02,                       Undergraduate Education,”
                                                                                             X11                                                                                   and *** at p < .05 ; total effects <.060 are trimmed and not represented. A dashed line                        New Directions for Teaching
Total effects are mapped in the course of a Path Analysis. Six (6) out                                                                                                           represents a non-significant effect. The figure presented serves as a final structural model.
                                                                                                                                                                                                                                                                                                  and Learning, no. 80, Winter
                                                                                           HOUSING/
of twelve (12) endogenous variables of the structural model had notable levels                           Exogenous                                                                                                                                                                                1999.
                                                                                          COMMUTING
                                                                                                                                    Figure 1: 2008 Teaching and Learning with Technology Survey
of variance explained, between eleven (11) and seventy-nine (79) percent. In                 X12
                                                                                                         Variables
                                                                                                                                      Model: Total Effects on Six Principal Endogenous Variables b
addition, a robust number, ninety-eight (98) percent of the hypotheses                                                                                                                                                                   24_var_T&LwT_2008LIS _9 a_cent _EM_Centered_3_BEST.LS8
explored were confirmed. The total effects on three focal endogenous variables
in a structural equation model are exclusively featured.                            Martin E. Sandler, Ph.D. has several years experience as a researcher, faculty member and administrator in higher education. He has published in
                                                                                    Research in Higher Education and the Journal of College Student Development and is currently Assistant Director, Assessment, TLTC, Seton Hall University.

Más contenido relacionado

Similar a Sandler NJEdge 6.0

M adurity model of elearning
M adurity model of elearningM adurity model of elearning
M adurity model of elearningadriana palomo
 
M-Learners Performance Using Intelligence and Adaptive E-Learning Classify th...
M-Learners Performance Using Intelligence and Adaptive E-Learning Classify th...M-Learners Performance Using Intelligence and Adaptive E-Learning Classify th...
M-Learners Performance Using Intelligence and Adaptive E-Learning Classify th...IRJET Journal
 
New Fuzzy Model For quality evaluation of e-Training of CNC Operators
New Fuzzy Model For quality evaluation of e-Training of CNC OperatorsNew Fuzzy Model For quality evaluation of e-Training of CNC Operators
New Fuzzy Model For quality evaluation of e-Training of CNC Operatorsinventionjournals
 
ANALYSIS OF STUDENT ACADEMIC PERFORMANCE USING MACHINE LEARNING ALGORITHMS:– ...
ANALYSIS OF STUDENT ACADEMIC PERFORMANCE USING MACHINE LEARNING ALGORITHMS:– ...ANALYSIS OF STUDENT ACADEMIC PERFORMANCE USING MACHINE LEARNING ALGORITHMS:– ...
ANALYSIS OF STUDENT ACADEMIC PERFORMANCE USING MACHINE LEARNING ALGORITHMS:– ...indexPub
 
Analyzing satisfacting
Analyzing satisfactingAnalyzing satisfacting
Analyzing satisfactingAziz Ahmad
 
IRJET- Using Data Mining to Predict Students Performance
IRJET-  	  Using Data Mining to Predict Students PerformanceIRJET-  	  Using Data Mining to Predict Students Performance
IRJET- Using Data Mining to Predict Students PerformanceIRJET Journal
 
IRJET- Performance for Student Higher Education using Decision Tree to Predic...
IRJET- Performance for Student Higher Education using Decision Tree to Predic...IRJET- Performance for Student Higher Education using Decision Tree to Predic...
IRJET- Performance for Student Higher Education using Decision Tree to Predic...IRJET Journal
 
The quasimoderating effect of perceived affective quality on an extending Tec...
The quasimoderating effect of perceived affective quality on an extending Tec...The quasimoderating effect of perceived affective quality on an extending Tec...
The quasimoderating effect of perceived affective quality on an extending Tec...alabrictyn
 
Automated Essay Score Predictions As A Formative Assessment Tool
Automated Essay Score Predictions As A Formative Assessment ToolAutomated Essay Score Predictions As A Formative Assessment Tool
Automated Essay Score Predictions As A Formative Assessment ToolLisa Muthukumar
 
New Fuzzy Model for quality evaluation of E-Training of CNC Operators
New Fuzzy Model for quality evaluation of E-Training of CNC OperatorsNew Fuzzy Model for quality evaluation of E-Training of CNC Operators
New Fuzzy Model for quality evaluation of E-Training of CNC Operatorsinventionjournals
 
Artikel 44
Artikel 44Artikel 44
Artikel 44nortex
 
scopus journal.pdf
scopus journal.pdfscopus journal.pdf
scopus journal.pdfnareshkotra
 
Journal publications
Journal publicationsJournal publications
Journal publicationsSarita30844
 
Improving the quality of e-learning courses in Higher Education
Improving the quality of e-learning courses in Higher EducationImproving the quality of e-learning courses in Higher Education
Improving the quality of e-learning courses in Higher EducationSusana Lemos
 
10.1.1.122.5193
10.1.1.122.519310.1.1.122.5193
10.1.1.122.5193yoyosaka
 
Factors influencing the adoption of e learning in jordan
Factors influencing the adoption of e learning in jordanFactors influencing the adoption of e learning in jordan
Factors influencing the adoption of e learning in jordanAlexander Decker
 
Study Analytics: Or is it Learning Analytics?
Study Analytics: Or is it Learning Analytics?Study Analytics: Or is it Learning Analytics?
Study Analytics: Or is it Learning Analytics?Ville Kivimäki
 

Similar a Sandler NJEdge 6.0 (20)

M adurity model of elearning
M adurity model of elearningM adurity model of elearning
M adurity model of elearning
 
M-Learners Performance Using Intelligence and Adaptive E-Learning Classify th...
M-Learners Performance Using Intelligence and Adaptive E-Learning Classify th...M-Learners Performance Using Intelligence and Adaptive E-Learning Classify th...
M-Learners Performance Using Intelligence and Adaptive E-Learning Classify th...
 
New Fuzzy Model For quality evaluation of e-Training of CNC Operators
New Fuzzy Model For quality evaluation of e-Training of CNC OperatorsNew Fuzzy Model For quality evaluation of e-Training of CNC Operators
New Fuzzy Model For quality evaluation of e-Training of CNC Operators
 
ANALYSIS OF STUDENT ACADEMIC PERFORMANCE USING MACHINE LEARNING ALGORITHMS:– ...
ANALYSIS OF STUDENT ACADEMIC PERFORMANCE USING MACHINE LEARNING ALGORITHMS:– ...ANALYSIS OF STUDENT ACADEMIC PERFORMANCE USING MACHINE LEARNING ALGORITHMS:– ...
ANALYSIS OF STUDENT ACADEMIC PERFORMANCE USING MACHINE LEARNING ALGORITHMS:– ...
 
Analyzing satisfacting
Analyzing satisfactingAnalyzing satisfacting
Analyzing satisfacting
 
IRJET- Using Data Mining to Predict Students Performance
IRJET-  	  Using Data Mining to Predict Students PerformanceIRJET-  	  Using Data Mining to Predict Students Performance
IRJET- Using Data Mining to Predict Students Performance
 
IRJET- Performance for Student Higher Education using Decision Tree to Predic...
IRJET- Performance for Student Higher Education using Decision Tree to Predic...IRJET- Performance for Student Higher Education using Decision Tree to Predic...
IRJET- Performance for Student Higher Education using Decision Tree to Predic...
 
The quasimoderating effect of perceived affective quality on an extending Tec...
The quasimoderating effect of perceived affective quality on an extending Tec...The quasimoderating effect of perceived affective quality on an extending Tec...
The quasimoderating effect of perceived affective quality on an extending Tec...
 
Automated Essay Score Predictions As A Formative Assessment Tool
Automated Essay Score Predictions As A Formative Assessment ToolAutomated Essay Score Predictions As A Formative Assessment Tool
Automated Essay Score Predictions As A Formative Assessment Tool
 
New Fuzzy Model for quality evaluation of E-Training of CNC Operators
New Fuzzy Model for quality evaluation of E-Training of CNC OperatorsNew Fuzzy Model for quality evaluation of E-Training of CNC Operators
New Fuzzy Model for quality evaluation of E-Training of CNC Operators
 
Artikel 44
Artikel 44Artikel 44
Artikel 44
 
scopus journal.pdf
scopus journal.pdfscopus journal.pdf
scopus journal.pdf
 
Journal publications
Journal publicationsJournal publications
Journal publications
 
IJMERT.pdf
IJMERT.pdfIJMERT.pdf
IJMERT.pdf
 
Improving the quality of e-learning courses in Higher Education
Improving the quality of e-learning courses in Higher EducationImproving the quality of e-learning courses in Higher Education
Improving the quality of e-learning courses in Higher Education
 
10.1.1.122.5193
10.1.1.122.519310.1.1.122.5193
10.1.1.122.5193
 
2004 U. Penn. Award
2004 U. Penn. Award2004 U. Penn. Award
2004 U. Penn. Award
 
Factors influencing the adoption of e learning in jordan
Factors influencing the adoption of e learning in jordanFactors influencing the adoption of e learning in jordan
Factors influencing the adoption of e learning in jordan
 
H045074150
H045074150H045074150
H045074150
 
Study Analytics: Or is it Learning Analytics?
Study Analytics: Or is it Learning Analytics?Study Analytics: Or is it Learning Analytics?
Study Analytics: Or is it Learning Analytics?
 

Sandler NJEdge 6.0

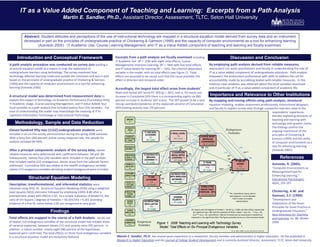
  • 1. IT as a Value Added Component of Teaching and Learning: Excerpts from a Path Analysis Martin E. Sandler, Ph.D., Assistant Director, Assessment, TLTC, Seton Hall University Abstract: Student attitudes and perceptions of the use of instructional technology are mapped in a structural equation model derived from survey data and an instrument developed in part on the principles of undergraduate practice of Chickering & Gamson (1999) and the capacity of computer environments as a tool for enhancing learning (Azevedo 2005). IT Academic Use, Course Learning Management, and IT as a Value Added component of teaching and learning are focally examined. Introduction and Conceptual Framework Excerpts from a path analysis are focally examined including Discussion and Conclusion IT Academic Use (R2 = .158) with eight total effects, Course A path analytic procedure was conducted on survey data yielding a Managements Improves Learning, (R2 = .584) with five total effects, By employing path analysis derived from reliable measures, structural equation model as a means to map the experience of and IT Value Added for learning (R2 = .195), the criterion dependent assessment can assist practitioners and faculty in understanding the role of undergraduate learners using technology. The survey examined how variable in the model, with six total effects (see Figure 1). Total IT as a value added component of undergraduate education. Path analysis technology affected learning inside and outside the classroom and was in part effects are assumed to be causal such that the cause precedes the empowers the assessment professional with skills to address the call for based on the principles of undergraduate practice of Chickering & Gamson effect in direction and temporal order. accountability made by accrediting bodies with reliable measures. In this (1999) and the capacity of computer environments as a tool for enhancing instance clear evidence was obtained about the focal variables examined learning (Azevedo 2005). Accordingly, the largest total effect arose from students’ and in particular of IT as a value added component of academic life. Math and Verbal SAT Score AT .859 (p < .001), that is, for every unit A structural model was determined from measurement data to increase in Cumulative GPA there is a corresponding eighty-six (86) Importance and Relevance to Other Institutions explore the impact of technology on Academic Performance (Cumulative GPA), percent increase in students’ SAT scores. The SAT proved to be a very By mapping and tracing effects using path analysis, structural IT Academic Usage, Course Learning Management, and IT Value Added, four strong contributor/predictor of the explained variance of Cumulative equation modeling enables assessment professionals, instructional designers, focal variables in a path analysis that included twenty-four (24) variables. For GPA totaling seventy-nine (79 )percent. and faculty to explore survey data through a powerful new lens close to the ease of understanding the reader may interchange the meaning of IT to respondents’ experience, represent Information Technology or Instructional Technology. thereby explaining elements of GENDER teaching and learning with Methodology, Sample and Data Reduction X1 technology with greater clarity. ETHNICITY/ The findings confirm the Eleven hundred fifty-two (1152) undergraduate students were RACE - .120 Endogenous ongoing importance of the Variables X2 IT USE NON - included in an on-line survey administration during the spring 2008 semester. IT SKILL LEVEL ACADEMIC .317 Y5 .119*** COURSE MGMT. principles of Chickering & PARENTS’ With a forty-four (44) percent online survey response rate, the sample for EDUCATION 2 Y1 R2 = 0.114 .261 IMPROVES Gamson (1999) and the utility AL LEVEL X3 R = 0.078 analysis included (N=509). LEARNING/Bb 2 of computer environments as a .665 Y9 R = 0.584 HOUSEHOLD .104 .666 .212 .228 tool for enhancing learning INCOME X4 .179 After a principal components analysis of the survey data, eleven .081*** (Azevedo 2005). CLASSROOM .072 .081*** reliable measures were determined with coefficients between .68 and .89. PREFERRED IT DISTRACTS/ MEDIA IMPRS. .163 .497 .079*** Subsequently, twenty-four (24) variables were included in the path analysis LEVEL IT IN COURSE X5 IMPEDES LEARNING Y2 - .112 LEARNING Y6 2 - .108 .085 References R = 0.246 that included twelve (12) endogenous; eleven arose from the subscale factors R2 = 0.001 .443 IT TEAM IT-VALUE addressed. Cumulative GPA was added as the twelfth endogenous variable; VERBAL & -.133 COORDINATION - .173 ADDED Azevedo, R. (2005). MATH SAT Y12 twelve (12) exogenous variables denoting student background were included. X6 .072 Y10 .062** R2 = 0.195 “Computer Environments as R2 = 0.047 ACADEMIC - .391 - .436** .162 .212 .505 MetacognitiveTools for SATISFACTION .331 ASPIRATION WITH WIRELESS Enhancing Learning,” Structural Equation Modeling X7 IT USE ACADEMIC .308 NETWORK Y7 Educational Psychologist, Y3 R2 = 0.027 Descriptive, transformational, and inferential statistics were YEARS TO COLLEGE R2 = 0.158 - .296 40(4), 193-197. DEGREE X8 .108 CUMULATIVE .253 obtained using SPSS 16. Structural Equation Modeling (SEM) using a weighted - .164 .165 GRADE POINT least squares (WLS) estimator followed by employing LISREL 8.80 after a CUMULATIVE .859 AVERAGE - GPA b Chickering, A.W. and HOURS The conventional syntax used in Y11 R2 = 0.785 pretreatment phase with PRELIS 2.50. As a simple indication of Model Fit, the PASSED X9 DIVERSE path diagrams may be deviated Gamson, Z.F. (1999). - .162 from in order to simplify ratio of Chi-Square / degrees of freedom = 50.335/193 = 0.261 providing TALENTS Y8 representation. “Development and HOURS SATISFACTION R2 = 0.035 evidence of a fine fit; ratios below 2.00 are recognized as very good. STUDY X10 WITH LAPTOP Adaptations of the Seven Y4 Principles for Good Practice in R2 = 0.008 Chi-Square with 193 degrees of freedom = 50.335 (p = 1.000). All total effects represented Findings HOURS EMPLOYED are significant atp <.001 with the exception of those marked * at p <.01, ** at p < .02, Undergraduate Education,” X11 and *** at p < .05 ; total effects <.060 are trimmed and not represented. A dashed line New Directions for Teaching Total effects are mapped in the course of a Path Analysis. Six (6) out represents a non-significant effect. The figure presented serves as a final structural model. and Learning, no. 80, Winter HOUSING/ of twelve (12) endogenous variables of the structural model had notable levels Exogenous 1999. COMMUTING Figure 1: 2008 Teaching and Learning with Technology Survey of variance explained, between eleven (11) and seventy-nine (79) percent. In X12 Variables Model: Total Effects on Six Principal Endogenous Variables b addition, a robust number, ninety-eight (98) percent of the hypotheses 24_var_T&LwT_2008LIS _9 a_cent _EM_Centered_3_BEST.LS8 explored were confirmed. The total effects on three focal endogenous variables in a structural equation model are exclusively featured. Martin E. Sandler, Ph.D. has several years experience as a researcher, faculty member and administrator in higher education. He has published in Research in Higher Education and the Journal of College Student Development and is currently Assistant Director, Assessment, TLTC, Seton Hall University.