This document contains financial data for Hindustan Unilever from 2001 to 2011. It includes income statements with details on sales, costs, expenses, profits and other financial metrics. The data is presented annually and can be copied into an Excel sheet for analysis. Key financial figures such as net sales, operating profit, net profit and earnings per share are given for each year.
Axa Assurance Maroc - Insurer Innovation Award 2024
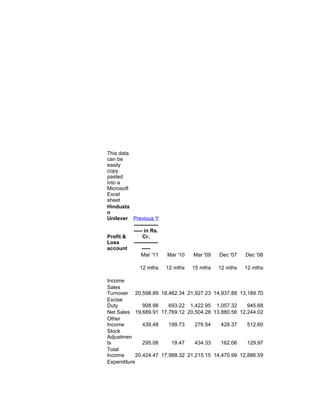
Hul p&l account
1. This data
can be
easily
copy
pasted
into a
Microsoft
Excel
sheet
Hindusta
n
Unilever Previous Years »
--------------
----- in Rs.
Profit & Cr.
Loss --------------
account -----
Mar '11 Mar '10 Mar '09 Dec '07 Dec '06
12 mths 12 mths 15 mths 12 mths 12 mths
Income
Sales
Turnover 20,598.89 18,462.34 21,927.23 14,937.88 13,189.70
Excise
Duty 908.98 693.22 1,422.95 1,057.32 945.68
Net Sales 19,689.91 17,769.12 20,504.28 13,880.56 12,244.02
Other
Income 439.48 199.73 276.54 428.37 512.60
Stock
Adjustmen
ts 295.08 19.47 434.33 162.06 129.97
Total
Income 20,424.47 17,988.32 21,215.15 14,470.99 12,886.59
Expenditure
2. Raw
Materials 10,494.33 9,003.97 11,380.05 7,542.78 6,687.30
Power &
Fuel Cost 274.74 244.34 301.37 198.89 180.79
Employee
Cost 961.27 936.30 1,152.12 767.81 642.81
Other
Manufactu
ring
Expenses 551.25 412.19 297.34 204.10 187.37
Selling
and Admin
Expenses 4,366.30 3,737.52 3,857.48 2,561.12 2,328.51
Miscellane
ous
Expenses 672.61 656.57 985.31 691.49 541.52
Preoperati
ve Exp
Capitalise
d 0.00 0.00 0.00 0.00 0.00
Total
Expenses 17,320.50 14,990.89 17,973.67 11,966.19 10,568.30
Mar '11 Mar '10 Mar '09 Dec '07 Dec '06
12 mths 12 mths 15 mths 12 mths 12 mths
Operating
Profit 2,664.49 2,797.70 2,964.94 2,076.43 1,805.69
PBDIT 3,103.97 2,997.43 3,241.48 2,504.80 2,318.29
Interest 0.24 6.98 25.32 25.50 10.73
PBDT 3,103.73 2,990.45 3,216.16 2,479.30 2,307.56
Depreciati
on 220.83 184.03 195.30 138.36 130.16
Other
Written Off 0.00 0.00 0.00 0.00 0.00
Profit
Before
Tax 2,882.90 2,806.42 3,020.86 2,340.94 2,177.40
Extra-
ordinary
items -3.06 43.97 48.53 1.67 -0.21
PBT (Post
Extra-ord
Items) 2,879.84 2,850.39 3,069.39 2,342.61 2,177.19
Tax 573.87 648.36 572.94 417.14 321.80
Reported
Net Profit 2,305.97 2,202.03 2,500.71 1,769.06 1,855.37
Total
Value
Addition 6,826.17 5,986.92 6,593.62 4,423.41 3,881.00
3. Preferenc
e Dividend 0.00 0.00 0.00 0.00 0.00
Equity
Dividend 1,410.60 1,417.94 1,634.51 1,976.12 1,325.48
Corporate
Dividend
Tax 231.36 238.03 277.79 355.50 185.90
Per share data
(annualised)
Shares in
issue
(lakhs) 21,594.72 21,816.87 21,798.76 21,774.63 22,067.76
Earning
Per Share
(Rs) 10.68 10.09 11.47 8.12 8.41
Equity
Dividend
(%) 650.00 650.00 750.00 900.00 600.00
Book
Value (Rs) 12.19 11.84 9.45 6.61 12.34
Source : Dion Global Solutions Limited
This data
can be
easily
copy
pasted
into a
Microsoft
Excel
sheet
« Next
Hindusta Years
n Previous
Unilever Years »
--------------
----- in Rs.
Profit & Cr.
Loss --------------
account -----
Dec '05 Dec '04 Dec '03 Dec '02 Dec '01
12 mths 12 mths 12 mths 12 mths 12 mths
Income
Sales
Turnover 12,108.86 10,996.72 11,203.14 11,035.20 11,835.45
4. Excise
Duty 914.98 939.61 973.73 976.18 1,121.34
Net Sales 11,193.88 10,057.11 10,229.41 10,059.02 10,714.11
Other
Income 218.01 171.12 297.80 335.27 390.11
Stock
Adjustmen
ts -48.12 -76.69 120.20 3.84 -4.63
Total
Income 11,363.77 10,151.54 10,647.41 10,398.13 11,099.59
Expenditure
Raw
Materials 6,170.98 5,413.77 5,438.00 5,233.15 6,077.96
Power &
Fuel Cost 168.74 164.77 167.84 166.41 152.77
Employee
Cost 591.32 574.84 578.63 599.11 591.71
Other
Manufactu
ring
Expenses 191.82 193.84 197.13 203.07 188.30
Selling
and Admin
Expenses 2,010.10 1,713.73 1,579.87 1,541.00 1,642.31
Miscellane
ous
Expenses 429.09 377.93 281.98 295.74 270.35
Preoperati
ve Exp
Capitalise
d 0.00 0.00 0.00 0.00 0.00
Total
Expenses 9,562.05 8,438.88 8,243.45 8,038.48 8,923.40
Dec '05 Dec '04 Dec '03 Dec '02 Dec '01
12 mths 12 mths 12 mths 12 mths 12 mths
Operating
Profit 1,583.71 1,541.54 2,106.16 2,024.38 1,786.08
PBDIT 1,801.72 1,712.66 2,403.96 2,359.65 2,176.19
Interest 19.19 129.98 66.76 9.18 7.74
PBDT 1,782.53 1,582.68 2,337.20 2,350.47 2,168.45
Depreciati
on 124.45 120.90 124.78 134.10 144.66
Other
Written Off 0.00 0.00 0.00 0.00 0.00
Profit
Before
Tax 1,658.08 1,461.78 2,212.42 2,216.37 2,023.79
Extra-
ordinary
items 44.04 56.29 47.69 33.20 18.92
5. PBT (Post
Extra-ord
Items) 1,702.12 1,518.07 2,260.11 2,249.57 2,042.71
Tax 294.00 320.74 488.30 479.85 402.42
Reported
Net Profit 1,408.10 1,197.34 1,771.79 1,769.74 1,540.95
Total
Value
Addition 3,391.08 3,025.11 2,805.46 2,805.32 2,845.44
Preferenc
e Dividend 0.00 0.00 0.00 0.00 0.00
Equity
Dividend 1,100.62 1,100.62 1,599.20 1,210.68 1,100.62
Corporate
Dividend
Tax 159.62 145.53 374.14 -56.13 57.69
Per share data
(annualised)
Shares in
issue
(lakhs) 22,012.44 22,012.44 22,012.44 22,012.44 22,012.44
Earning
Per Share
(Rs) 6.40 5.44 8.05 8.04 7.00
Equity
Dividend
(%) 500.00 500.00 550.00 550.00 500.00
Book
Value (Rs) 10.47 9.50 9.71 16.62 13.82
Source : Dion Global Solutions Limited