Investment Outlook January 2014
•
2 likes•779 views

Fidelity Personal Investing’s market and investment view, January 2014. Assessing main investment themes; equities, bonds, property, and commodities. https://www.fidelity.co.uk/static/pdf/personal/markets-insights/investment-outlook-january-2014.pdf More at: https://www.fidelity.co.uk

Recommended
Recommended
More Related Content
What's hot
What's hot (19)
Similar to Investment Outlook January 2014
Similar to Investment Outlook January 2014 (20)
Recently uploaded
Recently uploaded (20)
Investment Outlook January 2014
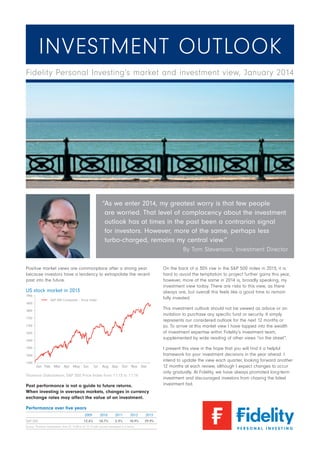
- 1. Investment Outlook Fidelity Personal Investing’s market and investment view, January 2014 “ s we enter 2014, my greatest worry is that few people A are worried. That level of complacency about the investment outlook has at times in the past been a contrarian signal for investors. However, more of the same, perhaps less turbo‑charged, remains my central view.” By Tom Stevenson, Investment Director Positive market views are commonplace after a strong year because investors have a tendency to extrapolate the recent past into the future. US stock market in 2013 1900 SP 500 Composite – Price Index 1850 This investment outlook should not be viewed as advice or an invitation to purchase any specific fund or security. It simply represents our considered outlook for the next 12 months or so. To arrive at this market view I have tapped into the wealth of investment expertise within Fidelity’s investment team, supplemented by wide reading of other views “on the street”. 1800 1750 1700 1650 1600 1550 1500 1450 On the back of a 30% rise in the SP 500 index in 2013, it is hard to avoid the temptation to project further gains this year, however, more of the same in 2014 is, broadly speaking, my investment view today. There are risks to this view, as there always are, but overall this feels like a good time to remain fully invested. Jan Feb Mar Apr May Jun Jul Aug Sep Oct Nov Dec Thomson Datastream, SP 500 Price Index from 1.1.13 to 1.1.14 Past performance is not a guide to future returns. When investing in overseas markets, changes in currency exchange rates may affect the value of an investment. Performance over five years 2009 SP 500 2010 2011 2012 2013 12.6% 18.7% 2.9% 10.9% 29.9% Source: Thomson Datastream, from 31.12.08 to 31.12.13 with income reinvested in £ terms. I present this view in the hope that you will find it a helpful framework for your investment decisions in the year ahead. I intend to update the view each quarter, looking forward another 12 months at each review, although I expect changes to occur only gradually. At Fidelity, we have always promoted long-term investment and discouraged investors from chasing the latest investment fad.
- 2. Main investment themes for 2014 1. We prefer equities to bonds and commodities. There is selective value in commercial property. Residential property in the UK looks underpinned by policy and limited supply. 2. Within equities, the US and Japan are the most attractive markets. The UK looks better than the rest of Europe. Emerging markets are exposed to the effects of the Fed’s taper. 3. Within bonds, high yield looks most interesting for income seekers. Strategic bond funds are the best way of investing in fixed income for most investors. 4. China is the most interesting contrarian play this year, offering investors exposure to long‑term growth at a historically cheap valuation. Contents Asset classes . . . . . . . . . . . . . . . . . . . . . . . . 3 Equities . . . . . . . . . . . . . . . . . . . . . . . . . . . . 4 Bonds . . . . . . . . . . . . . . . . . . . . . . . . . . . . . . 5 Property . . . . . . . . . . . . . . . . . . . . . . . . . . . . 6 Commodities . . . . . . . . . . . . . . . . . . . . . . . . 6 Equities – a regional perspective . . . . . . . . 7 Bonds – in focus . . . . . . . . . . . . . . . . . . . . 12 Investment risks in 2014 . . . . . . . . . . . . . . . 14 2 Important information: Please be aware that past performance is not a guide to what might happen in the future. The value of investments and the income from them can go down as well as up and investors may not get back the amount invested. This information does not constitute investment advice and should not be used as the basis for any investment decision nor should it be treated as a recommendation for any investment. Investors should also note that the views expressed may no longer be current and may have already been acted upon by Fidelity. Fidelity does not give investment advice. If you are unsure about the suitability of an investment, you should speak to an adviser. Before you invest, please ensure you have read Doing Business with Fidelity and the Key Investor Information Document (KIID) and associated charges; or Fund Specific Information Document (FSI), relevant to your chosen fund(s). These documents give you all the information you need to know about Fidelity, including details of the objective, investment policy, risks, charges and past performance associated with the fund(s). Instructions on how to access these documents can be found at fidelity.co.uk/ importantinformation. If you do not have a computer or access to the internet please call Fidelity on 0800 41 41 61 to request a printed copy of the documents. The Full Prospectus is also available on request from Fidelity.
- 3. Asset classes A key decision every investor needs to take when constructing a portfolio relates to the balance between different asset classes. With economic recovery underway, we have a preference for equities over bonds and commodities. UK GDP growth (quarter-on-quarter) Select List funds Mixed Assets – Balanced 2.0% Architas Multi Asset Active Intermediate 1.5% FC Multi Manager Navigator Distribution 1.0% Henderson Cautious Managed 0.5% Investec Cautious Managed 0% -0.5% Mixed Assets – Defensive -1.0% AXA Defensive Distribution -1.5% -2.0% Jupiter Distribution -2.5% Prudential Managed Defensive -3.0% 2009 2010 2011 2012 2013 Threadneedle Defensive Equity and Bond Source: Thomson Datastream, 9.1.14 Mixed Assets – Flexible Past performance is not a guide to future returns. CF Miton Strategic Portfolio We see selective opportunities within commercial property. For investors who are nervous after 2013’s strong run in equities, cash is the safest haven despite its still negligible yield. Invesco Perpetual Managed Growth Investec Managed Growth Jupiter Merlin Growth Portfolio Some investors will have the confidence to use my comments as a framework for making their own asset allocation decisions, perhaps using Fidelity’s Select List to narrow the search to a shortlist of funds which our experts particularly like. For those who prefer to leave asset allocation to professional managers, there is a wide range of multi-asset or balanced funds. Mixed Assets – Growth Important information on The Select List: The funds on The Select List are hand picked from the range available on our fund supermarket. The funds featured in this brochure are from the December 2013 update. For more information on how these funds are selected visit fidelity.co.uk/select. We believe that The Select List provides an excellent choice of funds for anyone constructing their own investment portfolio, although it is not a recommendation to buy. Equally, if a fund you own already is not on The Select List we are not recommending that you sell it – the list represents funds and managers that our experts particularly rate. Threadneedle Global Equity and Bond Aberdeen Multi Asset AXA Framlington Managed Balanced Investec Diversified Growth Jupiter Merlin Balanced Portfolio Mixed Assets – Income Aberdeen Managed Distribution Aviva Investors Distribution SC1 Fidelity Multi Asset Income Premier Multi Asset Monthly Income 3
- 4. Equities Global Equity Global Equity Income The backdrop for equity investors is generally positive with a global recovery underway, untroubled yet by rising inflation. This should keep monetary policy loose over a one year time horizon. Falling inflation enables interest rates to remain lower for longer 5.5% 6.0% 5.5% 5.0% 4.5% The benefit of re-investing dividends 220 4.0% 4.0% 3.5% 3.0% 3.0% FTSE 100 (without income reinvested) FTSE 100 (with income reinvested) 200 180 160 2.0% 2.5% 2.0% 1.0% 1.5% 1.0% Income remains in short supply in an environment of generally low interest rates around the world. Re-invested income is a major contributor to total returns from many investments and it can help to smooth returns as well as being a sign of corporate strength and prudent management. I believe equity income investing will continue to be a theme as long as interest rates remain at today’s historically low levels. 140 120 100 2004 2005 2006 2007 2008 2009 2010 2011 2012 2013 0.0% UK Consumer Prices (left hand scale) UK Bank of England base rate (right hand scale) Source: Thomson Datastream, 14.1.14 Past performance is not a guide to future returns. Despite the strong performance of many markets in 2013, valuations do not yet look excessive and sentiment is not overly positive. This is good news because it suggests that some investors remain on the side-lines, ready to enter the market when they are confident that the economy is on a clear upward trajectory. A further positive for the market is an increase in mergers and acquisitions activity, another sign of improving sentiment. The recovery from the low reached in early 2009 is nearly five years old but previous bull markets have lasted longer than this and I believe stock markets look capable of continuing to climb a “wall of worry”. Important information: When investing in overseas markets, changes in currency rates may affect the value of your investment. Investments in small and emerging markets can be more volatile than those in other overseas markets. 80 60 2004 2005 2006 2007 2008 2009 2010 2011 2012 2013 Source: Thomson Datastream. 14.1.14 Past performance is not a guide to future returns. Performance over five years 2009 2010 2011 2012 2013 FTSE 100 (without income reinvested) 22.1% 9.0% -5.6% 5.8% 14.4% FTSE 100 (with income reinvested) 27.3% 12.6% -2.2% 10.0% 18.7% Source: Thomson Datastream, 31.12.08 to 31.12.13. Performance of the FTSE 100 index, with and without income reinvested. Select List funds Global Equity BNY Mellon Long Term Global Equity Ecclesiastical Amity International FC Stewardship International Fidelity MoneyBuilder World Index* MG Global Growth Rathbone Global Opportunities Schroder Global Climate Change Templeton Growth Global Equity Income Aberdeen World Equity Income Lazard Global Equity Income Newton Global Higher Income Sarasin Global Higher Dividend *This fund replicates the performance of the MSCI World Index 4
- 5. Bonds Bonds underperformed equities significantly in 2013. I expect more of the same in 2014. While bonds continue to provide useful diversification and can be a good source of income, investors would be unwise to view them as risk-free now that the next move in interest rates is, at some point, likely to be upwards. With the unemployment rate approaching the threshold set by Bank of England governor Mark Carney last summer, the turn in rates may be sooner than some investors have expected. He has made it clear that the 7% jobless rate is merely a “way station” on the road to higher interest rates but higher yields remain a threat to fixed-income investors. Investors who wish to have some fixed income in their portfolios should look to strategic bond funds, which can move investments between different types of bond – government, corporate, high yield and inflation linked. There are a number of general global and strategic bond funds available on the The Select List which are listed below. Select List funds UK unemployment falling towards Bank of England threshold Global Aggregate 8.5% Newton Global Dynamic Bond MG Global Macro Bond UK unemployment rate Threadneedle Global Bond 8.0% 7.5% Strategic Bond 7.0% Henderson Preference and Bond 6.5% Legal General Dynamic Bond Trust 6.0% MG Optimal Income 5.5% UK Aggregate 5.0% 4.5% Fidelity Strategic Bond 2004 2005 2006 2007 2008 2009 2010 2011 2012 2013 Henderson Sterling Bond Source: Thomson Datastream, 14.1.14 Past performance is not a guide to future returns. Important information: For funds that invest in bonds, please be aware that the price of bonds is influenced by movements in interest rates, changes in the credit rating of bond issuers, and other factors such as inflation and market dynamics. In general, as interest rates rise the price of a bond will fall. The risk of default is based on the issuer's ability to make interest payments and to repay the loan at maturity. Default risk may therefore vary between different government issuers as well as between different corporate issuers. The investment policy of Fidelity Strategic Bond Fund means it can be more than 35% invested in government and public securities. These can be issued of guaranteed by other countries and governments. For a full list please refer to the fund's prospectus. 5
- 6. Property Within commercial property, we see a marked difference in the value offered by prime real estate and properties in less fashionable locations. In a generally risk-averse environment, investors have preferred to shelter in perceived safe havens and this has resulted in yields falling (and so prices rising) for prime properties and higher yields (and so lower prices) for secondary sites. During the second half of 2013, the yields on secondary property began to fall back a little but we believe this process has some way to run. Residential property only back to 2007 level Secondary property yields have a long way to fall 150 % spread over UK 10 year Gilts 10 190 UK House Price Index 180 170 160 140 UK Corporate Bonds UK Secondary Property 8 130 UK Prime Property 2004 2005 2006 2007 2008 2009 2010 2011 2012 2013 6 Source: ONS, Thomson Datastream, 14.1.14 4 Past performance is not a guide to future returns. 2 0 Sep-13 Sep-12 Sep-11 Sep-10 Sep-09 Sep-08 Sep-07 Sep-06 Sep-05 Sep-04 Sep-03 Sep-02 Sep-01 Sep-00 Sep-99 -2 Select List funds Property - Listed Source: Fidelity, CBRE, 29.11.13 Aberdeen Property Share Past performance is not a guide to future returns. Fidelity Global Property Within the residential market, there is increasing talk of a bubble forming. Outside the most popular areas of central London this probably overstates the position, with prices in many cases still no higher than at the previous peak before the financial crisis. With government policy likely to remain supportive ahead of an election in 2015, house prices will remain well underpinned over the next year. MG Global Real Estate Securities Property - Physical HSBC Open Global Property Ignis UK Property Important information: Some funds in the property sector invest in property and land. These can be difficult to sell so you may not be able to cash in this investment when you want to. There may be long delays in acting on your instructions to sell your investment. The value of property is generally a matter of a valuer's opinion rather than fact. When investing in overseas markets, changes in currency rates may affect the value of your investment. Commodities While it is unwise to generalise about an asset class which includes such diverse investments as energy and both precious and industrial metals, we believe commodities as a whole remain unattractive. A rising dollar, which looks likely in 2014, is generally bad for assets priced in the US currency; demand from China, an important factor, looks likely to moderate as the Chinese economy rebalances away from investment and exports towards domestic consumption; and there remains an overhang of excessive investment in new capacity by the mining majors which new management in all the largest companies is only beginning to unwind. Gold has proved that it cannot be relied on as a safe haven. With no income to underpin its value, gold is best left to specialists. 6 Select List funds Commodities - General First State Global Resources Martin Currie Global Resources Commodities - Precious Metals BlackRock Gold and General Investec Global Gold
- 7. Equities – a regional perspective US We remain positive on the outlook for US shares, despite a 30% rise in the value of the SP 500 during 2013. Arguably the US economy is in a healthier position than for many years. US share valuations below peak levels and a source of increased competitiveness for American industry. Other clear positives include an improving housing market and rising employment levels. While US shares are quite highly valued compared to other major markets, momentum is behind the market. 35 Shares do not usually rise to fair value and then stop. Historically they have tended to carry on until they are obviously overvalued and we remain some way off that position today. US Price/Earnings Price/Earnings Ratio 30 25 20 Select List funds 15 10 North America 5 84 86 88 90 92 94 96 98 00 02 04 06 08 10 12 AXA Framlington American Growth Source: Thomson Datastream, 14.1.14 Fidelity Funds America Past performance is not a guide to future returns. When investing in overseas markets, changes in currency exchange rates may affect the value of an investment. HSBC American Index The gap between tax revenues and government spending (the budget deficit) and between imports and exports (the trade deficit) has diminished rapidly. This is a positive for the US dollar, which in turn makes US assets more attractive as a store of value for investors. One of the reasons for the improving economic position is the positive influence of the energy revolution driven by the discovery and exploitation of Shale oil and gas. This is a key driver of the US’s improving trade balance Schroder QEP US Core JPM US Select Old Mutual North American Equity North America Small/Mid Cap BlackRock US Opportunities JPM US Smaller Companies 7
- 8. Japan The importance of the exchange rate to the Japanese market 125 2000 120 1800 115 1600 110 105 1400 100 1200 95 90 1000 85 800 80 600 75 2004 2005 2006 2007 2008 2009 2010 2011 2012 2013 Japanese Yen to US$ TOPIX – Price Index (right hand scale) Source: Thomson Datastream, 14.1.14 Past performance is not a guide to future returns. When investing in overseas markets, changes in currency exchange rates may affect the value of an investment. Performance over five years 2009 TOPIX Index 2010 2011 2012 2013 -6.7% 19.5% -11.8% 2.8% 24.6% Source: Thomson Datastream, 31.12.08 to 31.12.13, with income reinvested in £ terms Although there remain some residual concerns about the impact of the forthcoming hike in Japan’s sales tax in April, we remain confident that the Government will do what is necessary to return the country to growth. With so many international investors on the side-lines, the potential exists for a rise in Japanese share prices to become self-fulfilling. We are positive about the outlook for Japan in 2014. Japan has long been a frustrating market for investors – almost the definition of a false dawn. However, that changed with the election in late 2012 of Prime Minister Shinzo Abe, who promised to restore Japan’s fortunes through a combination of monetary and fiscal easing and structural reforms – known collectively as his “three arrows”. The first two of these have already started to exert a positive influence on the Japanese economy and they were largely responsible for the strong rally in the Nikkei index in the first half of 2013. The pause for breath in the second half of the year reflected concern that the third arrow – structural reforms such as reducing import tariffs and increasing female participation in the workforce – would prove to be tougher nuts to crack. However, rising business confidence, increasing property prices and higher wages are signs that the long fight against deflation may be winnable. Investors including the Government’s own pension fund are starting to encourage companies to focus on improving shareholder returns. A weakening yen is supporting Japan’s big exporters and looks likely to continue doing so this year. 8 Select List funds Japan Aberdeen Japan Growth Baillie Gifford Japanese HSBC Japan Index Jupiter Japan Income Old Mutual Japanese Select Schroder Tokyo Asia-Pacific incl Japan Aberdeen Asia Pacific and Japan Fidelity Funds Pacific Smith Williamson Far Eastern Growth Trust
- 9. UK We like the UK but not as much as the US or Japan. The outlook for the UK stock market is confused by the fact that it is a notoriously poor reflection of the state of the UK economy. Were it more closely linked to the health of UK plc then the outlook for UK shares would be unequivocally good. The British economy has surprised most observers on the upside over the past year and yet the outlook for interest rates remains benign – a powerful combination. That “Goldilocks” scenario looks likely to persist, with inflation in check and economic growth expected to match that in the US and outpace the rest of Europe by a healthy margin. The extent to which this will be reflected in the stock market is limited by the relatively high overseas exposure of UK-listed companies. The prices of the biggest companies are governed as much by global growth prospects as the UK outlook. Also, for the more domestically-focused mid- and small-cap companies the good news is already fairly well reflected in valuations – the FTSE 250 has outperformed the FTSE 100 by a large margin in recent years. UK mid-caps have outperformed the blue-chips Select List funds UK Equity AXA Framlington UK Select Opportunities Ecclesiastical Amity UK Fidelity UK Select HSBC UK FTSE 100 HSBC FTSE All-Share Jupiter UK Special Situations Kames Ethical Equity Liontrust UK Growth UK Equity Income Artemis Income Fidelity MoneyBuilder Dividend Henderson UK Equity Income 280 JOHCM UK Equity Income 260 Liontrust Macro Equity Income 240 220 UK Small/Mid-cap Equity 200 HSBC FTSE 250 180 Marlborough Special Situations 160 Old Mutual Smaller Companies 140 120 Royal London UK Mid-Cap Growth 100 Threadneedle UK Mid 250 80 60 2004 2005 2006 2007 2008 2009 2010 2011 2012 2013 FTSE 100 – Price Index FTSE 250 – Price Index Source: Thomson Datastream, 14.1.14 Past performance is not a guide to future returns. Performance over five years 2009 2010 2011 2012 2013 FTSE 100 27.3% 12.6% -2.2% 10.0% 18.7% FTSE 250 50.6% 27.4% -10.1% 26.1% 32.3% Source: Thomson Datastream, 31.12.08 to 31.12.13 with income reinvested A further drag on UK earnings could be caused by any appreciation of the pound against the euro, which seems possible given the likely easier monetary policy in the Eurozone over the medium term. Investment in the UK should focus on larger companies. Their valuations have some catching up to do and blue-chip shares are well supported by attractive dividend yields in many cases. 9
- 10. Europe Shares in Europe enjoyed a strong year without the obvious positive economic drivers seen in the US and Japan. The rally was not driven by better earnings so much as relief that the worst of the Eurozone crisis appeared to be in the past and the anticipation of improved economic conditions to come. The long-term outlook for Europe remains difficult, however, as the slow drift towards greater political and economic integration continues. Moreover, because profits in the region held up pretty well during the financial and sovereign debt crisis (thanks to a high proportion of sales outside Europe and effective cost‑cutting) there is arguably less scope for earnings to rise sharply from here. Select List funds Europe (excl UK) BlackRock Continental European Henderson European Special Situation HSBC European Index Jupiter European Special Situations Schroder European Alpha Plus Poor demographics and, potentially, a resurgent competitive threat from Japan and the US (thanks to Shale) are further elements in the negative case against Europe. So, too, are signs of a slowdown in demand in some key emerging markets. It is foolish to generalise about such a diverse group of countries and there are clearly pockets of value and very many worldclass companies for stock-pickers to focus on. However, the region as a whole does not look particularly compelling after last year’s gains. Threadneedle European Select Single Country Europe Baring German Growth Fidelity Funds Germany Fidelity Funds Italy China The new leadership in Beijing has put in place a number of reforms which point China in the right direction on a number of social, economic and financial fronts. In the longer-term it is engaged in an important rebalancing of its economy away from exports and investment towards domestic consumption which will improve the quality and sustainability of its growth. Taking a longer-term view, it is hard not to argue for a reasonable exposure to the world’s fastest-growing major economy, a country with a powerful entrepreneurial spirit and a determined Government. The current historically low valuations make this a good contrarian moment to invest in China. Important information: When investing in overseas markets, changes in currency exchange rates may affect the value of an investment. Investing in small and emerging markets can be more volatile than those in other overseas markets. 10 China’s valuation advantage 18 16 14 Price/Earnings Ratio China has been a powerful reminder over the past few years that economic growth and stock market performance are not necessarily closely correlated. The Shanghai market has underperformed sharply even as growth has continued to outstrip that in the world’s other large economies. China has fallen out of favour with investors, both at home and internationally, and its shares now trade well below their longterm average valuation. There remain plenty of things to worry about in China, but many of these, such as the prospect of a Western-style banking crisis are almost certainly overdone. 12 10 8 6 4 2 0 China Korea Japan US Source: Macquarie, Fidelity, December 2013 Select List funds Emerging Markets Regional Equity (China) Fidelity Funds Greater China Schroder ISF Greater China UK
- 11. Asia ex-China, ex-Japan If it is difficult to sensibly generalise about Europe, it is even more so in Asia. At the moment there appears to be a divide between northern Asia, where the outlook looks better than valuations would suggest and the ASEAN countries in the south of the region where more is already priced in and the outlook is clouded by the likely continued tapering of monetary stimulus by the Federal Reserve. South Korean shares have been undermined by the posturing of its neighbour in the north and the perceived threat of a weaker yen in Japan. The country is home to some of the world’s best brands in electronics and the automotive sector and it stands to be a big beneficiary of recovery in the West. Despite this valuations are low. Taiwan, technological workshop of the world, is also well placed for a period of innovation and growth in developed markets. In the south of the region, the ASEAN growth story is real but it is well known, in particular to foreign investors. In addition to higher valuations, the Fed’s taper means that money will increasingly look to return to the US from Asia, which could expose those countries most in need of foreign liquidity. A good long term story, but 2014 might not be the best year to be invested in the region. Select List funds Asia-Pacific ex-Japan Aberdeen Asia Pacific Fidelity South East Asia First State Asia Pacific Leaders HSBC Pacific Index MG Asian Newton Asian Income Schroder Asian Alpha Plus Other emerging markets Emerging markets fell out of favour in the second half of 2013 after it became clear that the US was considering a reduction in its programme of monetary stimulus via quantitative easing. Investors worried in particular about those countries that were most dependent on external investors to fund their economies and those which had raised debts in foreign currencies. With the US “taper” now underway, those fears are likely to persist through 2014, providing a headwind for emerging market equities and currencies. Weaker currencies are not necessarily a bad thing, if they increase the competitiveness of a country’s exports. But not all emerging markets will benefit from this, especially those dependent on selling commodities, and weaker currencies will reduce the ability of consumers to buy imported goods. There remain good opportunities for stock‑picking in emerging markets, with strong growth in particular areas and industry winners that are able to capitalise on that growth. Overall, however, 2014 is likely to be another challenging year for many emerging markets. Select List funds Emerging Markets BlackRock Emerging Markets Equity Tracker Fidelity Funds Emerging Markets JPM Emerging Markets Lazard Emerging Markets Threadneedle Global Emerging Markets Emerging Markets Regional Equity (excl China) Fidelity Funds Latin America Franklin India Schroder ISF BRIC Threadneedle Latin America 11
- 12. Bonds – in focus The dog that didn’t bark in 2013 was the widely expected Great Rotation from bonds to equities. Bond prices held up better than pessimists predicted and they could continue to do so in 2014. What is extremely unlikely, however, is that the capital value of most bonds will rise this year so the risks for investors are unbalanced – the upside is probably limited to a return driven almost wholly by income while the downside could include price falls if there is a rapid withdrawal of money from the asset class. We prefer strategic bond funds, which are best placed to protect investors from losses and to secure the best returns from the higher-yielding parts of the fixed income universe. Government bonds Highly-rated Government bonds had a difficult 2013, with yields rising after the Federal Reserve hinted that monetary stimulus would start to be unwound. Government bonds have already corrected They may rise a bit further, but in the absence of either much stronger growth or inflation there is no reason to believe that they will increase sharply in 2014. Governments look unwilling to tolerate a material rise in yields, and interest rates will therefore stay low, so this year should see Government bonds tread water. 6.0% 5.5% 5.0% Select List funds 4.5% 4.0% 3.5% 3.0% UK Government Bond 2.5% Allianz Gilt Yield Henderson Institutional UK Gilt 2.0% 1.5% UK Government Bond Yield 1.0% 2004 2005 2006 2007 2008 2009 2010 2011 2012 2013 HSBC UK Gilt Index Royal London UK Government Source: Thomson Datastream, 14.1.14 Past performance is not a guide to future returns. High yield bonds This looks the most interesting part of the fixed income universe due to the higher yields available from the slightly less blue-chip companies issuing these bonds and the support provided by a healthier economic backdrop. Income seekers will continue to chase yield in 2014, offsetting any upward pressure on yields that might be passed on from higher Government bond yields. Inflation-linked bonds The longer that quantitative easing continues, the greater the risk of a policy error leading to resurgent inflation. This is not an issue at the moment, and may well not be during the whole of 2014. However, as the tail-risk of a price spiral increases, inflation-linkers look more interesting. Select List funds Select List funds European High Yield Global Inflation-Linked Fidelity Funds European High Yield Fidelity Global Inflation-Linked Bond Invesco Perpetual European High Yield Standard Life Global Index Linked Bond MG European High Yield UK Inflation-Linked Global High Yield Henderson Index-Linked Bond Baring High Yield Legal General All Stocks Index Linked Gilt Index Investec Monthly High Income MG Index-Linked Bond JPM Global High Yield 12
- 13. Investment grade bonds The gap between Government bond yields and those offered by higher-quality corporate bonds provides enough compensation for the extra default risk taken by investors. The narrowing gap between corporate and government bond yields 45% However, the expectation of further falls in yields (and so rises in corporate bond prices) looks unrealistic. This means income will be the major contributor to total returns and investors will rightly question whether they cannot achieve a similar yield from higher-yielding equities which also offer the prospect of dividend increases over time. High Yield Bonds Investment Grade Bonds 40% 30% Select List funds 25% European Corporate Bond 20% Fidelity Funds Euro Corporate Bond 15% MG European Corporate Bond 35% 10% UK Corporate Bond 5% Baillie Gifford Corporate Bond 0% 2009 2010 2011 2012 2013 Source: Thomson Datastream, 14.1.14 Past performance is not a guide to future returns. BlackRock Corporate Bond Tracker Henderson Strategic Bond MG Strategic Corporate Bond 13
- 14. Investment risks in 2014 With growth underway, valuations reasonable, sentiment cautious, policy supportive and inflation under control, the investment outlook is positive. The principal risk in such a benign scenario is for markets to be unsettled by an unexpected geopolitical event. Obvious candidates include an escalation of tension between Japan and China, excessive posturing by North Korea or a flashpoint in the Middle East. The financial risks look less likely: perhaps an escalation of the Eurozone crisis from an unexpected quarter such as France. Interest rates could begin to rise more quickly than anticipated in either the UK or US. The proposed sales tax hike in Japan could disrupt retail sales as an earlier tightening did in 1997. Inflation could accelerate. Select List funds Select List funds not mentioned in this quarter’s Investment Outlook Global Real Assets Fidelity Funds Global Real Asset Securities First State Global Listed Infrastructure Sarasin Agrisar None of these seems particularly likely at this stage but that is the nature of tail risks. They come out of nowhere. Emerging Markets Local Currency Bonds In fact, I think the greatest risk to my outlook is the most mundane of all – that investors simply decide that company profits are not rising quickly enough to justify today’s higher valuations. Pictet Emerging Local Currency Debt 14 Investec Emerging Markets Local Currency Debt Templeton Emerging Markets Bond
- 15. Trust us to go further: ■■ Fidelity analysts: over 350 experts in 13 countries ■■ Fidelity: over 300 actively managed investment funds worldwide ■■ Over £160bn of investors’ assets managed worldwide ■■ Fidelity looks after 1.2m UK investors ■■ Detailed investment approach including direct company interviews ■■ Clearer, low cost pricing Source: Fidelity as at 31.12.13 For more information please call 0800 41 41 61 or visit fidelity.co.uk
- 16. Issued by FIL Investments International, authorised and regulated by the Financial Conduct Authority. Fidelity, Fidelity Worldwide Investment, the Fidelity Worldwide Investment logo and F symbol are trademarks of FIL Limited. UKD1401/33195/CSO5764/0414