SlideShare una empresa de Scribd logo
1 de 8
Downtown Internet Café                                           First Quarter Total Sales
                              First Quarter Forecast
                                                                              MAR                                        $25,700
                        JAN        FEB       MAR         TOTAL      AVG
Sales
  Espresso              $15,500   $13,600     $14,200    $43,300    $14,433
                                                                              FEB                    $24,900
  Drip Coffee            $5,800    $6,000      $6,200    $18,000     $6,000
  Food/Beverages         $3,600    $3,800      $3,800    $11,200     $3,733
  Merchandise            $1,000    $1,100      $1,100     $3,200     $1,067
  Computer                 $400      $400        $400     $1,200       $400   JAN                                                        $26,300
    Total Sales         $26,300   $24,900     $25,700    $76,900    $25,633
Expenses                                                                      $24,000     $24,500   $25,000    $25,500     $26,000       $26,500
  Cost of Goods          $7,775    $7,480      $7,690    $16,425     $7,648
  Cost of Merchandise      $700      $770        $770     $5,100       $747               Firs t Quarte r Pro fit Marg in
  Payroll                $9,000    $9,000      $9,000    $27,000     $9,000
  Internet                 $325      $325        $325       $975       $325   MAR                                                  9.40%
  Building               $2,100    $2,100      $2,100     $6,300     $2,100
  Advertising              $600      $600        $600     $1,800       $600
  Capital Assets         $1,500    $1,500      $1,500     $4,500     $1,500
  Miscellaneous          $1,300    $1,300      $1,300     $3,900     $1,300   FEB                                    7.33%
    Total Exp           $23,300   $23,075     $23,285    $66,000    $23,220
Income
    Net Income          $3,000     $1,825      $2,415    $10,900     $2,413   JAN                                                            11.41%
Profit Margin           11.41%      7.33%       9.40%     14.17%      9.41%
                                   Income Year-To-Date    $10,900
                                                                                    0%     2%       4%         6%        8%        10%       12%
Downtown Internet Café
                          Second Quarter Forecast
                        APR       MAY        JUN        TOTAL      AVG
Sales
  Espresso              $15,993   $15,200    $15,500    $46,693    $15,564
                                                                                   Se c o nd Quarte r Pro fit Marg in
  Drip Coffee            $6,200    $6,200     $6,200    $18,600     $6,200
  Food/Beverages         $3,600    $3,800     $3,800    $11,200     $3,733
  Merchandise            $1,500    $1,500     $1,500     $4,500     $1,500   JUN                                         15.14%
  Computer                 $600      $600       $800     $2,000       $667
    Total Sales         $27,893   $27,300    $27,800    $82,993    $27,664
Expenses
  Cost of Goods          $8,018    $7,940     $8,015    $17,273     $7,991
                                                                           MAY                    13.70%
  Cost of Merchandise    $1,050    $1,050     $1,050     $5,650     $1,050
  Payroll                $9,000    $9,000     $9,000    $27,000     $9,000
  Internet                 $325      $325       $325       $975       $325
  Building               $2,100    $2,100     $2,100     $6,300     $2,100
                                                                           APR                13.48%
  Advertising              $600      $600       $600     $1,800       $600
  Capital Assets         $1,500    $1,500     $1,500     $4,500     $1,500
  Miscellaneous          $1,300    $1,300     $1,300     $3,900     $1,300
                                                                             13%    13%     14%        14%   15%   15%       16%
    Total Exp           $23,893   $23,815    $23,890    $67,398    $23,866
Income
    Net Income          $4,000    $3,485     $3,910     $15,595    $3,798
Profit Margin           14.34%    12.77%     14.06%      18.79%    13.73%
                                  Income Year-To-Date    $26,495
Downtown Internet Café
                              Third Quarter Forecast
                        JUL        AUG        SEP        TOTAL      AVG
Sales
  Espresso              $15,200    $15,300    $15,800    $46,300    $15,433
  Drip Coffee            $6,000     $6,000     $6,500    $18,500     $6,167
                                                                                      Third Quarte r Pro fit Marg in
  Food/Beverages         $4,000     $4,000     $4,000    $12,000     $4,000
  Merchandise            $2,000     $2,000     $2,000     $6,000     $2,000   SEP                                         15.14%
  Computer                 $800       $800       $600     $2,200       $733
    Total Sales         $28,000    $28,100    $28,900    $85,000    $28,333
Expenses
  Cost of Goods          $8,000     $8,025     $8,300    $17,575     $8,108
                                                                              AUG                  13.70%
  Cost of Merchandise    $1,400     $1,400     $1,400     $5,725     $1,400
  Payroll                $9,000     $9,000     $9,000    $27,000     $9,000
  Internet                 $325       $325       $325       $975       $325
  Building               $2,100     $2,100     $2,100     $6,300     $2,100
  Advertising              $600       $600       $600     $1,800       $600   JUL              13.48%
  Capital Assets         $1,500     $1,500     $1,500     $4,500     $1,500
  Miscellaneous          $1,300     $1,300     $1,300     $3,900     $1,300
    Total Exp           $24,225    $24,250    $24,525    $67,775    $24,333     13%   13%    14%        14%   15%   15%      16%
Income
    Net Income          $3,775     $3,850     $4,375     $17,225    $4,000
Profit Margin           13.48%     13.70%     15.14%      20.26%    14.12%
                                   Income Year-To-Date    $43,720
Downtown Internet Café
                            Fourth Quarter Forecast
                        OCT       NOV        DEC        TOTAL      AVG
Sales
  Espresso              $17,900   $18,500    $19,900     $56,300   $18,767
  Drip Coffee            $6,900    $6,900     $6,900     $20,700    $6,900
                                                                                     Fo urth Quarte r Pro fit Marg in
  Food/Beverages         $4,200    $4,400     $4,600     $13,200    $4,400
  Merchandise            $2,000    $2,500     $3,500      $8,000    $2,667   DEC                                       23.72%
  Computer                 $600      $600       $600      $1,800      $600
    Total Sales         $31,600   $32,900    $35,500    $100,000   $33,333
Expenses
  Cost of Goods          $9,065    $9,335     $9,805     $20,675    $9,402   NOV                        21.25%
  Cost of Merchandise    $1,400    $1,750     $2,450      $6,075    $1,867
  Payroll                $9,000    $9,000     $9,000     $27,000    $9,000
  Internet                 $325      $325       $325        $975      $325
  Building               $2,100    $2,100     $2,100      $6,300    $2,100   OCT             19.97%
  Advertising              $600      $600       $600      $1,800      $600
  Capital Assets         $1,500    $1,500     $1,500      $4,500    $1,500
  Miscellaneous          $1,300    $1,300     $1,300      $3,900    $1,300     18%   19%   20%    21%      22%   23%   24%      25%
    Total Exp           $25,290   $25,910    $27,080     $71,225   $26,093
Income
    Net Income          $6,310    $6,990     $8,420      $28,775   $7,240
Profit Margin           19.97%    21.25%     23.72%       28.78%   21.72%
                                  Income Year-To-Date    $72,495
Marg in

      23.72%


23%   24%      25%
First Quarter          Second Quarter
                    Sales Proportion       Sales Proportion
Sales
  Espresso                        56.31%              56.26%
  Drip Coffee                     23.41%              22.41%
  Food/Beverages                  14.56%              13.50%
  Merchandise                      4.16%               5.42%
  Computer                         1.56%               2.41%

        1st Quarter Sales Proportions
                   Espresso 56%


                                                      Computer 2%
                                                      Merchandise 4%


                                                Food/Beverages 15%
      Drip Coffee 23%
Downtown Internet Café
                                                                   Annual Forecast
                         JAN         FEB         MAR         APR        MAY       JUN        JUL       AUG       SEP        OCT       NOV       DEC
Sales
  Espresso               $15,500      $13,600    $14,200     $15,993    $15,200   $15,500    $15,200   $15,300   $15,800    $17,900   $18,500   $19,900
  Drip Coffee             $5,800       $6,000     $6,200      $6,200     $6,200    $6,200     $6,000    $6,000    $6,500     $6,900    $6,900    $6,900
  Food/Beverages          $3,600       $3,800     $3,800      $3,600     $3,800    $3,800     $4,000    $4,000    $4,000     $4,200    $4,400    $4,600
  Merchandise             $1,000       $1,100     $1,100      $1,500     $1,500    $1,500     $2,000    $2,000    $2,000     $2,000    $2,500    $3,500
  Computer                  $400         $400       $400        $600       $600      $800       $800      $800      $600       $600      $600      $600
    Total Sales          $26,300      $24,900    $25,700     $27,893    $27,300   $27,800    $28,000   $28,100   $28,900    $31,600   $32,900   $35,500
Expenses
  Cost of Goods           $7,775       $7,480     $7,690      $8,018     $7,940    $8,015     $8,000    $8,025    $8,300     $9,065    $9,335    $9,805
  Cost of Merchandise       $700         $770       $770      $1,050     $1,050    $1,050     $1,400    $1,400    $1,400     $1,400    $1,750    $2,450
  Payroll                 $9,000       $9,000     $9,000      $9,000     $9,000    $9,000     $9,000    $9,000    $9,000     $9,000    $9,000    $9,000
  Internet                  $325         $325       $325        $325       $325      $325       $325      $325      $325       $325      $325      $325
  Building                $2,100       $2,100     $2,100      $2,100     $2,100    $2,100     $2,100    $2,100    $2,100     $2,100    $2,100    $2,100
  Advertising               $600         $600       $600        $600       $600      $600       $600      $600      $600       $600      $600      $600
  Capital Assets          $1,500       $1,500     $1,500      $1,500     $1,500    $1,500     $1,500    $1,500    $1,500     $1,500    $1,500    $1,500
  Miscellaneous           $1,300       $1,300     $1,300      $1,300     $1,300    $1,300     $1,300    $1,300    $1,300     $1,300    $1,300    $1,300
    Total Exp            $23,300      $23,075    $23,285     $23,893    $23,815   $23,890    $24,225   $24,250   $24,525    $25,290   $25,910   $27,080
Income
    Net Income             $3,000       $1,825     $2,415      $4,000    $3,485     $3,910    $3,775    $3,850     $4,375    $6,310    $6,990     $8,420
Profit Margin             11.41%        7.33%      9.40%      14.34%    12.77%     14.06%    13.48%    13.70%     15.14%    19.97%    21.25%     23.72%
                        Quarter Profit Margin     14.17%                           18.79%                         20.26%                         28.78%
                        Income Year-To-Date      $10,900                          $26,495                        $43,720                        $72,495
ANNUAL

$192,593
 $75,800
 $47,600
 $21,700
  $7,200
$344,893

 $99,448
 $15,190
$108,000
  $3,900
 $25,200
  $7,200
 $18,000
 $15,600
$292,538

 $52,355
 15.18%

Más contenido relacionado

La actualidad más candente

Millionaire Chapter 5 Review
Millionaire Chapter 5 Review Millionaire Chapter 5 Review
Millionaire Chapter 5 Review Damaris Munoz
 
H W 2010 07 At
H W 2010 07 AtH W 2010 07 At
H W 2010 07 Atchipwags
 
Gtc personalized - Virgil
Gtc personalized - Virgil  Gtc personalized - Virgil
Gtc personalized - Virgil Virgil Fuentes
 
Finalista Demo Day Startup Farm SP - 2a edição
Finalista Demo Day Startup Farm SP - 2a ediçãoFinalista Demo Day Startup Farm SP - 2a edição
Finalista Demo Day Startup Farm SP - 2a ediçãoStartup Farm
 
百萬富翁 03
百萬富翁 03百萬富翁 03
百萬富翁 03Aska Chiu
 
Compensation Plan Summary
Compensation Plan SummaryCompensation Plan Summary
Compensation Plan Summaryjenifermyersdc
 
August 2011 Market Pulse - Attached Homes
August 2011 Market Pulse - Attached HomesAugust 2011 Market Pulse - Attached Homes
August 2011 Market Pulse - Attached Homeschipwags
 

La actualidad más candente (10)

Millionaire Chapter 5 Review
Millionaire Chapter 5 Review Millionaire Chapter 5 Review
Millionaire Chapter 5 Review
 
H W 2010 07 At
H W 2010 07 AtH W 2010 07 At
H W 2010 07 At
 
Gtc personalized - Virgil
Gtc personalized - Virgil  Gtc personalized - Virgil
Gtc personalized - Virgil
 
Budget Report
Budget ReportBudget Report
Budget Report
 
Finalista Demo Day Startup Farm SP - 2a edição
Finalista Demo Day Startup Farm SP - 2a ediçãoFinalista Demo Day Startup Farm SP - 2a edição
Finalista Demo Day Startup Farm SP - 2a edição
 
百萬富翁 03
百萬富翁 03百萬富翁 03
百萬富翁 03
 
Taller 13
Taller 13Taller 13
Taller 13
 
Compensation Plan Summary
Compensation Plan SummaryCompensation Plan Summary
Compensation Plan Summary
 
August 2011 Market Pulse - Attached Homes
August 2011 Market Pulse - Attached HomesAugust 2011 Market Pulse - Attached Homes
August 2011 Market Pulse - Attached Homes
 
Millionaire- vocab
Millionaire- vocabMillionaire- vocab
Millionaire- vocab
 

Similar a Example Excel2007

39348363 google-earnings-slides-q3-2010
39348363 google-earnings-slides-q3-201039348363 google-earnings-slides-q3-2010
39348363 google-earnings-slides-q3-2010Pranav Bhatnagar
 
2010 q3 google_earnings_slides
2010 q3 google_earnings_slides2010 q3 google_earnings_slides
2010 q3 google_earnings_slidesrabier
 
Financial Forecast
Financial ForecastFinancial Forecast
Financial ForecastMarc Tejeda
 
Ever Green Roi Water 1
Ever Green Roi Water 1Ever Green Roi Water 1
Ever Green Roi Water 1KarenDPeters
 
Financial Forecasting
Financial ForecastingFinancial Forecasting
Financial ForecastingJamariHodges1
 
Clinton Global Initiative Hult Prize Finalist Presentation - Harambee
Clinton Global Initiative Hult Prize Finalist Presentation - HarambeeClinton Global Initiative Hult Prize Finalist Presentation - Harambee
Clinton Global Initiative Hult Prize Finalist Presentation - HarambeeBig Fish Presentations
 
Managerial Accounting Final Budget Analysis P2
Managerial Accounting Final Budget Analysis P2Managerial Accounting Final Budget Analysis P2
Managerial Accounting Final Budget Analysis P2boscollkid
 
Social Media Marketing Budget Template
Social Media Marketing Budget TemplateSocial Media Marketing Budget Template
Social Media Marketing Budget TemplateDemand Metric
 
Google Q4 2012 Quarterly Earnings Summary
Google Q4 2012 Quarterly Earnings SummaryGoogle Q4 2012 Quarterly Earnings Summary
Google Q4 2012 Quarterly Earnings SummaryKit Seeborg
 
Google Q4 2012 Quarterly Earnings Summary
Google Q4 2012 Quarterly Earnings SummaryGoogle Q4 2012 Quarterly Earnings Summary
Google Q4 2012 Quarterly Earnings SummaryKamaldeep Singh SEO
 
Principals of Business Finance
Principals of Business FinancePrincipals of Business Finance
Principals of Business FinanceKathleen Boushele
 
"INTRODUCCION DE NUEVAS ESPECIES PARA LA PRODUCCION DE FLORES A CAMPO ABIERTO"
"INTRODUCCION DE NUEVAS ESPECIES PARA LA PRODUCCION DE FLORES A CAMPO ABIERTO""INTRODUCCION DE NUEVAS ESPECIES PARA LA PRODUCCION DE FLORES A CAMPO ABIERTO"
"INTRODUCCION DE NUEVAS ESPECIES PARA LA PRODUCCION DE FLORES A CAMPO ABIERTO"presslima
 
Chap2 case athletics_solution
Chap2 case athletics_solutionChap2 case athletics_solution
Chap2 case athletics_solutionshearerpack
 

Similar a Example Excel2007 (20)

Financial forecast
Financial forecastFinancial forecast
Financial forecast
 
39348363 google-earnings-slides-q3-2010
39348363 google-earnings-slides-q3-201039348363 google-earnings-slides-q3-2010
39348363 google-earnings-slides-q3-2010
 
2010 q3 google_earnings_slides
2010 q3 google_earnings_slides2010 q3 google_earnings_slides
2010 q3 google_earnings_slides
 
2010 Budget Options
2010 Budget Options2010 Budget Options
2010 Budget Options
 
Google Earnings Slides 2009 Q2
Google Earnings Slides 2009 Q2Google Earnings Slides 2009 Q2
Google Earnings Slides 2009 Q2
 
Financial Forecast
Financial ForecastFinancial Forecast
Financial Forecast
 
Ever Green Roi Water 1
Ever Green Roi Water 1Ever Green Roi Water 1
Ever Green Roi Water 1
 
Car Net Business Plan
Car Net Business PlanCar Net Business Plan
Car Net Business Plan
 
Financial Forecasting
Financial ForecastingFinancial Forecasting
Financial Forecasting
 
Clinton Global Initiative Hult Prize Finalist Presentation - Harambee
Clinton Global Initiative Hult Prize Finalist Presentation - HarambeeClinton Global Initiative Hult Prize Finalist Presentation - Harambee
Clinton Global Initiative Hult Prize Finalist Presentation - Harambee
 
Managerial Accounting Final Budget Analysis P2
Managerial Accounting Final Budget Analysis P2Managerial Accounting Final Budget Analysis P2
Managerial Accounting Final Budget Analysis P2
 
Exhibits - Copy
Exhibits - CopyExhibits - Copy
Exhibits - Copy
 
Social Media Marketing Budget Template
Social Media Marketing Budget TemplateSocial Media Marketing Budget Template
Social Media Marketing Budget Template
 
Google Q4 2012 Quarterly Earnings Summary
Google Q4 2012 Quarterly Earnings SummaryGoogle Q4 2012 Quarterly Earnings Summary
Google Q4 2012 Quarterly Earnings Summary
 
Google Q4 2012 Quarterly Earnings Summary
Google Q4 2012 Quarterly Earnings SummaryGoogle Q4 2012 Quarterly Earnings Summary
Google Q4 2012 Quarterly Earnings Summary
 
Hoja 21
Hoja 21Hoja 21
Hoja 21
 
Principals of Business Finance
Principals of Business FinancePrincipals of Business Finance
Principals of Business Finance
 
"INTRODUCCION DE NUEVAS ESPECIES PARA LA PRODUCCION DE FLORES A CAMPO ABIERTO"
"INTRODUCCION DE NUEVAS ESPECIES PARA LA PRODUCCION DE FLORES A CAMPO ABIERTO""INTRODUCCION DE NUEVAS ESPECIES PARA LA PRODUCCION DE FLORES A CAMPO ABIERTO"
"INTRODUCCION DE NUEVAS ESPECIES PARA LA PRODUCCION DE FLORES A CAMPO ABIERTO"
 
Project 2
Project 2Project 2
Project 2
 
Chap2 case athletics_solution
Chap2 case athletics_solutionChap2 case athletics_solution
Chap2 case athletics_solution
 

Example Excel2007

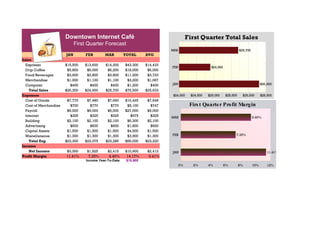
  • 1. Downtown Internet Café First Quarter Total Sales First Quarter Forecast MAR $25,700 JAN FEB MAR TOTAL AVG Sales Espresso $15,500 $13,600 $14,200 $43,300 $14,433 FEB $24,900 Drip Coffee $5,800 $6,000 $6,200 $18,000 $6,000 Food/Beverages $3,600 $3,800 $3,800 $11,200 $3,733 Merchandise $1,000 $1,100 $1,100 $3,200 $1,067 Computer $400 $400 $400 $1,200 $400 JAN $26,300 Total Sales $26,300 $24,900 $25,700 $76,900 $25,633 Expenses $24,000 $24,500 $25,000 $25,500 $26,000 $26,500 Cost of Goods $7,775 $7,480 $7,690 $16,425 $7,648 Cost of Merchandise $700 $770 $770 $5,100 $747 Firs t Quarte r Pro fit Marg in Payroll $9,000 $9,000 $9,000 $27,000 $9,000 Internet $325 $325 $325 $975 $325 MAR 9.40% Building $2,100 $2,100 $2,100 $6,300 $2,100 Advertising $600 $600 $600 $1,800 $600 Capital Assets $1,500 $1,500 $1,500 $4,500 $1,500 Miscellaneous $1,300 $1,300 $1,300 $3,900 $1,300 FEB 7.33% Total Exp $23,300 $23,075 $23,285 $66,000 $23,220 Income Net Income $3,000 $1,825 $2,415 $10,900 $2,413 JAN 11.41% Profit Margin 11.41% 7.33% 9.40% 14.17% 9.41% Income Year-To-Date $10,900 0% 2% 4% 6% 8% 10% 12%
  • 2. Downtown Internet Café Second Quarter Forecast APR MAY JUN TOTAL AVG Sales Espresso $15,993 $15,200 $15,500 $46,693 $15,564 Se c o nd Quarte r Pro fit Marg in Drip Coffee $6,200 $6,200 $6,200 $18,600 $6,200 Food/Beverages $3,600 $3,800 $3,800 $11,200 $3,733 Merchandise $1,500 $1,500 $1,500 $4,500 $1,500 JUN 15.14% Computer $600 $600 $800 $2,000 $667 Total Sales $27,893 $27,300 $27,800 $82,993 $27,664 Expenses Cost of Goods $8,018 $7,940 $8,015 $17,273 $7,991 MAY 13.70% Cost of Merchandise $1,050 $1,050 $1,050 $5,650 $1,050 Payroll $9,000 $9,000 $9,000 $27,000 $9,000 Internet $325 $325 $325 $975 $325 Building $2,100 $2,100 $2,100 $6,300 $2,100 APR 13.48% Advertising $600 $600 $600 $1,800 $600 Capital Assets $1,500 $1,500 $1,500 $4,500 $1,500 Miscellaneous $1,300 $1,300 $1,300 $3,900 $1,300 13% 13% 14% 14% 15% 15% 16% Total Exp $23,893 $23,815 $23,890 $67,398 $23,866 Income Net Income $4,000 $3,485 $3,910 $15,595 $3,798 Profit Margin 14.34% 12.77% 14.06% 18.79% 13.73% Income Year-To-Date $26,495
  • 3. Downtown Internet Café Third Quarter Forecast JUL AUG SEP TOTAL AVG Sales Espresso $15,200 $15,300 $15,800 $46,300 $15,433 Drip Coffee $6,000 $6,000 $6,500 $18,500 $6,167 Third Quarte r Pro fit Marg in Food/Beverages $4,000 $4,000 $4,000 $12,000 $4,000 Merchandise $2,000 $2,000 $2,000 $6,000 $2,000 SEP 15.14% Computer $800 $800 $600 $2,200 $733 Total Sales $28,000 $28,100 $28,900 $85,000 $28,333 Expenses Cost of Goods $8,000 $8,025 $8,300 $17,575 $8,108 AUG 13.70% Cost of Merchandise $1,400 $1,400 $1,400 $5,725 $1,400 Payroll $9,000 $9,000 $9,000 $27,000 $9,000 Internet $325 $325 $325 $975 $325 Building $2,100 $2,100 $2,100 $6,300 $2,100 Advertising $600 $600 $600 $1,800 $600 JUL 13.48% Capital Assets $1,500 $1,500 $1,500 $4,500 $1,500 Miscellaneous $1,300 $1,300 $1,300 $3,900 $1,300 Total Exp $24,225 $24,250 $24,525 $67,775 $24,333 13% 13% 14% 14% 15% 15% 16% Income Net Income $3,775 $3,850 $4,375 $17,225 $4,000 Profit Margin 13.48% 13.70% 15.14% 20.26% 14.12% Income Year-To-Date $43,720
  • 4. Downtown Internet Café Fourth Quarter Forecast OCT NOV DEC TOTAL AVG Sales Espresso $17,900 $18,500 $19,900 $56,300 $18,767 Drip Coffee $6,900 $6,900 $6,900 $20,700 $6,900 Fo urth Quarte r Pro fit Marg in Food/Beverages $4,200 $4,400 $4,600 $13,200 $4,400 Merchandise $2,000 $2,500 $3,500 $8,000 $2,667 DEC 23.72% Computer $600 $600 $600 $1,800 $600 Total Sales $31,600 $32,900 $35,500 $100,000 $33,333 Expenses Cost of Goods $9,065 $9,335 $9,805 $20,675 $9,402 NOV 21.25% Cost of Merchandise $1,400 $1,750 $2,450 $6,075 $1,867 Payroll $9,000 $9,000 $9,000 $27,000 $9,000 Internet $325 $325 $325 $975 $325 Building $2,100 $2,100 $2,100 $6,300 $2,100 OCT 19.97% Advertising $600 $600 $600 $1,800 $600 Capital Assets $1,500 $1,500 $1,500 $4,500 $1,500 Miscellaneous $1,300 $1,300 $1,300 $3,900 $1,300 18% 19% 20% 21% 22% 23% 24% 25% Total Exp $25,290 $25,910 $27,080 $71,225 $26,093 Income Net Income $6,310 $6,990 $8,420 $28,775 $7,240 Profit Margin 19.97% 21.25% 23.72% 28.78% 21.72% Income Year-To-Date $72,495
  • 5. Marg in 23.72% 23% 24% 25%
  • 6. First Quarter Second Quarter Sales Proportion Sales Proportion Sales Espresso 56.31% 56.26% Drip Coffee 23.41% 22.41% Food/Beverages 14.56% 13.50% Merchandise 4.16% 5.42% Computer 1.56% 2.41% 1st Quarter Sales Proportions Espresso 56% Computer 2% Merchandise 4% Food/Beverages 15% Drip Coffee 23%
  • 7. Downtown Internet Café Annual Forecast JAN FEB MAR APR MAY JUN JUL AUG SEP OCT NOV DEC Sales Espresso $15,500 $13,600 $14,200 $15,993 $15,200 $15,500 $15,200 $15,300 $15,800 $17,900 $18,500 $19,900 Drip Coffee $5,800 $6,000 $6,200 $6,200 $6,200 $6,200 $6,000 $6,000 $6,500 $6,900 $6,900 $6,900 Food/Beverages $3,600 $3,800 $3,800 $3,600 $3,800 $3,800 $4,000 $4,000 $4,000 $4,200 $4,400 $4,600 Merchandise $1,000 $1,100 $1,100 $1,500 $1,500 $1,500 $2,000 $2,000 $2,000 $2,000 $2,500 $3,500 Computer $400 $400 $400 $600 $600 $800 $800 $800 $600 $600 $600 $600 Total Sales $26,300 $24,900 $25,700 $27,893 $27,300 $27,800 $28,000 $28,100 $28,900 $31,600 $32,900 $35,500 Expenses Cost of Goods $7,775 $7,480 $7,690 $8,018 $7,940 $8,015 $8,000 $8,025 $8,300 $9,065 $9,335 $9,805 Cost of Merchandise $700 $770 $770 $1,050 $1,050 $1,050 $1,400 $1,400 $1,400 $1,400 $1,750 $2,450 Payroll $9,000 $9,000 $9,000 $9,000 $9,000 $9,000 $9,000 $9,000 $9,000 $9,000 $9,000 $9,000 Internet $325 $325 $325 $325 $325 $325 $325 $325 $325 $325 $325 $325 Building $2,100 $2,100 $2,100 $2,100 $2,100 $2,100 $2,100 $2,100 $2,100 $2,100 $2,100 $2,100 Advertising $600 $600 $600 $600 $600 $600 $600 $600 $600 $600 $600 $600 Capital Assets $1,500 $1,500 $1,500 $1,500 $1,500 $1,500 $1,500 $1,500 $1,500 $1,500 $1,500 $1,500 Miscellaneous $1,300 $1,300 $1,300 $1,300 $1,300 $1,300 $1,300 $1,300 $1,300 $1,300 $1,300 $1,300 Total Exp $23,300 $23,075 $23,285 $23,893 $23,815 $23,890 $24,225 $24,250 $24,525 $25,290 $25,910 $27,080 Income Net Income $3,000 $1,825 $2,415 $4,000 $3,485 $3,910 $3,775 $3,850 $4,375 $6,310 $6,990 $8,420 Profit Margin 11.41% 7.33% 9.40% 14.34% 12.77% 14.06% 13.48% 13.70% 15.14% 19.97% 21.25% 23.72% Quarter Profit Margin 14.17% 18.79% 20.26% 28.78% Income Year-To-Date $10,900 $26,495 $43,720 $72,495
  • 8. ANNUAL $192,593 $75,800 $47,600 $21,700 $7,200 $344,893 $99,448 $15,190 $108,000 $3,900 $25,200 $7,200 $18,000 $15,600 $292,538 $52,355 15.18%