SlideShare una empresa de Scribd logo
1 de 25
Descargar para leer sin conexión
The Open Data Movement
What Is a Chief
Data Officer?
Practical Advice
for Your Open
Data Program
Re-Defining
Government in
the 21st Century
Our 10 Favorite
Open Data Apps
Fall 2013
Contents
The Open Data Movement 	 4
What Is a Chief Data Officer?	 6
Practical Advice for Your Open Data Program	 8
Who Should Be on Your Open Data Team?	 10
3 Critical Areas Your Open Data Policy Should Cover	 12
6 Steps to Open Data Success	 14
3 Guidelines for Publishing Your First Open Data Sets	 18
Op-Ed: Open Data Is Re-Defining Government in the 21st Century	 21
NYC Digital 	 25
Impact: 4 Stories of Open Data success	 27
A Three-Year Problem Solved in Two Hours	 28
“Set It and Forget It” Saves San Francisco Staff Time	 32
King County Elections Takes Open Data Mobile	 36
Hard Copy Is History: Web-Based Reports Save Paper, Time & Money	 40
Our 10 Favorite Open Data Apps	 44
Gut Decisions Are Expensive and Dangerous	 46
Dear Fellow Innovator,
Welcome to the inaugural edition of the Socrata quarterly magazine, “Open Innovation.” As the
open data and data-driven government movements grow, we’ll use this quarterly publication to
recount the success stories, cover current policy issues, and share the many ways that access to
and innovation around public data can improve people’s lives.
This fall, we start with a story that is near and dear to everyone: how government data can
empower consumers. When the Consumer Financial Protection Bureau revealed data on bank’s
customer service records and the Centers for Medicare & Medicaid Services exposed huge cost
differences at various hospitals, open data helped to “spread much-needed digital sunlight.”
We’ve met many of the hard working people who fuel open data programs like these around the
world. How are they successful? We discussed the role of the Chief Digital Officer (CDO) with
former City of Chicago CDO Brett Goldstein. And, we interviewed other leaders in the field and
recorded their best practices, including tips for who should be on your open data team and the
three critical areas your open data policy should cover.
Though the open government movement is still young, some organizations already have openness
and innovation ingrained in their culture. Former Director of Maryland’s StateStat program, Beth
Blauer, shares that state’s success making decisions with data. And, you can look to New York City
as an example. The Big Apple was recently named the “The Most Economically Competitive City”
in the world by The Economist Intelligence Unit. We chronicle NYC’s journey over the last two
years and highlight many outstanding achievements.
Finally, you can read about how open data is modernizing and redefining government in the 21st
century and follow four inspiring stories from organizations that have saved time, saved money,
and improved their service delivery using open data. And, you’ll get a list of some of our favorite
web and mobile apps that showcase data hosted on Socrata.
I hope you enjoy reading “Open Innovation” and find it inspiring. If you’d like more information
on the latest open data news, you can visit us at www.socrata.com.
Best wishes and I look forward to featuring your successes in future editions.
Sincerely,
Kevin Merritt
Founder & CEO of Socrata
Open Innovation • FALL 2013 54 Open Innovation • FALL 2013
The Open Data Movement
The Open Data
Movement
Leveling the Playing Field For Consumers
by Kevin Merritt
CEO of Socrata
American consumers gained
considerable knowledge and
power when a huge Medicare database
was recently distributed to the public in
easy-to-understand language. The data
revealed what many patients have long
suspected – hospitals charge Medicare
tremendously different prices for the
same procedures.
According to The New York Times, for
example, “in Saint Augustine, Fla., one
hospital typically billed nearly $40,000
to remove a gallbladder using minimally
invasive surgery, while one in Orange
Park, Fla., charged $91,000 [and] …
in one hospital in Dallas, the average
bill for treating simple pneumonia was
$14,610, while another there charged
over $38,000.”
This wasn’t the first time that a freshly
unearthed government database
bolstered the average consumer. Earlier
this spring, the U.S. Consumer Financial
Protection Bureau (CFPB) released
detailed – but fully understandable –
data that showed which banks have the
most consumer complaints. The CFPB
had previously issued data on credit card
complaints; but now it has broadened
its data distribution to include customer
protests about mortgages, student
loans, credit scores, and other products.
As Bloomberg Businessweek noted,
the CFPB database has already had
an impact on improving consumer
service: “Response times have sped
up by 3 percent since the database
came online … And banks are giving
more customers a break: The number
of credit-card cases Capital One
Financial, Citigroup, American Express,
The Open Data Movement
and GE Capital Retail Bank have resolved
in clients’ favor rose 12.9 percent in the
past six months.”
The Medicare and CFPB data disclosures
are huge wins for the open data
movement, which seeks to democratize
a vast treasure trove of accumulated
government data. That consumers
can now command equal footing with
big, established, and often opaque
institutions like banks or hospitals, is yet
another reason to support open data.
New York Law School professor Beth
Noveck, the former U.S. Deputy
Chief Technology Officer for Open
Government, agrees that this type of
disclosure increases accountability and
“starts from the premise that
consumers, when given access to
information and useful decision
tools built by third parties using that
information, can self-regulate and
stand on a more level playing field
with companies who otherwise seek
to obfuscate.”
These “smart” data disclosures,
adds Cass Sunstein, the former U.S.
administrator of the White House Office
of Information and Regulatory Affairs
(OIRA), also offer “a new tool that helps
provide consumers with greater access
to the information they need to make
informed choices.”
A good case study can be found at
the Department of Transportation
(DOT), which has been publishing data
on airlines’ on-time performance as well
as consumer complaints against airlines.
Another proof point is the Higher
Education Opportunity Act of 2008,
which was designed to increase
transparency and consumer information
on student loans, college costs, and
other financial issues. Determined to
make sure that this law is as effective
as possible, the U.S. Department of
Education now provides government
data and online tools to help students
and families choose a college and decide
how to finance their education.
As the Medicare, CFPB, Department
of Transportation and Department of
Education data disclosures indicate,
the executive branch of the federal
government is a major player in the
ongoing open data movement.
But the agenda for open data is also
being set at the local level.
Last year, for instance, Yelp partnered
with San Francisco and New York City
to develop the Local Inspector Value-
Entry Specification (LIVES), an open
data standard that allows municipalities
to publish restaurant inspection
information for consumers on Yelp.
Other cities, such as Austin, Texas,
are also publishing restaurant
inspection data online.
Companies are helping to make
open data a widespread reality for
consumers, too. 
Socrata, the company I lead, for
example, offers customers like Medicare
and CFPB – as well as a host of states
and cities – a digital platform to publish
complex data in a simple and easy way.
BillGuard utilizes the CFPB’s new
credit card complaint database to help
consumers find deceptive, erroneous,
and fraudulent charges on their credit
card and debit card bills.  
And iTriage has harnessed
downloadable information from the
Department of Health and Human
Services to develop a mobile application
that has helped eight million people find
the best local doctors and hospitals that
meet their needs.
Regardless of where it comes from,
though, open data benefits consumers
and helps spread much-needed digital
sunlight so that the average citizen is no
longer forced to remain in the dark.
Open data benefits consumers and helps
spread much-needed digital sunlight.
Open Innovation • FALL 2013 76 Open Innovation • FALL 2013
What Is a Chief Data Officer?What Is a Chief Data Officer?
What Is a
Chief Data Officer?
Socrata spoke with former City of Chicago Chief Data Officer
and Chief Innovation Officer Brett Goldstein about the role of the
Chief Data Officer. New to the world of government, this executive
post helped Mayor Rahm Emanuel make Chicago a leading digital
city with the largest, most prolific civic hacking community in
the world. The following is an excerpt form our interview with
Mr. Goldstein in early 2013.
Why the role of a Chief Data Officer
and why now?
Over the past decade, we’ve seen the
role of technology change, at its most
basic. In the early days, you had IT
ops and your core role of a CIO. You
then saw the evolution to see things
like a Chief Security Officer. Why?
Because cyber-security became critical
to the enterprise, to the business, to
administration. But, what you’ve seen
over the past few years is just how data
can transform. Our relationship with
data has changed in a variety of ways.
Two of which, I think, are relevant to
the discussion.
One, the advances in big data. We’ve
seen how we’re going to move from
BI to actual insights that can come
from large data. But, in parallel, we’ve
seen this idea of transparency through
administrative data. Our relationship
with the public has evolved. Back a few
skills of a data scientist, you’re getting
at what you really need here. And,
there’s a whole talk about, ‘What is
a data scientist?’ A data scientist is a
combination of someone who can,
speak, write, and analyze, however with
the requisite CS skills to be considering
problems of machine learning, data
analytics, stats, all of those pieces.
Day-to-day, what do you do both
internally with different departments
in the city, as well as your role in the
broader community?
I want to challenge people, I want to
brainstorm with them, and I want to
get some good ideas moving.
With that said, my agenda is twofold.
One, I think government should be
accessible. If people think they have a
good idea, it shouldn’t be hard to get
in touch with me. I need to be out
there, engage people, be responsive
on Twitter.
Two, the Mayor has a vision of Chicago
as a tech hub. We have enormous talent
in Chicago. I think we need to support
it, foster it, and be out there and
involved. We’re doing some great things.
Additionally, within the community of
CIOs and government leaders, I do my
best to be in close contact with my
peers. I want to hear people’s problems.
There are a variety of leaders I talk to on
a regular basis. I try and hear them and
we try to focus solutions around that.
We need to get past the silos, think in
an enterprise way, and then we’ll have
effective scaled solutions. It is a lot of
listening, understanding, de-conflicting,
and at the same time, making sure that
my organization develops solutions that
are enterprise solutions that come both
from deductive and inductive thinking –
because many of the challenges we have
today can be a function of limited silos
from the past.
What’s the profile of a future Chief
Data Officer in terms of qualities
and qualifications? And what advice
would you give people who aspire to it
in their career?
Data science is at the core. Understand
data. You can’t go out and talk about
data, implement policies systems or
strategy, without getting it. And, these
are all learnable fields.
My undergrad is in government.
After I got my B.A., I decided to get
technology focused and it started out
with me just reading a stack of books.
People need to invest time in learning
how things work.
It’s easy to run a tool that will produce
an outcome. Understanding whether
what you produce is valid is another
piece. When you’re talking to engineers
or talking to people in community or
getting out there, people respect depth
of knowledge. Working in government
requires tenacity. It requires some strong
executive sponsorship. Every day I wake
up and I say, ‘I am going to do it right.’
The right way can often end up being
the hard way. So, you need to have
vision. You need be able to say, ‘I am
going to choose the hard way’ and
be motivated to follow through. The
easy path is often not what’s best for
community, for your residents, for your
constituency.
Also understand that you don’t need
to be a subject matter expert in every
one of your departments but take the
time to understand process, policy,
the different agencies. None of us
should have the hubris to think that just
because we understand the technology
we understand what this all means.
‘Good enough for government’ isn’t
good enough. Our standards here
should be the same standards we see
in Silicon Valley. That should be our
motivation because what higher duty do
we have than our communities and our
residents and doing things in a better,
transparent way?
years ago, your relationship was limited,
with requests for information being
answered in a pdf. Now the possibilities
– and expectations – are very different.
You’re often dealing with the near
real-time possibility of response
coupled with the machine readability
of the data. And when you have these
sort of responsibilities, ranging from
quantitative analytics to transparency,
in a meaningful, honest way, you need
someone to lead that way. I think
Mayor Emanuel showed a nationwide
leadership move by making it a key
piece of the administration.
What are the differences between the
roles of Chief Data Officer and Chief
Innovation or Information Officer?
I see the Chief Innovation Officer
as the person who has some smart,
transformative ideas. They are able to
be, potentially, a change agent. Rethink
processes; bring some fresh ideas to
improve systems.
A Chief Information Officer, since I carry
that title as well, is about IT ops. IT ops,
for example, in Chicago is a massive
undertaking and it has daily challenges.
What does that mean? It means
everything from email to ERP. The ERP
alone is a massive system.
As we are re-architecting DoIT
(Chicago’s Department of Innovation
and Technology) in Chicago, we are
pulling in analytics – the IT organization
and use of data should not be separate.
A Chief Innovation Officer has skills
related to process and business
development, but should be well
grounded in the ability to have
applied delivery.
The CDO is an interesting role where,
I think at its heart, if you give it the
‘Good enough for government’ isn’t good
enough. Our standards here should be the
same standards we see in the Silicon Valley.
Practical Advice
for Your Open
Data Program
How do you choose the first datasets to publish?
Who are the key players that need to be on your
team? We’ve collected wisdom from open data
leaders around the world and distilled it into
the following how-to guides for starting and
maintaining your open data program.
Open Innovation • FALL 2013 1110 Open Innovation • FALL 2013
Who Should Be on Your Open Data Team?Practical Advice for Your Open Data Program
Who Should Be on Your Open
Data Team?
2. Internal IT and Data Teams
Chief Information/Technology/
Data Officers, IT Leaders, Developers,
Webmasters
What’s in it for them: This group
will be excited by the opportunity to
improve efficiencies and modernize
information-sharing infrastructure. This
will help them streamline their everyday
work. It also allows them to produce
tangible results in the form of apps
and interactive visualizations that help
improve life both at their workplace and
in the greater community.
Their role: This part of your team
provides the technical know-how
needed to create your data publishing
plan. The chief information officers
along with other IT leaders should take
charge of selecting and implementing
the open data technology platform.
These leaders, as well as others in your
IT department, may also help rally the
support of business users and program
leaders to deliver their information and
services through the open data portal.
They will also be key players in reaching
out to the private developer community
for input.
3. Communications and
Information Officers
Public Information Officers,
Communication and Marketing
Managers, Public Affairs
What’s in it for them: 
Communications teams will be
enthusiastic about the opportunity to
support and share the agency’s mission
with easy-to-use information, and to use
their skills to help promote community
engagement.
Their role: This is the branch of your
team that will help you create clear,
concise, and targeted messages for
the many different groups who can
help with (and benefit from) an open
data program. Their key roles include
leading external communication, acting
as the press contact, and supporting
community evangelism. Learn more
about how this team can help engage
the community. 
4. Management and Team
Leaders
Department Heads, Agency-Level
Program Managers, City and
County Clerks
What’s in it for them: This group will
be able to benefit directly when open
data sets allow their teams to do their
work more efficiently. When published
creatively, in the form of interactive
charts or visualizations, team leaders and
department heads will be able to see
more clearly the effectiveness of their
teams and point to data-driven results.
Their role: This group provides
access points for each team at your
organization. By engaging them,
you will be able to more effectively
boost each team’s ability to deliver
data and information that supports
programs, your mission, and improve
organizational efficiency.
This group may be the smallest at the
beginning of your initiative, or during
a pilot. But as your initiative grows,
expanding the amount of input from
department heads and creating channels
to listen to all levels of your organization
will become increasingly important.
Learn more about how and why it’s
important to engage every department. 
5. Developers in the
Community
Open Data/App Developers, Open Data
and Open Government Advocates, GIS
Professionals
What’s in it for them: Publishing data
gives developers and advocates in the
community the resources they need to
do their own creative work. They will
take the data you provide to create tools
that improve life of their community.
Their role: From providing feedback
about what data you should publish
to taking that data and creating user-
friendly applications, this group can be
an invaluable asset to your open data
program. They provide a broad base of
expertise and professional perspectives
that your organization alone, no matter
how large, couldn’t provide. To help you
get this group onboard, we’ve identified
four essential things you can do: publish
data, connect with civic developer
organizations, host a hackathon, and
be humble. Read more about the four
essentials of developer evangelism. 
An open data project is a large
and exciting undertaking. One
that can truly change the relationship
between your agency and the public. It
can also improve the efficiency of your
internal operations. But to do it well, it’s
essential to gather a team with the right
skills to ensure success, from strategic
planning to community outreach, not to
mention technical expertise.
If your agency is just getting started,
a small and enthusiastic team may be
all you need to launch a successful
pilot. With the right mix, this group
can also provide the energy, leadership,
and strategic planning to get your
entire organization onboard for an
ongoing effort toward data sharing and
transparency.
Gathering this team is not always easy.
Part of the process will likely require you
to sell your program to the stakeholders
who may not fully understand the value
of open data yet.
Fortunately, there are many clear and
direct benefits for each of the open data
stakeholders on your team. The team
building phase is your opportunity to
teach and inspire them to think about
these benefits and the many exciting
ways open data can improve your
agency’s work. The time you spend
winning them over will pay for itself,
as each stakeholder can then inspire
their own teams for broad support
down the road.
When putting together your open data
team, keep the following five groups in
mind – and what’s in it for them – to
ensure the skills and input you need are
at the table.
1. Chief Executives
City or County Managers, Chief
Operating Officers, Heads of Planning
What’s in it for them: Launching an
open data program is an opportunity for
your organization’s executive to make a
big difference in improving transparency,
citizen services, and overall performance
in your organization.
Their role: The executive’s primary role
in the initiative is to secure funding for
the program and make sure it delivers
on its goals. Once they’re onboard,
they can also provide the organizational
leadership and impetus for your entire
agency to get involved. Read more
advice about how to get your chief
executive’s support.  
Open Innovation • FALL 2013 1312 Open Innovation • FALL 2013
Practical Advice for Your Open Data Program 3 Critical Areas Your Open Data Policy Should Cover
3 Critical Areas Your Open Data
Policy Should Cover
that, the possible goals – and benefits
– are many. They can range from better
efficiency in handling public information
requests, to increased innovation in the
private sector in developing tools for
citizens.
In Chicago, one city goal was to improve
preparedness for winter storms. So,
their open data program provided the
data sets for web and app developers to
build Winter Apps, a variety of resources
to help citizens get ready for and cope
with winter weather.
It’s important to be explicit about your
purpose, so all stakeholders are clear
about why they’re doing the work. Your
goals should also be measurable. Do you
hope to increase bus ridership or launch
five new apps for citizens? Stating
them clearly in your policy will help you
demonstrate the success of the program
later on.
2. Data sets: What are we
(and what aren’t we) going
to publish?
You likely have a vast number of data
sets that could be valuable if included in
your open data program. What should
you plan to publish? Even if you’re
starting small with a pilot program,
your policy is a good place to state
the scope you’d like to encompass
eventually. Because transparency is a key
component of the move toward open
data, we recommend publishing
as much as possible.
As an example, New York City’s policy 
is to publish all city data that doesn’t
include personal information. That
means all non-personal data should be
“open by default” and published on
their data portal. An “open by default”
approach saves time in deciding what
data should or should not be made
available.
3. Designated roles: Who
and what is needed to make
this program a success?
You need a team of people to make
this project successful. For example,
you’ll need your chief executive to
secure funding for this work, your
communications officer to communicate
internally and with the public, and IT
people to connect with the developer
community – just to name a few.

Be thorough about listing all the
contributions this program will need
to succeed. And then be clear in
this section of your policy about the
expectations and responsibilities of each
stakeholder. You may also use this part
of your policy to create a working group
to give all the stakeholders a forum to
discuss their progress.
Examples of open data
policies
Open data policies can look very
different, depending on the organization
they are developed for. You may
find it helpful to look at some of the
policies of pioneering cities like New
York and Chicago. Both have official
open data policies to increase
You know open data is a good idea.
But are all your stakeholders on board?
And if they are, does everyone know
what needs to be done to make this
initiative happen?
line items in your policy can be many,
in our experience working with various
cities and organizations, we’ve found
that good data policies cover three
critical areas: 1) the organizational goals
that this program hopes to achieve, 2)
the data sets you will publish, and 3) the
designated roles of each team who will
help to complete the work.
1. Goals: Why are we taking
on an open data initiative?
What does your organization hope to
achieve with an open data program?
One of the primary motivators is to
deliver on the promise of transparency
by providing data that shows how
taxpayer dollars are being spent. Beyond
transparency, further goals, and create
economic opportunities for citizens. Take
a look and learn from those who’ve
done it already.
An official open data policy is one
of the most effective ways to
achieve organizational support and
transformational change through your
initiative. It makes sure everyone is
on the same page about why you’re
publishing data, who is responsible for
what, and what data you are (or aren’t)
going to publish.
Taking the time to thoughtfully put this
information together in a policy is well
worth the effort. It will provide direction
for everyone who will be involved in
making this work a success.
What should your open data policy
include? The Sunlight Foundation has
a living document full of guidelines for
open data policies. While the possible
New York City has
taken a leadership role
in the implementation
and growth of open
data as a service
for its citizens. Its
open data legislation
creates a citywide,
comprehensive
policy – a common
set of standards and
guidelines for the
City’s ongoing open
government efforts.
Transparency is a
key component of
the move toward
open data.
Open Innovation • FALL 2013 1514 Open Innovation • FALL 2013
Practical Advice for Your Open Data Program 6 Steps to Open Data Success
6 Steps to Open Data Success
on to more complicated sets like ethics
data, such as campaign donations and
lobbyist salaries.
It’s tempting to avoid publishing certain
data sets because you fear that they are
not comprehensive or well organized
enough. However, based upon what
we’ve seen in the open data field so far,
you get points from your citizens for
being forthright. Transparency may be
scary to some, but it’s worth its weight
in citizen trust that comes as a result.
Tip: Think about building helpful
visualizations and browsing filters
to help people interact with and
understand the data with little effort.
For example, if it is budget data, a pie
chart of budget by department might
be helpful. You can then embed these
charts on your website where they can
be automatically updated. See more tips
for achieving transparency.  
Step 3: Listen to Developers
in Your Community
Developers in your community are
essential for their creativity and honest
feedback. By talking to them, you get a
better sense of what sorts of data sets
might be useful for apps. One way to
do this is to host a meet-up group and
just listen. How is their access to the
data? Are there any other resources that
would make app creation easier
for them?
Be humble and collaborate! Your
initiative will be all the better for it.
Developers are key partners in putting
your data to work and improving
citizens’ quality of life.
Tip: Successful programs, like the NYC
Big Apps competition and the Evergreen
Apps Challenge have engaged
developers in a community to build
many successful apps for citizens. Learn
from these models and put something
like it in where you live. See more tips
for working with developers. You can
also see our guide, “How to Run a
Hackathon.”  
Perhaps you’ve read about the success
of open data programs seen in
Chicago, New York, San Francisco or
other cities, in terms of lowered crime
or financial transparency. You’ve heard
about the increased efficiency and
community engagement an open data
program can bring. But, does getting
started sound overwhelming?
Socrata has worked with many of
these open data leaders. From our
time with them, we’ve come up with
six key steps to build an open data
program. We hope that using them as a
framework for your initiative helps make
the process manageable, and it helps
ensure all your bases are covered.
Step 1: Start Small
Transportation data. Financial records.
Crime data. There are lots of places to
start. But don’t get bogged down at the
beginning with the number of data sets
you could publish. Lots of initiatives we
now look to as examples of transparency
started small. In fact, many began with
just one data set. Kansas City, Mo.,
the State of Missouri, and the United
Nations Development Programme all
started by focusing on one high-value
data set that they wanted to make
available through multiple interfaces, like
APIs, visualizations, and embeds.
The key is to focus on quality over
quantity at the beginning. With just one
new and useful resource available, your
community will appreciate the first step
toward transparency and information
they can use.
Tip: Start with easy data sets first, those
that are already available in spreadsheets
or PDFs in the public domain. Then,
expand their use to multiple interfaces,
such as an interactive visualization or
map. See more tips for starting small.  
Step 2: Focus on
Transparency
Keep your eye on achieving
transparency, an essential goal for
most government open data initiatives.
Start with the easy data sets. These are
usually financial and personnel data,
because they are typically standardized
in format, well-organized, and available
in multiple departments already. Once
you have those published, you can move
Data that has
longitude and latitude
information can be
easy to find and load
into your open data
portal. And, Socrata
customers have found
that maps are some
of the most common
visualizations that
citizens create.
Transparency may be
scary to some, but
it’s worth its weight
in citizen trust that
comes as a result.
Open Innovation • FALL 2013 1716 Open Innovation • FALL 2013
Practical Advice for Your Open Data Program 6 Steps to Open Data Success
Step 4: Increase Internal
Participation
Getting all of your co-workers onboard
can be one of the most difficult parts
of launching an open data program.
Everyone is strapped for time and often
responsible for multiple job descriptions,
so it may be difficult to get them
excited about a large new initiative.
Nevertheless, it is essential to win them
over, because open data programs
flourish with broad support.
The key message is that, in the end, an
open data program makes everyone’s
job easier. As you begin this work,
ask about information bottlenecks in
your agency’s process, and be clear
about addressing them early on with
your initiative. Your staff can be the
primary beneficiaries of easier access to
information achieved through this effort
– be it through less duplication of efforts
to easier collaboration with better access
to data.
Tip: Showcase studies from other
government organizations where their
peers have transformed their business
processes. See more tips for increasing
internal support. 
Step 5: Optimize for
Efficiencies and Cost
Savings
How much would it save your
organization if even 10 percent of
high-touch interactions could be moved
to self-service channels? In addition to
increasing transparency and improving
citizen experience, it also saves time and
money when you move your data to
an open data platform with automated
updating. For example, the Oregon
Marine Board significantly reduced
time spent creating print resources and
costs associated with publishing and
distributing with just one open data
project.
Your staff will have more time, money,
and energy to spend on projects that
require more individual service.
Tip: Look at the most common public
information requests and see which of
these may be easy candidates for data
publication. Try to move these requests
for information to self-service channels
early on to free up time, resources,
and increase both internal and external
support for your open data initiative.
Read more efficiency tips. 
Step 6: Pool Data with
Neighboring Cities, Counties,
and States
Once your data is published, it opens
whole new possibilities for working with
surrounding cities, counties, and states.
Two-way exchanges of data, called data
federation, with other jurisdictions is
possible when data sets are published
in standard formats, a key feature of an
open data initiative.
The benefits of data federation are
numerous, including easier sharing
and comparison for citizens about
quality of life in their surrounding
areas. For example, the City of
Chicago, Cook County, and the State
of Illinois have been able to pool their
data into a single, citizen-friendly
site, MetroChicagoData.org. Citizens are
now able to get comparable information
about their surroundings in one spot.
Read more about the benefits of
federation. 
Conclusion: Don’t Get
Bogged Down By the
Enormity
All of these steps can be taken in
tandem with one another or in any
order that suits you best. Think through
what will work for your organization. If
you get overwhelmed, remember to:
1) Ask for help and feedback. Get
input from your colleagues and
community members. Don’t get caught
up in a top-down system. There are lots
of great minds out there. Use them!
2) Build with sustainability in
mind. Start small, start easy, and pick
data that will be most likely to increase
efficiency. This will in turn open up time
to take on the more difficult tasks down
the road.
This Oregon Marine
Board (OMB) map
shows citizens where
they can launch their
boats. As information
changes, the OMB
can easily update it in
the data portal, rather
than producing and
mailing out a new flyer
of launch locations.
Your staff can
be the primary
beneficiaries…
through less
duplication of
efforts to easier
collaboration
with better
access to data.
Open Innovation • FALL 2013 1918 Open Innovation • FALL 2013
Practical Advice for Your Open Data Program 3 Guidelines for Publishing Your First Open Data Sets
3 Guidelines for Publishing Your
First Open Data Sets
You may also want to ask your co-
workers what data will help them to do
their job better or more easily.
As an example, the Oregon Marine
Board used open data to help achieve
their strategic goal to educate citizens
about boating safety, education, and
access. They used their open data
platform to create interactive maps
that let citizens know information
such as location-specific waterway
regulations, where to register a boat,
where to purchase various permits,
view boat ramp locations, and more.
This ended up saving the Marine Board
time, materials costs, and labor costs
– all while using data to achieve a
mission-based goal. Read more about
the Oregon Marine Board’s open data
experience.  
2. Publish data that
is already (or easily)
available and organized
Open data may be new, but publishing
data online is not. It’s more than
likely your agency already has some
data available, often via PDFs, Excel
spreadsheets, or other offline database
extracts, shapefiles, and KML files. Since
they’re already organized and perhaps
online already, these are great places to
start for your open data project.
Starting here means that you’ll begin by
republishing these sets in all the required
formats, so that they are easily accessible
and machine-readable. (Learn more
about data formats and standards.)  
Another way to approach this starting
point, especially if you’re currently
publishing very little data online, is
to start with data that is easily made
available. Usually, this will be financial
transparency and personnel data about
your organization. That’s because it
is typically well-organized and can be
easily extracted from your back-end
financial systems as clean spreadsheets.
Once it’s loaded on your platform, you
can use it to build helpful visualizations
and guided browsing filters to help
citizens interact with and understand the
data with little effort.
One good example of this is the Ethics
section of Data.gov. There, citizens can
search, download and visualize extensive
campaign funding and other data.
Before publication on the open data
portal, this would have been available
only in spreadsheets or by submitting
a public information request. Now, the
data can be easily filtered and viewed
through a variety of customizable charts,
tables, and sorting features, delivering
on the promise of transparency and easy
access for citizens.
3. Publish the information
citizens and developers are
asking for
This is one of the best places to start
if your agency wants to increase citizen
satisfaction and reduce repetitive
handling of frequent information
requests. There are many ways to
find out what information citizens
are searching for or requesting most,
such as:
•	 Analyze your website data, using
programs such as Google Analytics
•	 Review your Freedom of Information
Act requests
•	 Survey your internal public
information officers, clerks,
and disclosure teams
•	 Directly request feedback from
constituents and developers
Using feedback as your starting point
is an organic process. After gathering
suggestions, it will require prioritization,
often based on strategic goals or how
much work it will take to provide the
requested datasets on your portal.
What is exciting about starting here
is that it kicks off your initiative with
widespread engagement. It will also help
you measure the interest level of your
community on a variety of community
concerns. These may surprise you! From
recycling data to health inspection data,
take a look at what other open data
leaders have learned about which data
sets the public finds most useful.  
You’ve decided now is the time for
your agency to get started with an
open data program. But how do you
decide which data sets to publish first?  
There is no standard formula that applies
to all organizations. Depending on your
program goals and priorities, there can
be any number of good places to start.
However, in working with a variety of
organizations, we have identified a few
smart starting points that have worked
well. We hope they will help you decide
the best route to take as you kick off
your open data initiative.
1. Publish data sets
that help fulfill your
organization’s mission
and goals
Drawing clear connections between your
data program and your organization’s
mission will help win support, as well as
give your program purpose, discipline,
and measurability.
Start by looking over your organization’s
strategic plan. Then, identify within it
potential data sets that would have the
biggest impact on achieving those goals.
The Oregon Marine
Board’s boater
information maps
offer more than just
the location of launch
points. The “flyouts”
give citizens detailed
information about
specific facilities,
construction details,
phone numbers,
and more.
Depending on your
program goals and
priorities, there can
be any number of
good places to start.
Open Innovation • FALL 2013 2120 Open Innovation • FALL 2013
Op-Ed: Open Data Is Re-Defining Government in the 21st CenturyOp-Ed: Open Data Is Re-Defining Government in the 21st Century
Op-Ed: Open Data
Is Re-Defining
Government in
the 21st Century
by Kevin Merritt
CEO of Socrata
Perhaps it’s the constrained fiscal reality, punctuated by threats of government
shut-downs. Or maybe it’s the ideological wars in Washington, playing out
most recently in the battle over privacy and security sparked by revelations about
the PRISM surveillance program. Whatever the reasons, the public sector in the
21st century gets a bad rap. As Tim O’Reilly, the founder of O’Reilly Media, has
said, government is seen by legions of citizens from coast to coast as a bloated
and inefficient ATM that takes in taxes and delivers mediocre services in return.
Even a muscular liberal like Paul Krugman of The New York Times calls the federal
bureaucracy “an insurance company with an army.”
But a new movement, spurred by digital and social activism, is taking root to
renovate and redefine the public sector.
This movement is based on democratizing the vast treasure trove of data that
governments have accumulated over the years, transparently releasing it so citizens
and companies can drive meaningful change and solve problems that government,
on its own, cannot solve.
“Opening up data,” says Todd Park, the U.S Chief Technology Officer, “means
taking data that is sitting in the vaults of the government, that the taxpayers have
already paid for, and jujitsuing it into the public domain as machine-readable fuel for
entrepreneurship and innovation.”
This emerging digital collaboration between the public sector and scores of
entrepreneurs across the nation has the potential to profoundly transform the role
of government. Indeed, instead of being an ATM, as O’Reilly observes, it’s now
an accelerator that helps inspire and build new businesses that bring fresh ideas,
programs and initiatives to the public.
Open Innovation • FALL 2013 2322 Open Innovation • FALL 2013
Op-Ed: Open Data Is Re-Defining Government in the 21st CenturyOp-Ed: Open Data Is Re-Defining Government in the 21st Century
New York City, for instance, has
passed landmark open data legislation
designed to move public information
from the hands of city officials to the
public. The broader access to data is
saving New York millions of dollars.
Mayor Bloomberg’s “geek squad”
of data crunchers already has solved
complicated and expensive problems,
like tracking down damaged trees after
Hurricane Sandy or mapping which
restaurants dump harmful cooking
grease into city sewers.
Meanwhile, New York’s annual BigApps
competition has citizens creating apps
with public data, like Work+, which
finds the nearest coffee shop with Wi-Fi.
This culture of citizen-made apps has
proved unexpectedly cost-effective.
For example, the Metropolitan Transit
Authority hired a local firm to produce
an app showing real-time bus arrival
times after it determined that in-house
production would cost hundreds of
millions of dollars. The final price tag?
Less than $1 million.
Meanwhile, Chicago also is driving
innovation with open data. It recently
placed first in the Bloomberg Mayors
Challenge, based on its proposal to build
the first open source, predictive analytics
platform. When completed, it will
aggregate information in a single place
to help leaders make smarter, faster
decisions and prevent problems before
they develop.
Chicago is making data available
around persistent problems and
challenging citizens to find solutions.
Ever wonder where a snowplow is
during a snowstorm? There is an app
for that, which means fewer calls to the
city. Need to check the status of 311
service requests? The most recent data
is delivered to citizens’ mobile devices,
along with public parking availability,
bike maps, crime information, and more.
Major universities have seen data’s
potential to transform cities and are
dedicating resources to it, such as
University of Chicago’s Computational
Urban Sciences Center, MIT’s Civic
Data Design Project, and New York
University’s Center for Urban Science &
Progress.
States are getting in on the action
too. Maryland has rolled out StateStat,
a performance measurement and
management tool based on open
data. StateStat is credited with helping
Maryland save millions of dollars on
prison costs while raising public school
test scores to the highest level in the
nation four years in a row.
As a software entrepreneur, I see
open data as the transformation of
governments from monolithic service
providers to open innovation platforms,
fueled by data. This shift may hold the
answers to some age-old problems in
government, like chronic inefficiency
There are several striking examples of
new companies using open government
data to create programs that benefit our
communities.
OPower, for example, leverages
government data on energy use,
weather, and appliance efficiency to give
customers personalized advice on how
to save on their energy bills. Employing
over 250 people, OPower has helped
residential customers save more than 1.4
terawatt hours of electricity (enough to
power all of the homes in a small city
for a year) and over $165 million on their
power bills.
BillGuard uses the Consumer Financial
Protection Bureau’s new credit card
complaint database to help find
deceptive, erroneous, and fraudulent
charges on users’ credit and debit card
bills. BillGuard’s free software alerts
consumers whenever a charge on
their bill has been reported by others
as fraudulent and then assists them in
getting their money back. 
And iTriage has harnessed
downloadable information from the
Department of Health and Human
Services to develop a mobile application
that has helped eight million people
find the best local doctors and hospitals
that meet their needs. Founded by
two emergency-room doctors in 2008,
the company has approximately 90
employees, over 600 hospital partners
and thousands of physicians and urgent
care partners who all are working to
help provide more information and
better care to consumers.
The ‘Micro-Data Economy’
This isn’t the first time businesses have
generated growth and prosperity by
accessing open government data.
In the 1970s, for instance, the release of
data collected by the National Oceanic
and Atmospheric Administration
changed scores of industries and even
created a new one -- the weather
industry. This was followed by the
release of GPS data in the 1990s, which
gave citizens location services now
considered essential by many.
As Beth Blauer, my colleague at Socrata,
points out, we’re now living in the
“Micro-Data Economy,” and the next
wave of innovation and innovative
businesses will flow out of thousands
of micro datasets released by the public
sector: crimes in our neighborhoods;
real-time bus locations; restaurant
inspections; and permit and license
applications, to name just a few.
The executive branch of the federal
government is a major player in the
ongoing open-data movement.
One of the White House’s key digital
objectives is to “unlock the power of
government data to spur innovation
across our nation and improve the
quality of services for the American
people.”
To help achieve this ambitious goal, the
Obama Administration is opening up
new government data sets, launching
new prizes and challenges to spur
innovative use of data, and showcasing
entrepreneurs who are developing new
apps and services fueled by open data.
Says Ian Kalin, a Presidential Innovation
Fellow who has been immersed in
the Obama Administration’s open
data efforts: “This is all about the
government releasing data at the
wholesale level so that entrepreneurs
can help provide retail services that will
spur economic growth, create jobs, and
improve the quality of life for millions
of Americans.”
 
Cities and states are also setting the
tone and agenda for the move to open
data in the public sector today.
and a citizen experience that’s out of
step with the modern consumer era.
“This is the right way to frame the
question of Government 2.0,” explains
O’Reilly, a leading open data advocate.
“How does government become an
open platform that allows people inside
and outside government to innovate?
How do you design a system in which
all of the outcomes aren’t specified
beforehand, but, instead, evolve through
interactions between government and
its citizens, as a service provider enabling
its user community?”
The answers to these questions are still
taking shape, but one thing we do know
is that the strategic use of data is clearly
re-defining government’s role in the
21st century.
This emerging digital collaboration
between the public sector and scores of
entrepreneurs across the nation has the
potential to profoundly transform the role
of government.
There are several striking examples of
new companies using open government
data to create programs that benefit
our communities.
NYC Digital
Mission: Make NYC the world’s leading digital city
Part of the Mayor’s Office of Media and Entertainment, NYC Digital streamlines
digital communication with the public and creates public-private partnerships
that serve New Yorkers and support local industry.
January2011NYCDigitalestablished
January 2011
Rachel Haot
named NYC Chief
Digital Officer
May 2011
NYC Digital
issues first
Digital Roadmap,
outlining a path to
realize New York
City’s potential as
the world’s leading
digital city
June 2011
Free WiFi made
available in city
parks
September 2011
Engage NYC,
first annual social
media summit held
July 2011
NYC hosts first
Hackathon to
reinvent NYC.gov
February 2013
Michael Flowers
named NYC Chief
Analytics Officer
October 2011
Launch of
new NYC Open
Data platform
(nyc.gov/data)
powered by
Socrata; over 750
datasets available
May 2013
City of New York
is approved for its
own geographic
top-level domain,
.nyc
May 2012
Launch of Made
in NY Digital Jobs
Maps, highlighting
the 1,000+ tech
companies hiring
in New York City
December 2012
NYC launches
the Reinvent
Payphones Design
Challenge
June 2013
Mayor Bloomberg
announces winners
of 4th annual NYC
BigApps. Winning
applications
receive cash prizes
totaling $150k
August 2012
Introduction of
the Small Business
Digital Toolkit,
which helps local
businesses attract
customers online
December 2011
Mayor Bloomberg
announces
partnership to
build Cornell-
Technion applied
science and
engineering
campus
March 2012
NYC named “The
Most Economically
Competitive City
in the World” by
the Economist
Intelligence Unit
NYC Local Law
11 mandates
open access to
city government
datasets
Impact
4 Stories of
Open Data
success
	 A Three-Year Problem Solved in Two Hours	 6
	 “Set It and Forget It” Saves San Francisco Staff Time	 10
	 King County Elections Takes Open Data Mobile	 14
	Hard Copy Is History: Web-Based Reports Save Paper, Time & Money	 18
Open Innovation • FALL 2013 2928 Open Innovation • FALL 2013
Impact A Three-Year Problem Solved in Two Hours A Three-Year Problem Solved in Two Hours Impact
A Three-Year
Problem Solved
in Two Hours
State of Oregon: Marine Board
For three years, Ashley Massey
sought a way to create an
easy-to-update, online map of
resources for Oregon boaters.
Her odyssey ended with her first
map on Socrata.
How much time did she need to
make it? Two hours.
How much did it cost her?
Nothing.
Mayday! Troubled
Technology Waters
“My job is to reach out and grab as
many people’s attention as I can about
the Marine Board’s mission of boating
safety education and access,” says
Massey, public information officer for
the Oregon Marine Board.
Massey found a great solution with
open data. Her journey toward it began
in 2007.
2007 - The Marine Board’s seven-
year-old Microsoft Access database
of boating facility information was
damaged.
2008 - Massey and colleagues
recompiled all of their boating access
information and entered it into Google
Maps. “We had to manually enter each
boat ramp location and manually place
the dot on the map. It was very labor
intensive,” says Massey.
2009 - Disaster occurred when all
of their work in Google Maps was
accidently deleted.
2010 - Massey spent six months
researching vendors and price
agreements. “The cheapest solution we
found was for $100,000, and it wasn’t
capable of doing searches, so it really
wasn’t an option,” says Massey.
When the Oregon
Marine Board team
loaded their water
hazard and boat ramp
data onto the state’s
open data portal they
could easily visualize it
as maps. Those maps
were then embedded
on Oregon.gov.
A Seaworthy Solution
In the summer of 2010, Oregon’s
eGovernment Program Manager Wally
Rogers presented the state’s new open
data portal hosted on Socrata. Massey
recognized the solution to her problems.
“I was excited. I said, ‘I’m ready to
rock’n’roll.’ We already had a dataset
and a vision for the look-and-feel ready
to go,” says Massey.
Rogers sat down with her that day,
taught her how to upload a dataset,
and visualize it in a map. Once the
main map view was created, Massey
and colleagues were able to add icons
and images. Massey had her first map
completed in less than two hours.
Open Innovation • FALL 2013 3130 Open Innovation • FALL 2013
Impact A Three-Year Problem Solved in Two Hours A Three-Year Problem Solved in Two Hours Impact
Keeping Oregon Boaters
Buoyant
The following datasets (and more) are
now available to Oregon’s boaters on
Socrata’s platform:
•	 Where to find clear gasoline
•	 Where to purchase aquatic invasive
species permits
•	 Where to register a boat
•	 Boat ramp locations
•	 Pumpout and dump stations
•	 Floating restrooms
•	 Navigation obstructions
•	 State-approved “clean” marinas
•	 Location-specific waterway
regulations
A Boatload of Savings
The regulation handbook that the
Marine Board would produce every two
years would cost about $150,000, “and
it would only last two years,” Massey
emphasizes.
Time Savings: “Using Socrata has
essentially shaved 50 percent off the
time I used to use for print publications.
I now have more time I can put into
doing public relations and marketing
that I didn’t have time to do before.”
The team at OMB used familiar
symbols on their maps to mark
boat ramps, restrooms, and other
resources. And, their most up-to-
date water hazard information was
now available on the website map –
no phone calls needed.
Efficiency: “Now, when we find
out about a facility change, we have
a form through the platform that our
boating and waterway managers can
submit to us. When we approve it, it
automatically populates the dataset.
It’s live.”
Accuracy: “We have minimal data
entry now. And we’re getting [the
information] from the source - the
boating facility managers who operate
the sites.”
Cost Savings: “We used to send out
yearly surveys and only half, if that,
would get returned. We’d do follow-
up phone calls and annual site tours.
Getting people out of the office and on
the road to verify the condition of boat
ramps was a huge expense. We’ve got
over 1,000 boat ramps in Oregon.”
“Using the platform is saving money
and making operations so much more
efficient. We’re even getting pictures
from the waterway managers that we
can import directly into the dataset.”
Happiness: “I can’t sing the praises
of our open data platform enough. It’s
completely changed the way we look
at doing business.”
Embarking on a Bright
Future
Massey takes advantage of every new
feature Socrata creates. “The capabilities
continue to grow. Socrata keeps us
updated on their latest innovations and
platform development. When we see
new opportunities to enhance the maps,
we seize them. The maps keep getting
better and better,” says Massey.
What are Massey’s biggest data dreams
for the future? “I hope that one day all
of Oregon’s natural resource agencies
can share our data and, ultimately,
our resources. Together, we have the
information that people want, whether
they are camping, boating, fishing or
hiking. How awesome would it be to
get all the information recreationists
seek in one location online?”
Setting Sail with Her
Platform
Real-Time Information
“I really appreciate the
speed and ease of updating.
[The portal] helped us
move toward real-time,
digital information which is
much more cost-effective
and up-to-date than print
publications.”
Citizen Involvement
“Citizens can create new
views of the same data,
and layer datasets on top of
each other to create custom
maps.”
Embeddable Maps
“I love the ability to embed
code and share it with others.
I have embedded maps
based on certain datasets
on boatoregon.com. And, it
turns out that those are some
of the most popular datasets
available on Oregon’s open
data portal.”
Highlights
Replaced $200,000 custom-
built database from 2000 and
eliminated high maintenance
fees and server security risk
Reduced both time spent
producing print publications and
costs associated with printing,
storing and distribution by 50%
Avoided paying $100,000 for
a new, custom-built mapping
system
Paid $0 to post data on Oregon’s
Socrata open data portal
“I can’t sing the
praises of our open
data platform
enough.”
Open Innovation • FALL 2013 3332 Open Innovation • FALL 2013
“Set It and Forget It” Saves San Francisco Staff Time ImpactImpact “Set It and Forget It” Saves San Francisco Staff Time
“Set It and Forget It”
Saves San Francisco
Staff Time
City and County of San Francisco
San Francisco’s more than 800,000
residents come up with a lot of
requests. From sidewalk repairs to
campaign finance information, the City
and County of San Francisco (CCSF)
processes hundreds of requests a day.
Sound time consuming? It is.
That is why San Francisco moved to
a Socrata open data portal in 2012
with the goal of digitizing the requests
for data, updating the data more
easily, and publicly tracking progress
on requests.
It’s also why San Francisco began using
Safe Software’s FME platform to help
staff move their daily dose of data
automatically onto the Socrata platform.
Open, Transparent, and
Automatic
In 2011, San Francisco’s leadership,
including Chief Innovation Officer Jay
Nath and Chief Information Officer
Jon Walton, pushed for an open data
portal as a “one-stop destination for all
approved City data.” They had visions
of greater transparency and convenience
for citizens but soon discovered, as many
organizations do, that standardizing the
City data onto one platform improves
internal efficiency.
“It’s nice to be able to point to one spot
and say to a colleague, “You want this
information? It’s going to be on this
site. You can download it, manipulate
it, create views. And then, also, you
can embed it into your own websites,”
says Jeff Johnson, Manager of CCSF’s
Enterprise GIS Program and Open
Data Services at the Department
of Technology.
The Ethics Commission’s
High Profile Job
One of Johnson’s favorite examples of
greater efficiency through open data is
the San Francisco Ethics Commission.
It turns out that reporters, lobbyists,
candidates, and others involved in San
Francisco politics closely watch the data
the Ethics Commission reports.
“We’re under a lot of pressure to
be accurate,” says Steven Massey,
Information Technology Officer for the
CCSF Ethics Commission.
Before the November 2012 elections,
the Ethics Commission decided to use
the open data portal to optimize for
accuracy and streamline their efforts.
Massey worked with Johnson to move
all campaign finance and lobbyist
data on to the portal and have it
automatically publish to embedded
charts on sfethics.org.
“We replaced many of the tables
throughout our website with embedded
Socrata tables so that users can export
the data. We’ve gotten really good
feedback from the community about
these charts, since they are much easier
to read than our PDF financial reports,”
says Massey.
In addition, Johnson helped Massey
make uploading data to Socrata require,
truly, no time at all. Johnson suggested
Safe Software’s FME product to bring
the Ethics Commission data into Socrata
automatically. “I was familiar with Safe
Software. I use it in my GIS work, but
it can be used for more file types than
just geographical information,” says
Johnson.
Johnson asked Safe Software to
develop a writer specifically for
loading a broad range of data files to
Socrata, eliminating the need for a
unique connector to be written by San
Francisco’s busy IT Team. Having this
writer paid off in significant
time savings.
“We’ve gotten
really good
feedback from
the community
about these
charts”
Open Innovation • FALL 2013 3534 Open Innovation • FALL 2013
“Set It and Forget It” Saves San Francisco Staff Time ImpactImpact “Set It and Forget It” Saves San Francisco Staff Time
Better Reporting of Ethics
Information
Before Socrata and FME, news sources
would collect the data on candidate
funding by downloading PDFs posted
by the Ethics Commission and tallying
up numbers by hand. The process often
came with many questions for Massey
and, sometimes, incorrect results
were reported.
In the 2012 election season, reporters
from the SF Weekly, SF Appeal, SF Bay
Guardian, SF Chronicle, and SF Examiner
were all able to report on the data the
Ethics Commission published without
going through that manual process.
“Now, when people call in, you direct
them to the site and you’re done,” says
Massey.
Johnson is excited about improving both
transparency and efficiency for CCSF
staff, without asking for much extra
effort from them. “Our Open Data
policy directs City agencies to load data
onto the data.sfgov.org platform, so we
need to make it as easy as possible,”
says Johnson. “They have a job to do -
get graffiti covered, fill potholes, share
financial data. That’s their business.”
A Smooth Transition
Massey says that the transition from
PDFs to automatic uploads on the
open data portal was quick. “Within a
couple of days I had what I wanted up
and done. Jeff finished the scheduled
data updates in August and I had the
summaries up right after that with all
the graphs,” says Massey.
By providing up-to-date campaign finance information in a single, public location,
the Ethics Commission allowed journalists and candidates to track reporting on
funds without submitting an information request.
Plus, Massey enjoyed a surprising benefit
from the new automated and visualized
data that Socrata and FME made
possible.
Campaign finance data has received
wider attention now that it is more easily
available. “Prior to Socrata, campaign
finance data was most valuable to
reporters. It made it into the newspaper
quite a bit. Now it’s in regular demand
from a broader audience,” says Massey.
Massey considers this a win for public
data transparency.
Getting Citizens What They
Need, Easily
Overall, time savings, improved
transparency, and greater accuracy have
meant the most to the CCSF team, “I
now have uploads that run every night
from various databases around the city.
We call it “set it and forget it,” says
Johnson.
Johnson is even canvassing city
and county agencies to instruct his
colleagues about the use of FME along
with Socrata. “FME is a very simple
tool. That’s the beauty of it.” Johnson
wants to keep San Francisco’s staff
working hard on what matters, serving
more than 800,000 citizens with the
data and support they need everyday,
as easily as possible.
Highlights
CCSF staff are able to respond
more quickly and easily to citizen
requests
Ethics Commission, GIS, and
other data is scheduled to
update automatically every night
via FME
Socrata charts embed on to the
Ethics Commission website and
serve up-to-date data
Greater accessibility to campaign
finance data increases citizen
engagement with it
Before up-to-date campaign finance data was
made available in an open format, reporters
used to make written requests for information to
the Ethics Commission and calculate totals per
candidate by hand.
Thanks to Safe Software’s FME, new data gets
automatically loaded onto CCSF’s open data
portal, keeping related charts up-to-date and
saving the Ethics Commission team time.
Open Innovation • FALL 2013 3736 Open Innovation • FALL 2013
King County Elections Takes Open Data Mobile ImpactImpact King County Elections Takes Open Data Mobile
King County Elections
Takes Open Data Mobile
King County: Elections
Recreational marijuana use? Same sex marriage?
Romney or Obama?
These contentious issues had Washington state
citizens closely watching the races leading up to
their Nov. 6, 2012 election night.
Behind the scenes of all this excitement, in the
most populous county in the state, King County
Elections offered its nearly 1.2 million registered
voters something they’d never had in an election
before: mobile-friendly voting information
and results.
Providing What Citizens
Want
Where do citizens look for the
information? Increasingly, they rely
on cell phones.
In fact, King County voters indicated
in a 2011 survey that there were a
number of elections-related actions
they’d like to be able to do via their
mobile devices. Those that rated the
highest included checking the latest
elections results and counting down
the time left to return a ballot.
“Our goal was to provide voters with
easier and faster access to elections
information so they could get what
they needed most while on the go,”
says King County Elections Chief
Communications Officer Kim van Ekstrom.
A Short Deadline
King County Elections received funding
from the state’s share of a “Help
America Vote Act” grant to develop
web-based tools for voters. The final
decision to move forward on mobile
came just a month and a half before
the 2012 presidential election ballots
were to be sent out.
“Most of our work on the grant had
already been completed. By the time
we decided to develop pages for mobile
devices, the project was running out of
time and we did not have the ability to
extend the grant. We utilized Socrata
to piggyback the project on the open
data platform,” says Dale Hartman,
IT manager for King County.
King County, Washington hosts tech-savvy
Seattle and its surrounding communities. The
King County Elections team wanted to serve
voters in the county better by improving access
to voting and election results information.
Open Innovation • FALL 2013 3938 Open Innovation • FALL 2013
King County Elections Takes Open Data Mobile ImpactImpact King County Elections Takes Open Data Mobile
Interactive and Mobile-
Friendly Open Data
Using Socrata DataSlate, Socrata’s
team built web pages specifically for
small, mobile devices, with interactive
charts visualizing results, as well as an
interactive map of ballot drop
box locations.
Interactive: The charts allowed users
to scroll over certain sections to get
more detail.
Dynamic: All of the charts were
updated automatically a soon as
King County loaded fresh results or
information to their FTP site.
Practical: The mobile-friendly map of
ballot drop box locations gave users
“pinpoints” they could select to request
directions to their nearest ballot drop
box location. They even received a site
photograph as a reference.
In addition, Socrata built an updated
“Countdown Clock” to the ballot drop
off deadline that would look great on
mobile devices.
Throughout the
election season,
voters were given
up-to-date maps
of ballot drop box
locations, as well
as daily updates
on election results.
Citizens could see
this information both
online and on their
mobile devices.
When King County
Elections polled
voters about what
technological
improvements
they wanted to see
most, the public
overwhelmingly
requested better
mobile access to
election information.
Just in Time for the
Elections
The project was completed successfully
and on time. “It was a good
collaboration. We delivered the services
that we wanted to, they looked great,
and we were able to do it on a short
timeline,” says van Ekstrom.
King County Elections’ efforts to make
their Nov. 6 elections results more
accessible paid off. More than 236,000
people visited the King County site
and viewed the new charts and maps
embedded on those pages.
King County Elections’ site became
the busiest site Socrata supported
on November 6, 2012. Fortunately,
because Socrata’s technology is cloud-
based, there was no interruption in
service to visitors. Every citizen who
wanted to see election results was able
to see them - on their computer or their
mobile device.
A Model for the Future
As mobile election results become the
norm, King County Elections’ initiative
will serve as a model for success.
Commenting on King County’s efforts
to keep up with the tech-savvy citizens,
IT manager Dale Hartman said, “King
County Elections has an excellent track
record of using technology to improve
service to citizens. The development of
this mobile tool is a natural next step for
Elections and King County government
to deliver customer service and
recognize the needs of our citizens.”
Highlights
Citizens access data on web or
mobile
Updated results instantly
and automatically appear in
embedded maps and charts
236,000+ views of mobile-
friendly maps and charts on
election night
Capacity to handle election-
related traffic spike thanks to a
cloud-based solution
Scalable systems supports 90
races and measures
From concept to delivery in less
than two months
Open Innovation • FALL 2013 4140 Open Innovation • FALL 2013
Hard Copy Is History: Web-Based Reports Save Paper, Time & Money ImpactImpact Hard Copy Is History: Web-Based Reports Save Paper, Time & Money
Hard Copy Is History:
Web-Based Reports Save
Paper, Time & Money
State of Washington
Every year, government agencies produce reports
that inform government policies and where tax
dollars flow.
Expensive to produce and print, these paper-
based reports are often hundreds of pages long,
take thousands of hours to create, and are out of
date by the time they are published.
Until now...
Washington’s Salmon
Recovery Team Thinks
Forward
“We have a statute that requires us
to produce a report every two years
about the state of salmon recovery in
Washington, as well as watershed health
and funding,” says Jennifer Johnson,
Recover Implementation Coordinator for
the Governor’s Salmon Office (GSRO) in
Washington State.
Johnson says the report is typically 150
pages long and costs the GSRO up to
$50,000 to produce, not including staff
time.
“I wanted to move to something less
expensive, more frequently updated,
and more accessible to the public,” says
Kaleen Cottingham, Director of the
Recreation and Conservation Office,
which manages the GSRO.
Cottingham and Johnson knew what
they wanted to achieve but had no
model to follow. They hired cloud-
based solutions provider Paladin Data
Systems, SBGH-Partners, and Mt.
Olympia Design Studio to build a web
site for the salmon recovery report and
to post images of spreadsheet data,
charts, and graphics. Their initial plan
was to publish a similar, static report
with a bit more detailed information and
a lot less paper.
Socrata’s Platform Enters
the Scene
The team began to gather data from the
departments and regional biologists that
contribute to the report. When they
reached out to the Department of Fish
and Wildlife (DFW) they were told to
go to Washington State’s open data site
hosted by Socrata, data.wa.gov, to get
the latest information.
“We saw the Socrata tool and thought,
‘This is cool. Maybe we could do twice
as much in half the time with real,
live data and cover more populations
of salmon,” says Paladin and SBGH-
Partner’s Scott Boettcher.
They had kicked off their project in April
2012, with a deadline to produce the
report by December 2012. They began
loading data onto the Socrata platform
starting July 2012.
“I did a lot of reworking of data so we
could get it into cleaned-up tables that
we could easily upload. Data would
come to us in landscape, portrait, Word
docs, spreadsheets, phone calls, and
more,” says Boettcher.
Determined to finish on time, the team
forged forward.
The GSRO team used Socrata to create
350 visualizations of the data they had
collected, and then embedded those charts
on the “State of Salmon” website.
“We saw the Socrata
tool and thought,
‘This is cool. Maybe
we could do twice as
much in half the time
with real, live data”
Open Innovation • FALL 2013 4342 Open Innovation • FALL 2013
Hard Copy Is History: Web-Based Reports Save Paper, Time & Money ImpactImpact Hard Copy Is History: Web-Based Reports Save Paper, Time & Money
A More Accurate Report
As part of producing a digital
report, Johnson wanted to publish
more granular data in addition to
summarized information. The paper
report published previously had offered
“roll-ups” of information, rather than
raw, source data.
“The report would be more accurate at
a finer scale so we decided to show all
of the fish populations, About 150 are
listed under the Endangered Species
Act, and then we chose to include
some non-listed populations, as well.
We ended up with a pretty heavy load
of data,” says Johnson.
Improving the report required extra
work with regional fish biologists and
other agencies to ensure accurate
reporting and getting the data loaded
onto the platform on time.
Cottingham supported Johnson’s wish
to offer greater detail, “There is a
paradigm shift. People used to have
power because they controlled the data.
Now we’re shifting to an expectation
publically that we earn respect by being
transparent and sharing our data.”
A Do-It-Yourself Approach
In the end, the group pulled together
and published on time with about 250
web pages, 350 charts and graphics,
and many improved data steward and
data management relationships. “It was
a change project and change projects
always have turbulence. If you look at
our timeline and what we achieved,
it’s remarkable we pulled it off,” says
Boettcher.
The State of Washington
hosts a number of salmon
species that are listed
as “endangered” or
“threatened” under the
federal Endangered Species
Act. The State of Salmon
report provides data on
their recovery.
“If you look at our
timeline and what
we achieved, it’s
remarkable we
pulled it off”
Cottingham’s vision was now a reality.
Her team had pioneered a paper-free
report with visualizations, plus now the
data could be fed through the state’s
open data portal to update those
visualizations automatically.
And, this framework will serve them
well for years to come.
“We have a system that Jennifer can
manage entirely on her own. That
was a piece that was very important to
Kaleen, that GSRO would be left with a
Highlights
Replaced a 150-page paper
report with an interactive
website
Saved $10,000 in printing costs
Eliminated the cost of mailing
out 400+ copies of a 150-page
report
Created embeddable charts,
automatically updated when
new data comes in
Improved engagement with field
biologists for more accurate data
reporting
Collaborated with multiple
departments to improve data
quality
Report Website:
http://stateofsalmon.wa.gov
tool it could manage and manipulate on
its own,” says Boettcher.
The GSRO team looks forward to adding
even more detail to the report in the
future and encouraging data sources
to submit data in easy-to-load formats.
They’re optimistic.
“Bringing in even more sources of
data can be a challenge, but through
the collaboration you’re getting
better information in the end,” says
Cottingham.
Open Innovation • FALL 2013 4544 Open Innovation • FALL 2013
Our 10 Favorite Open Data AppsOur 10 Favorite Open Data Apps
Our 10
Favorite
Open Data
Apps
Hundreds of developers around the world have used
open data hosted on Socrata to create apps for everyday
citizens. We feature 10 of our favorites here.
1. TowText
Chicago, Illinois
So you’re in Chicago and your car
is missing. Was it towed? Stolen?
Chicago’s TowText app removes some of
the guesswork. Sign up and the city will
text you within 15 minutes if they had to
move your vehicle.
5. King County Elections
King County, Washington
People like to access information on
their mobile devices. Ballot results are
no exception. When residents asked for
mobile-friendly voting statistics on local
elections and measures, King County
Elections provided.
8. Construction Projects
Edmonton
Some say Edmonton, BC has two
seasons: winter and road construction.
The City of Edmonton created this iOS
app to provide local drivers with up-
to-date reports and to help them avoid
active construction zones.
2. Look at Cook
Cook County, Illinois
Like most Americans, residents of Cook
County, IL want to know where their tax
dollars are going. Look at Cook provides
detailed, understandable data on county
spending, which promotes transparency
and peace of mind for taxpayers.
6. VeloRacks
Seattle, Washington
Cycling has many advantages over
driving, but they have a common
dilemma: where to park. Need to find a
bike rack? If you’re in Seattle, VeloRacks
offers detailed information about nearby
bike racks and businesses.
9. World Bank Finances
Washington, DC
This mobile app provides snapshots
of World Bank Finances’ activities.
Navigate maps and list views to learn
about a country’s donor and beneficiary
portfolios, including projects, financial
instruments, and contracts and
procurement.
3. Help Me, I’m Sick
New York City, New York
Sick in New York City? Need to get to
a hospital or medical center? Help Me,
I’m Sick is an iOS app that finds medical
services near you. Call the facility or see
a map to its location with the press of a
button.
7. Adopt a Siren
State of Hawaii
It takes time to ensure that every
emergency siren in Honolulu works
properly. Adopt a Siren allows people
to look up scheduled siren tests and, if
they’re within hearing range, volunteer
to report whether the siren worked.
10. Recollect
Vancouver, BC
One person’s trash is another’s
ingenious niche service. Recollect serves
cities everywhere, allowing residents to
find their waste collection schedule, set
collection day reminders, and receive
updates about local waste issues.
4. Ballot Drop Box
State of Oregon
Sometimes, finding a convenient ballot
box is almost as challenging as deciding
how to vote. That’s why Oregon created
its Ballot Drop Box locator. Type in an
address or zoom in to find local drop
boxes and their schedules.
Open Innovation • FALL 2013 4746 Open Innovation • FALL 2013
Gut Decisions Are Expensive and DangerousGut Decisions Are Expensive and Dangerous
smarter about dispatching departmental
resources, the city’s leadership was able
to reduce crime significantly.
After Martin O’Malley was elected
Mayor of Baltimore in 1999, he made
it his number one priority to launch
a statistics-oriented approach to
governance similar to CompStat. By the
summer of 2000, CitiStat, Baltimore’s
version of the CompStat program
was born and quickly became a game
changer. The shift to a data-driven
approach not only impacted crime,
but it provided a data-based decision
making platform for all city agencies.
It gave birth to services that benefited
citizens, like 311 and a 48-hour pothole
guarantee.
When Baltimore’s Mayor O’Malley
became Maryland’s Governor O’Malley
in 2006, it was clear that CitiStat would
be rolled out statewide. Governor
O’Malley was ambitious and bold
with his vision for Maryland. His goals
included an end to childhood hunger
by 2015, a 20 percent decrease in
crime statewide by 2018, and to get
Chesapeake Bay to the “Healthy Bay
Tipping Point” by 2025. He knew
from his experience with CitiStat that
data from multiple agencies would be
essential to solving these complicated
issues. He purposefully pulled together
people from different departments, and
their data, to find solutions.
Based upon my work in the juvenile
justice system, Governor O’Malley
invited me to be the director of his new
program, StateStat.
StateStat’s Staggering
Success
All told, StateStat’s success was
nothing short of staggering. In its
first three years, the state saved $20
million in overtime in our public safety
agency alone. Savings were created
by consolidating print shops and state
car fleets, and reducing duplication in
projects.
O’Malley made good on his
commitment to reduced crime. Violent
crimes in the state decreased by 25
percent between 2007 and 2012. In
fact, homicides were down 27 percent
in 2011 compared to 2006. The city of
Baltimore also saw a historic reduction
in crime.
In addition, the O’Malley administration
managed a massive $8.3 billion in
spending cuts in its first seven years
while recovering 81 percent of jobs
lost during the recession – that’s
the eighth fastest rate in the nation.
Meanwhile, O’Malley’s team helped to
expand healthcare coverage to more
than 360,000 residents, most of them
children.
In 2012, Maryland had the 15 lowest
foreclosure rate in the nation, 87
percent of high school seniors
graduated from high school, and 56
percent more students took Advanced
Placement exams in science, technology,
engineering and math-related topics
in 2012 than they had in 2006. The
answers to problems that had bedeviled
the state for years were in the data.
How was such widespread success
possible? I believe that it was our
commitment to the philosophy of
governing by data. The StateStat
program oversaw 80 percent of all
budgets and personnel in the state.
Agencies checked in with StateStat
monthly, if not weekly. And, StateStat
was reviewed quarterly against Governor
O’Malley’s 15 stated goals.
Government Should Be an
Innovation Leader
By adopting cutting-edge technologies,
such as cloud data storage and
application programming interfaces
(APIs), to share their valuable data,
some government agencies are not only
catching up with the private sector in
terms of innovation, but accelerating
beyond it. Data has long been
recognized as a government asset, but
now it can finally be shared and utilized
both inside government, and among
citizens, entrepreneurs, and researchers,
to find solutions to persistent civic
problems.
The evidence is clear: governments must
play a leading role in the data revolution.
Gut Decisions Are
Expensive and Dangerous
Why all governments must embrace data-driven decision making
By Beth Blauer
Despite the potential to use readily available information
to increase citizen engagement, save money, and boost
program performance, many public entities still base
decisions largely on instinct. Beyond contributing to
inefficient processes and shortsighted policies, “gut”
decision making is costly—even dangerous.
In 2013 and beyond, the central question that every
government leader needs to ask is: “How much longer can
I afford to not adopt a data-driven approach to decision
making?”
The Results-Driven
Revolution is Gaining
Momentum
A new era of data-powered government
is taking shape. This nascent movement
provides only a hint of what is possible
in the future. It’s not a matter of if
data-driven government can create the
best solutions to society’s problems; it’s
a matter of how soon governments will
embrace the idea and reap the benefits.
The Evolution of Public
Performance Measurement
in Maryland
StateStat, Maryland’s acclaimed
government performance management
initiative, actually has its roots in the
CompStat program implemented
in New York City in the mid-1990s.
The CompStat team in NYC had
cross-referenced crime maps with
police department resource maps
and uncovered a glaring disparity–
crime-fighting resources were evenly
distributed, but crime wasn’t. By being
Beth Blauer is the nation’s leading
expert in implementing “stat”
programs in government and is
Director of GovStat at Socrata.
The evidence is clear: governments must
play a leading role in the data revolution.
info@socrata.com
(206) 340-8008
83 S. King St., Ste. 107
Seattle, WA 98104
twitter.com/socrata
facebook.com/socrata

Más contenido relacionado

Último

My Hashitalk Indonesia April 2024 Presentation
My Hashitalk Indonesia April 2024 PresentationMy Hashitalk Indonesia April 2024 Presentation
My Hashitalk Indonesia April 2024 PresentationRidwan Fadjar
 
Key Features Of Token Development (1).pptx
Key  Features Of Token  Development (1).pptxKey  Features Of Token  Development (1).pptx
Key Features Of Token Development (1).pptxLBM Solutions
 
Breaking the Kubernetes Kill Chain: Host Path Mount
Breaking the Kubernetes Kill Chain: Host Path MountBreaking the Kubernetes Kill Chain: Host Path Mount
Breaking the Kubernetes Kill Chain: Host Path MountPuma Security, LLC
 
Benefits Of Flutter Compared To Other Frameworks
Benefits Of Flutter Compared To Other FrameworksBenefits Of Flutter Compared To Other Frameworks
Benefits Of Flutter Compared To Other FrameworksSoftradix Technologies
 
08448380779 Call Girls In Civil Lines Women Seeking Men
08448380779 Call Girls In Civil Lines Women Seeking Men08448380779 Call Girls In Civil Lines Women Seeking Men
08448380779 Call Girls In Civil Lines Women Seeking MenDelhi Call girls
 
[2024]Digital Global Overview Report 2024 Meltwater.pdf
[2024]Digital Global Overview Report 2024 Meltwater.pdf[2024]Digital Global Overview Report 2024 Meltwater.pdf
[2024]Digital Global Overview Report 2024 Meltwater.pdfhans926745
 
Integration and Automation in Practice: CI/CD in Mule Integration and Automat...
Integration and Automation in Practice: CI/CD in Mule Integration and Automat...Integration and Automation in Practice: CI/CD in Mule Integration and Automat...
Integration and Automation in Practice: CI/CD in Mule Integration and Automat...Patryk Bandurski
 
Factors to Consider When Choosing Accounts Payable Services Providers.pptx
Factors to Consider When Choosing Accounts Payable Services Providers.pptxFactors to Consider When Choosing Accounts Payable Services Providers.pptx
Factors to Consider When Choosing Accounts Payable Services Providers.pptxKatpro Technologies
 
IAC 2024 - IA Fast Track to Search Focused AI Solutions
IAC 2024 - IA Fast Track to Search Focused AI SolutionsIAC 2024 - IA Fast Track to Search Focused AI Solutions
IAC 2024 - IA Fast Track to Search Focused AI SolutionsEnterprise Knowledge
 
08448380779 Call Girls In Greater Kailash - I Women Seeking Men
08448380779 Call Girls In Greater Kailash - I Women Seeking Men08448380779 Call Girls In Greater Kailash - I Women Seeking Men
08448380779 Call Girls In Greater Kailash - I Women Seeking MenDelhi Call girls
 
WhatsApp 9892124323 ✓Call Girls In Kalyan ( Mumbai ) secure service
WhatsApp 9892124323 ✓Call Girls In Kalyan ( Mumbai ) secure serviceWhatsApp 9892124323 ✓Call Girls In Kalyan ( Mumbai ) secure service
WhatsApp 9892124323 ✓Call Girls In Kalyan ( Mumbai ) secure servicePooja Nehwal
 
SIEMENS: RAPUNZEL – A Tale About Knowledge Graph
SIEMENS: RAPUNZEL – A Tale About Knowledge GraphSIEMENS: RAPUNZEL – A Tale About Knowledge Graph
SIEMENS: RAPUNZEL – A Tale About Knowledge GraphNeo4j
 
Scaling API-first – The story of a global engineering organization
Scaling API-first – The story of a global engineering organizationScaling API-first – The story of a global engineering organization
Scaling API-first – The story of a global engineering organizationRadu Cotescu
 
How to convert PDF to text with Nanonets
How to convert PDF to text with NanonetsHow to convert PDF to text with Nanonets
How to convert PDF to text with Nanonetsnaman860154
 
The 7 Things I Know About Cyber Security After 25 Years | April 2024
The 7 Things I Know About Cyber Security After 25 Years | April 2024The 7 Things I Know About Cyber Security After 25 Years | April 2024
The 7 Things I Know About Cyber Security After 25 Years | April 2024Rafal Los
 
A Domino Admins Adventures (Engage 2024)
A Domino Admins Adventures (Engage 2024)A Domino Admins Adventures (Engage 2024)
A Domino Admins Adventures (Engage 2024)Gabriella Davis
 
Beyond Boundaries: Leveraging No-Code Solutions for Industry Innovation
Beyond Boundaries: Leveraging No-Code Solutions for Industry InnovationBeyond Boundaries: Leveraging No-Code Solutions for Industry Innovation
Beyond Boundaries: Leveraging No-Code Solutions for Industry InnovationSafe Software
 
Swan(sea) Song – personal research during my six years at Swansea ... and bey...
Swan(sea) Song – personal research during my six years at Swansea ... and bey...Swan(sea) Song – personal research during my six years at Swansea ... and bey...
Swan(sea) Song – personal research during my six years at Swansea ... and bey...Alan Dix
 
Maximizing Board Effectiveness 2024 Webinar.pptx
Maximizing Board Effectiveness 2024 Webinar.pptxMaximizing Board Effectiveness 2024 Webinar.pptx
Maximizing Board Effectiveness 2024 Webinar.pptxOnBoard
 
Neo4j - How KGs are shaping the future of Generative AI at AWS Summit London ...
Neo4j - How KGs are shaping the future of Generative AI at AWS Summit London ...Neo4j - How KGs are shaping the future of Generative AI at AWS Summit London ...
Neo4j - How KGs are shaping the future of Generative AI at AWS Summit London ...Neo4j
 

Último (20)

My Hashitalk Indonesia April 2024 Presentation
My Hashitalk Indonesia April 2024 PresentationMy Hashitalk Indonesia April 2024 Presentation
My Hashitalk Indonesia April 2024 Presentation
 
Key Features Of Token Development (1).pptx
Key  Features Of Token  Development (1).pptxKey  Features Of Token  Development (1).pptx
Key Features Of Token Development (1).pptx
 
Breaking the Kubernetes Kill Chain: Host Path Mount
Breaking the Kubernetes Kill Chain: Host Path MountBreaking the Kubernetes Kill Chain: Host Path Mount
Breaking the Kubernetes Kill Chain: Host Path Mount
 
Benefits Of Flutter Compared To Other Frameworks
Benefits Of Flutter Compared To Other FrameworksBenefits Of Flutter Compared To Other Frameworks
Benefits Of Flutter Compared To Other Frameworks
 
08448380779 Call Girls In Civil Lines Women Seeking Men
08448380779 Call Girls In Civil Lines Women Seeking Men08448380779 Call Girls In Civil Lines Women Seeking Men
08448380779 Call Girls In Civil Lines Women Seeking Men
 
[2024]Digital Global Overview Report 2024 Meltwater.pdf
[2024]Digital Global Overview Report 2024 Meltwater.pdf[2024]Digital Global Overview Report 2024 Meltwater.pdf
[2024]Digital Global Overview Report 2024 Meltwater.pdf
 
Integration and Automation in Practice: CI/CD in Mule Integration and Automat...
Integration and Automation in Practice: CI/CD in Mule Integration and Automat...Integration and Automation in Practice: CI/CD in Mule Integration and Automat...
Integration and Automation in Practice: CI/CD in Mule Integration and Automat...
 
Factors to Consider When Choosing Accounts Payable Services Providers.pptx
Factors to Consider When Choosing Accounts Payable Services Providers.pptxFactors to Consider When Choosing Accounts Payable Services Providers.pptx
Factors to Consider When Choosing Accounts Payable Services Providers.pptx
 
IAC 2024 - IA Fast Track to Search Focused AI Solutions
IAC 2024 - IA Fast Track to Search Focused AI SolutionsIAC 2024 - IA Fast Track to Search Focused AI Solutions
IAC 2024 - IA Fast Track to Search Focused AI Solutions
 
08448380779 Call Girls In Greater Kailash - I Women Seeking Men
08448380779 Call Girls In Greater Kailash - I Women Seeking Men08448380779 Call Girls In Greater Kailash - I Women Seeking Men
08448380779 Call Girls In Greater Kailash - I Women Seeking Men
 
WhatsApp 9892124323 ✓Call Girls In Kalyan ( Mumbai ) secure service
WhatsApp 9892124323 ✓Call Girls In Kalyan ( Mumbai ) secure serviceWhatsApp 9892124323 ✓Call Girls In Kalyan ( Mumbai ) secure service
WhatsApp 9892124323 ✓Call Girls In Kalyan ( Mumbai ) secure service
 
SIEMENS: RAPUNZEL – A Tale About Knowledge Graph
SIEMENS: RAPUNZEL – A Tale About Knowledge GraphSIEMENS: RAPUNZEL – A Tale About Knowledge Graph
SIEMENS: RAPUNZEL – A Tale About Knowledge Graph
 
Scaling API-first – The story of a global engineering organization
Scaling API-first – The story of a global engineering organizationScaling API-first – The story of a global engineering organization
Scaling API-first – The story of a global engineering organization
 
How to convert PDF to text with Nanonets
How to convert PDF to text with NanonetsHow to convert PDF to text with Nanonets
How to convert PDF to text with Nanonets
 
The 7 Things I Know About Cyber Security After 25 Years | April 2024
The 7 Things I Know About Cyber Security After 25 Years | April 2024The 7 Things I Know About Cyber Security After 25 Years | April 2024
The 7 Things I Know About Cyber Security After 25 Years | April 2024
 
A Domino Admins Adventures (Engage 2024)
A Domino Admins Adventures (Engage 2024)A Domino Admins Adventures (Engage 2024)
A Domino Admins Adventures (Engage 2024)
 
Beyond Boundaries: Leveraging No-Code Solutions for Industry Innovation
Beyond Boundaries: Leveraging No-Code Solutions for Industry InnovationBeyond Boundaries: Leveraging No-Code Solutions for Industry Innovation
Beyond Boundaries: Leveraging No-Code Solutions for Industry Innovation
 
Swan(sea) Song – personal research during my six years at Swansea ... and bey...
Swan(sea) Song – personal research during my six years at Swansea ... and bey...Swan(sea) Song – personal research during my six years at Swansea ... and bey...
Swan(sea) Song – personal research during my six years at Swansea ... and bey...
 
Maximizing Board Effectiveness 2024 Webinar.pptx
Maximizing Board Effectiveness 2024 Webinar.pptxMaximizing Board Effectiveness 2024 Webinar.pptx
Maximizing Board Effectiveness 2024 Webinar.pptx
 
Neo4j - How KGs are shaping the future of Generative AI at AWS Summit London ...
Neo4j - How KGs are shaping the future of Generative AI at AWS Summit London ...Neo4j - How KGs are shaping the future of Generative AI at AWS Summit London ...
Neo4j - How KGs are shaping the future of Generative AI at AWS Summit London ...
 

Destacado

Product Design Trends in 2024 | Teenage Engineerings
Product Design Trends in 2024 | Teenage EngineeringsProduct Design Trends in 2024 | Teenage Engineerings
Product Design Trends in 2024 | Teenage EngineeringsPixeldarts
 
How Race, Age and Gender Shape Attitudes Towards Mental Health
How Race, Age and Gender Shape Attitudes Towards Mental HealthHow Race, Age and Gender Shape Attitudes Towards Mental Health
How Race, Age and Gender Shape Attitudes Towards Mental HealthThinkNow
 
AI Trends in Creative Operations 2024 by Artwork Flow.pdf
AI Trends in Creative Operations 2024 by Artwork Flow.pdfAI Trends in Creative Operations 2024 by Artwork Flow.pdf
AI Trends in Creative Operations 2024 by Artwork Flow.pdfmarketingartwork
 
PEPSICO Presentation to CAGNY Conference Feb 2024
PEPSICO Presentation to CAGNY Conference Feb 2024PEPSICO Presentation to CAGNY Conference Feb 2024
PEPSICO Presentation to CAGNY Conference Feb 2024Neil Kimberley
 
Content Methodology: A Best Practices Report (Webinar)
Content Methodology: A Best Practices Report (Webinar)Content Methodology: A Best Practices Report (Webinar)
Content Methodology: A Best Practices Report (Webinar)contently
 
How to Prepare For a Successful Job Search for 2024
How to Prepare For a Successful Job Search for 2024How to Prepare For a Successful Job Search for 2024
How to Prepare For a Successful Job Search for 2024Albert Qian
 
Social Media Marketing Trends 2024 // The Global Indie Insights
Social Media Marketing Trends 2024 // The Global Indie InsightsSocial Media Marketing Trends 2024 // The Global Indie Insights
Social Media Marketing Trends 2024 // The Global Indie InsightsKurio // The Social Media Age(ncy)
 
Trends In Paid Search: Navigating The Digital Landscape In 2024
Trends In Paid Search: Navigating The Digital Landscape In 2024Trends In Paid Search: Navigating The Digital Landscape In 2024
Trends In Paid Search: Navigating The Digital Landscape In 2024Search Engine Journal
 
5 Public speaking tips from TED - Visualized summary
5 Public speaking tips from TED - Visualized summary5 Public speaking tips from TED - Visualized summary
5 Public speaking tips from TED - Visualized summarySpeakerHub
 
ChatGPT and the Future of Work - Clark Boyd
ChatGPT and the Future of Work - Clark Boyd ChatGPT and the Future of Work - Clark Boyd
ChatGPT and the Future of Work - Clark Boyd Clark Boyd
 
Getting into the tech field. what next
Getting into the tech field. what next Getting into the tech field. what next
Getting into the tech field. what next Tessa Mero
 
Google's Just Not That Into You: Understanding Core Updates & Search Intent
Google's Just Not That Into You: Understanding Core Updates & Search IntentGoogle's Just Not That Into You: Understanding Core Updates & Search Intent
Google's Just Not That Into You: Understanding Core Updates & Search IntentLily Ray
 
Time Management & Productivity - Best Practices
Time Management & Productivity -  Best PracticesTime Management & Productivity -  Best Practices
Time Management & Productivity - Best PracticesVit Horky
 
The six step guide to practical project management
The six step guide to practical project managementThe six step guide to practical project management
The six step guide to practical project managementMindGenius
 
Beginners Guide to TikTok for Search - Rachel Pearson - We are Tilt __ Bright...
Beginners Guide to TikTok for Search - Rachel Pearson - We are Tilt __ Bright...Beginners Guide to TikTok for Search - Rachel Pearson - We are Tilt __ Bright...
Beginners Guide to TikTok for Search - Rachel Pearson - We are Tilt __ Bright...RachelPearson36
 
Unlocking the Power of ChatGPT and AI in Testing - A Real-World Look, present...
Unlocking the Power of ChatGPT and AI in Testing - A Real-World Look, present...Unlocking the Power of ChatGPT and AI in Testing - A Real-World Look, present...
Unlocking the Power of ChatGPT and AI in Testing - A Real-World Look, present...Applitools
 
12 Ways to Increase Your Influence at Work
12 Ways to Increase Your Influence at Work12 Ways to Increase Your Influence at Work
12 Ways to Increase Your Influence at WorkGetSmarter
 

Destacado (20)

Product Design Trends in 2024 | Teenage Engineerings
Product Design Trends in 2024 | Teenage EngineeringsProduct Design Trends in 2024 | Teenage Engineerings
Product Design Trends in 2024 | Teenage Engineerings
 
How Race, Age and Gender Shape Attitudes Towards Mental Health
How Race, Age and Gender Shape Attitudes Towards Mental HealthHow Race, Age and Gender Shape Attitudes Towards Mental Health
How Race, Age and Gender Shape Attitudes Towards Mental Health
 
AI Trends in Creative Operations 2024 by Artwork Flow.pdf
AI Trends in Creative Operations 2024 by Artwork Flow.pdfAI Trends in Creative Operations 2024 by Artwork Flow.pdf
AI Trends in Creative Operations 2024 by Artwork Flow.pdf
 
Skeleton Culture Code
Skeleton Culture CodeSkeleton Culture Code
Skeleton Culture Code
 
PEPSICO Presentation to CAGNY Conference Feb 2024
PEPSICO Presentation to CAGNY Conference Feb 2024PEPSICO Presentation to CAGNY Conference Feb 2024
PEPSICO Presentation to CAGNY Conference Feb 2024
 
Content Methodology: A Best Practices Report (Webinar)
Content Methodology: A Best Practices Report (Webinar)Content Methodology: A Best Practices Report (Webinar)
Content Methodology: A Best Practices Report (Webinar)
 
How to Prepare For a Successful Job Search for 2024
How to Prepare For a Successful Job Search for 2024How to Prepare For a Successful Job Search for 2024
How to Prepare For a Successful Job Search for 2024
 
Social Media Marketing Trends 2024 // The Global Indie Insights
Social Media Marketing Trends 2024 // The Global Indie InsightsSocial Media Marketing Trends 2024 // The Global Indie Insights
Social Media Marketing Trends 2024 // The Global Indie Insights
 
Trends In Paid Search: Navigating The Digital Landscape In 2024
Trends In Paid Search: Navigating The Digital Landscape In 2024Trends In Paid Search: Navigating The Digital Landscape In 2024
Trends In Paid Search: Navigating The Digital Landscape In 2024
 
5 Public speaking tips from TED - Visualized summary
5 Public speaking tips from TED - Visualized summary5 Public speaking tips from TED - Visualized summary
5 Public speaking tips from TED - Visualized summary
 
ChatGPT and the Future of Work - Clark Boyd
ChatGPT and the Future of Work - Clark Boyd ChatGPT and the Future of Work - Clark Boyd
ChatGPT and the Future of Work - Clark Boyd
 
Getting into the tech field. what next
Getting into the tech field. what next Getting into the tech field. what next
Getting into the tech field. what next
 
Google's Just Not That Into You: Understanding Core Updates & Search Intent
Google's Just Not That Into You: Understanding Core Updates & Search IntentGoogle's Just Not That Into You: Understanding Core Updates & Search Intent
Google's Just Not That Into You: Understanding Core Updates & Search Intent
 
How to have difficult conversations
How to have difficult conversations How to have difficult conversations
How to have difficult conversations
 
Introduction to Data Science
Introduction to Data ScienceIntroduction to Data Science
Introduction to Data Science
 
Time Management & Productivity - Best Practices
Time Management & Productivity -  Best PracticesTime Management & Productivity -  Best Practices
Time Management & Productivity - Best Practices
 
The six step guide to practical project management
The six step guide to practical project managementThe six step guide to practical project management
The six step guide to practical project management
 
Beginners Guide to TikTok for Search - Rachel Pearson - We are Tilt __ Bright...
Beginners Guide to TikTok for Search - Rachel Pearson - We are Tilt __ Bright...Beginners Guide to TikTok for Search - Rachel Pearson - We are Tilt __ Bright...
Beginners Guide to TikTok for Search - Rachel Pearson - We are Tilt __ Bright...
 
Unlocking the Power of ChatGPT and AI in Testing - A Real-World Look, present...
Unlocking the Power of ChatGPT and AI in Testing - A Real-World Look, present...Unlocking the Power of ChatGPT and AI in Testing - A Real-World Look, present...
Unlocking the Power of ChatGPT and AI in Testing - A Real-World Look, present...
 
12 Ways to Increase Your Influence at Work
12 Ways to Increase Your Influence at Work12 Ways to Increase Your Influence at Work
12 Ways to Increase Your Influence at Work
 

Open Innovation Magazine - Fall 2013

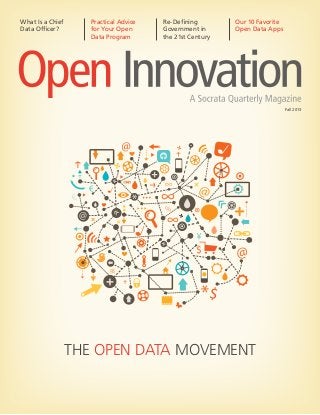
  • 1. The Open Data Movement What Is a Chief Data Officer? Practical Advice for Your Open Data Program Re-Defining Government in the 21st Century Our 10 Favorite Open Data Apps Fall 2013
  • 2. Contents The Open Data Movement 4 What Is a Chief Data Officer? 6 Practical Advice for Your Open Data Program 8 Who Should Be on Your Open Data Team? 10 3 Critical Areas Your Open Data Policy Should Cover 12 6 Steps to Open Data Success 14 3 Guidelines for Publishing Your First Open Data Sets 18 Op-Ed: Open Data Is Re-Defining Government in the 21st Century 21 NYC Digital 25 Impact: 4 Stories of Open Data success 27 A Three-Year Problem Solved in Two Hours 28 “Set It and Forget It” Saves San Francisco Staff Time 32 King County Elections Takes Open Data Mobile 36 Hard Copy Is History: Web-Based Reports Save Paper, Time & Money 40 Our 10 Favorite Open Data Apps 44 Gut Decisions Are Expensive and Dangerous 46 Dear Fellow Innovator, Welcome to the inaugural edition of the Socrata quarterly magazine, “Open Innovation.” As the open data and data-driven government movements grow, we’ll use this quarterly publication to recount the success stories, cover current policy issues, and share the many ways that access to and innovation around public data can improve people’s lives. This fall, we start with a story that is near and dear to everyone: how government data can empower consumers. When the Consumer Financial Protection Bureau revealed data on bank’s customer service records and the Centers for Medicare & Medicaid Services exposed huge cost differences at various hospitals, open data helped to “spread much-needed digital sunlight.” We’ve met many of the hard working people who fuel open data programs like these around the world. How are they successful? We discussed the role of the Chief Digital Officer (CDO) with former City of Chicago CDO Brett Goldstein. And, we interviewed other leaders in the field and recorded their best practices, including tips for who should be on your open data team and the three critical areas your open data policy should cover. Though the open government movement is still young, some organizations already have openness and innovation ingrained in their culture. Former Director of Maryland’s StateStat program, Beth Blauer, shares that state’s success making decisions with data. And, you can look to New York City as an example. The Big Apple was recently named the “The Most Economically Competitive City” in the world by The Economist Intelligence Unit. We chronicle NYC’s journey over the last two years and highlight many outstanding achievements. Finally, you can read about how open data is modernizing and redefining government in the 21st century and follow four inspiring stories from organizations that have saved time, saved money, and improved their service delivery using open data. And, you’ll get a list of some of our favorite web and mobile apps that showcase data hosted on Socrata. I hope you enjoy reading “Open Innovation” and find it inspiring. If you’d like more information on the latest open data news, you can visit us at www.socrata.com. Best wishes and I look forward to featuring your successes in future editions. Sincerely, Kevin Merritt Founder & CEO of Socrata
  • 3. Open Innovation • FALL 2013 54 Open Innovation • FALL 2013 The Open Data Movement The Open Data Movement Leveling the Playing Field For Consumers by Kevin Merritt CEO of Socrata American consumers gained considerable knowledge and power when a huge Medicare database was recently distributed to the public in easy-to-understand language. The data revealed what many patients have long suspected – hospitals charge Medicare tremendously different prices for the same procedures. According to The New York Times, for example, “in Saint Augustine, Fla., one hospital typically billed nearly $40,000 to remove a gallbladder using minimally invasive surgery, while one in Orange Park, Fla., charged $91,000 [and] … in one hospital in Dallas, the average bill for treating simple pneumonia was $14,610, while another there charged over $38,000.” This wasn’t the first time that a freshly unearthed government database bolstered the average consumer. Earlier this spring, the U.S. Consumer Financial Protection Bureau (CFPB) released detailed – but fully understandable – data that showed which banks have the most consumer complaints. The CFPB had previously issued data on credit card complaints; but now it has broadened its data distribution to include customer protests about mortgages, student loans, credit scores, and other products. As Bloomberg Businessweek noted, the CFPB database has already had an impact on improving consumer service: “Response times have sped up by 3 percent since the database came online … And banks are giving more customers a break: The number of credit-card cases Capital One Financial, Citigroup, American Express, The Open Data Movement and GE Capital Retail Bank have resolved in clients’ favor rose 12.9 percent in the past six months.” The Medicare and CFPB data disclosures are huge wins for the open data movement, which seeks to democratize a vast treasure trove of accumulated government data. That consumers can now command equal footing with big, established, and often opaque institutions like banks or hospitals, is yet another reason to support open data. New York Law School professor Beth Noveck, the former U.S. Deputy Chief Technology Officer for Open Government, agrees that this type of disclosure increases accountability and “starts from the premise that consumers, when given access to information and useful decision tools built by third parties using that information, can self-regulate and stand on a more level playing field with companies who otherwise seek to obfuscate.” These “smart” data disclosures, adds Cass Sunstein, the former U.S. administrator of the White House Office of Information and Regulatory Affairs (OIRA), also offer “a new tool that helps provide consumers with greater access to the information they need to make informed choices.” A good case study can be found at the Department of Transportation (DOT), which has been publishing data on airlines’ on-time performance as well as consumer complaints against airlines. Another proof point is the Higher Education Opportunity Act of 2008, which was designed to increase transparency and consumer information on student loans, college costs, and other financial issues. Determined to make sure that this law is as effective as possible, the U.S. Department of Education now provides government data and online tools to help students and families choose a college and decide how to finance their education. As the Medicare, CFPB, Department of Transportation and Department of Education data disclosures indicate, the executive branch of the federal government is a major player in the ongoing open data movement. But the agenda for open data is also being set at the local level. Last year, for instance, Yelp partnered with San Francisco and New York City to develop the Local Inspector Value- Entry Specification (LIVES), an open data standard that allows municipalities to publish restaurant inspection information for consumers on Yelp. Other cities, such as Austin, Texas, are also publishing restaurant inspection data online. Companies are helping to make open data a widespread reality for consumers, too.  Socrata, the company I lead, for example, offers customers like Medicare and CFPB – as well as a host of states and cities – a digital platform to publish complex data in a simple and easy way. BillGuard utilizes the CFPB’s new credit card complaint database to help consumers find deceptive, erroneous, and fraudulent charges on their credit card and debit card bills.   And iTriage has harnessed downloadable information from the Department of Health and Human Services to develop a mobile application that has helped eight million people find the best local doctors and hospitals that meet their needs. Regardless of where it comes from, though, open data benefits consumers and helps spread much-needed digital sunlight so that the average citizen is no longer forced to remain in the dark. Open data benefits consumers and helps spread much-needed digital sunlight.
  • 4. Open Innovation • FALL 2013 76 Open Innovation • FALL 2013 What Is a Chief Data Officer?What Is a Chief Data Officer? What Is a Chief Data Officer? Socrata spoke with former City of Chicago Chief Data Officer and Chief Innovation Officer Brett Goldstein about the role of the Chief Data Officer. New to the world of government, this executive post helped Mayor Rahm Emanuel make Chicago a leading digital city with the largest, most prolific civic hacking community in the world. The following is an excerpt form our interview with Mr. Goldstein in early 2013. Why the role of a Chief Data Officer and why now? Over the past decade, we’ve seen the role of technology change, at its most basic. In the early days, you had IT ops and your core role of a CIO. You then saw the evolution to see things like a Chief Security Officer. Why? Because cyber-security became critical to the enterprise, to the business, to administration. But, what you’ve seen over the past few years is just how data can transform. Our relationship with data has changed in a variety of ways. Two of which, I think, are relevant to the discussion. One, the advances in big data. We’ve seen how we’re going to move from BI to actual insights that can come from large data. But, in parallel, we’ve seen this idea of transparency through administrative data. Our relationship with the public has evolved. Back a few skills of a data scientist, you’re getting at what you really need here. And, there’s a whole talk about, ‘What is a data scientist?’ A data scientist is a combination of someone who can, speak, write, and analyze, however with the requisite CS skills to be considering problems of machine learning, data analytics, stats, all of those pieces. Day-to-day, what do you do both internally with different departments in the city, as well as your role in the broader community? I want to challenge people, I want to brainstorm with them, and I want to get some good ideas moving. With that said, my agenda is twofold. One, I think government should be accessible. If people think they have a good idea, it shouldn’t be hard to get in touch with me. I need to be out there, engage people, be responsive on Twitter. Two, the Mayor has a vision of Chicago as a tech hub. We have enormous talent in Chicago. I think we need to support it, foster it, and be out there and involved. We’re doing some great things. Additionally, within the community of CIOs and government leaders, I do my best to be in close contact with my peers. I want to hear people’s problems. There are a variety of leaders I talk to on a regular basis. I try and hear them and we try to focus solutions around that. We need to get past the silos, think in an enterprise way, and then we’ll have effective scaled solutions. It is a lot of listening, understanding, de-conflicting, and at the same time, making sure that my organization develops solutions that are enterprise solutions that come both from deductive and inductive thinking – because many of the challenges we have today can be a function of limited silos from the past. What’s the profile of a future Chief Data Officer in terms of qualities and qualifications? And what advice would you give people who aspire to it in their career? Data science is at the core. Understand data. You can’t go out and talk about data, implement policies systems or strategy, without getting it. And, these are all learnable fields. My undergrad is in government. After I got my B.A., I decided to get technology focused and it started out with me just reading a stack of books. People need to invest time in learning how things work. It’s easy to run a tool that will produce an outcome. Understanding whether what you produce is valid is another piece. When you’re talking to engineers or talking to people in community or getting out there, people respect depth of knowledge. Working in government requires tenacity. It requires some strong executive sponsorship. Every day I wake up and I say, ‘I am going to do it right.’ The right way can often end up being the hard way. So, you need to have vision. You need be able to say, ‘I am going to choose the hard way’ and be motivated to follow through. The easy path is often not what’s best for community, for your residents, for your constituency. Also understand that you don’t need to be a subject matter expert in every one of your departments but take the time to understand process, policy, the different agencies. None of us should have the hubris to think that just because we understand the technology we understand what this all means. ‘Good enough for government’ isn’t good enough. Our standards here should be the same standards we see in Silicon Valley. That should be our motivation because what higher duty do we have than our communities and our residents and doing things in a better, transparent way? years ago, your relationship was limited, with requests for information being answered in a pdf. Now the possibilities – and expectations – are very different. You’re often dealing with the near real-time possibility of response coupled with the machine readability of the data. And when you have these sort of responsibilities, ranging from quantitative analytics to transparency, in a meaningful, honest way, you need someone to lead that way. I think Mayor Emanuel showed a nationwide leadership move by making it a key piece of the administration. What are the differences between the roles of Chief Data Officer and Chief Innovation or Information Officer? I see the Chief Innovation Officer as the person who has some smart, transformative ideas. They are able to be, potentially, a change agent. Rethink processes; bring some fresh ideas to improve systems. A Chief Information Officer, since I carry that title as well, is about IT ops. IT ops, for example, in Chicago is a massive undertaking and it has daily challenges. What does that mean? It means everything from email to ERP. The ERP alone is a massive system. As we are re-architecting DoIT (Chicago’s Department of Innovation and Technology) in Chicago, we are pulling in analytics – the IT organization and use of data should not be separate. A Chief Innovation Officer has skills related to process and business development, but should be well grounded in the ability to have applied delivery. The CDO is an interesting role where, I think at its heart, if you give it the ‘Good enough for government’ isn’t good enough. Our standards here should be the same standards we see in the Silicon Valley.
  • 5. Practical Advice for Your Open Data Program How do you choose the first datasets to publish? Who are the key players that need to be on your team? We’ve collected wisdom from open data leaders around the world and distilled it into the following how-to guides for starting and maintaining your open data program.
  • 6. Open Innovation • FALL 2013 1110 Open Innovation • FALL 2013 Who Should Be on Your Open Data Team?Practical Advice for Your Open Data Program Who Should Be on Your Open Data Team? 2. Internal IT and Data Teams Chief Information/Technology/ Data Officers, IT Leaders, Developers, Webmasters What’s in it for them: This group will be excited by the opportunity to improve efficiencies and modernize information-sharing infrastructure. This will help them streamline their everyday work. It also allows them to produce tangible results in the form of apps and interactive visualizations that help improve life both at their workplace and in the greater community. Their role: This part of your team provides the technical know-how needed to create your data publishing plan. The chief information officers along with other IT leaders should take charge of selecting and implementing the open data technology platform. These leaders, as well as others in your IT department, may also help rally the support of business users and program leaders to deliver their information and services through the open data portal. They will also be key players in reaching out to the private developer community for input. 3. Communications and Information Officers Public Information Officers, Communication and Marketing Managers, Public Affairs What’s in it for them:  Communications teams will be enthusiastic about the opportunity to support and share the agency’s mission with easy-to-use information, and to use their skills to help promote community engagement. Their role: This is the branch of your team that will help you create clear, concise, and targeted messages for the many different groups who can help with (and benefit from) an open data program. Their key roles include leading external communication, acting as the press contact, and supporting community evangelism. Learn more about how this team can help engage the community.  4. Management and Team Leaders Department Heads, Agency-Level Program Managers, City and County Clerks What’s in it for them: This group will be able to benefit directly when open data sets allow their teams to do their work more efficiently. When published creatively, in the form of interactive charts or visualizations, team leaders and department heads will be able to see more clearly the effectiveness of their teams and point to data-driven results. Their role: This group provides access points for each team at your organization. By engaging them, you will be able to more effectively boost each team’s ability to deliver data and information that supports programs, your mission, and improve organizational efficiency. This group may be the smallest at the beginning of your initiative, or during a pilot. But as your initiative grows, expanding the amount of input from department heads and creating channels to listen to all levels of your organization will become increasingly important. Learn more about how and why it’s important to engage every department.  5. Developers in the Community Open Data/App Developers, Open Data and Open Government Advocates, GIS Professionals What’s in it for them: Publishing data gives developers and advocates in the community the resources they need to do their own creative work. They will take the data you provide to create tools that improve life of their community. Their role: From providing feedback about what data you should publish to taking that data and creating user- friendly applications, this group can be an invaluable asset to your open data program. They provide a broad base of expertise and professional perspectives that your organization alone, no matter how large, couldn’t provide. To help you get this group onboard, we’ve identified four essential things you can do: publish data, connect with civic developer organizations, host a hackathon, and be humble. Read more about the four essentials of developer evangelism.  An open data project is a large and exciting undertaking. One that can truly change the relationship between your agency and the public. It can also improve the efficiency of your internal operations. But to do it well, it’s essential to gather a team with the right skills to ensure success, from strategic planning to community outreach, not to mention technical expertise. If your agency is just getting started, a small and enthusiastic team may be all you need to launch a successful pilot. With the right mix, this group can also provide the energy, leadership, and strategic planning to get your entire organization onboard for an ongoing effort toward data sharing and transparency. Gathering this team is not always easy. Part of the process will likely require you to sell your program to the stakeholders who may not fully understand the value of open data yet. Fortunately, there are many clear and direct benefits for each of the open data stakeholders on your team. The team building phase is your opportunity to teach and inspire them to think about these benefits and the many exciting ways open data can improve your agency’s work. The time you spend winning them over will pay for itself, as each stakeholder can then inspire their own teams for broad support down the road. When putting together your open data team, keep the following five groups in mind – and what’s in it for them – to ensure the skills and input you need are at the table. 1. Chief Executives City or County Managers, Chief Operating Officers, Heads of Planning What’s in it for them: Launching an open data program is an opportunity for your organization’s executive to make a big difference in improving transparency, citizen services, and overall performance in your organization. Their role: The executive’s primary role in the initiative is to secure funding for the program and make sure it delivers on its goals. Once they’re onboard, they can also provide the organizational leadership and impetus for your entire agency to get involved. Read more advice about how to get your chief executive’s support.  
  • 7. Open Innovation • FALL 2013 1312 Open Innovation • FALL 2013 Practical Advice for Your Open Data Program 3 Critical Areas Your Open Data Policy Should Cover 3 Critical Areas Your Open Data Policy Should Cover that, the possible goals – and benefits – are many. They can range from better efficiency in handling public information requests, to increased innovation in the private sector in developing tools for citizens. In Chicago, one city goal was to improve preparedness for winter storms. So, their open data program provided the data sets for web and app developers to build Winter Apps, a variety of resources to help citizens get ready for and cope with winter weather. It’s important to be explicit about your purpose, so all stakeholders are clear about why they’re doing the work. Your goals should also be measurable. Do you hope to increase bus ridership or launch five new apps for citizens? Stating them clearly in your policy will help you demonstrate the success of the program later on. 2. Data sets: What are we (and what aren’t we) going to publish? You likely have a vast number of data sets that could be valuable if included in your open data program. What should you plan to publish? Even if you’re starting small with a pilot program, your policy is a good place to state the scope you’d like to encompass eventually. Because transparency is a key component of the move toward open data, we recommend publishing as much as possible. As an example, New York City’s policy  is to publish all city data that doesn’t include personal information. That means all non-personal data should be “open by default” and published on their data portal. An “open by default” approach saves time in deciding what data should or should not be made available. 3. Designated roles: Who and what is needed to make this program a success? You need a team of people to make this project successful. For example, you’ll need your chief executive to secure funding for this work, your communications officer to communicate internally and with the public, and IT people to connect with the developer community – just to name a few.  Be thorough about listing all the contributions this program will need to succeed. And then be clear in this section of your policy about the expectations and responsibilities of each stakeholder. You may also use this part of your policy to create a working group to give all the stakeholders a forum to discuss their progress. Examples of open data policies Open data policies can look very different, depending on the organization they are developed for. You may find it helpful to look at some of the policies of pioneering cities like New York and Chicago. Both have official open data policies to increase You know open data is a good idea. But are all your stakeholders on board? And if they are, does everyone know what needs to be done to make this initiative happen? line items in your policy can be many, in our experience working with various cities and organizations, we’ve found that good data policies cover three critical areas: 1) the organizational goals that this program hopes to achieve, 2) the data sets you will publish, and 3) the designated roles of each team who will help to complete the work. 1. Goals: Why are we taking on an open data initiative? What does your organization hope to achieve with an open data program? One of the primary motivators is to deliver on the promise of transparency by providing data that shows how taxpayer dollars are being spent. Beyond transparency, further goals, and create economic opportunities for citizens. Take a look and learn from those who’ve done it already. An official open data policy is one of the most effective ways to achieve organizational support and transformational change through your initiative. It makes sure everyone is on the same page about why you’re publishing data, who is responsible for what, and what data you are (or aren’t) going to publish. Taking the time to thoughtfully put this information together in a policy is well worth the effort. It will provide direction for everyone who will be involved in making this work a success. What should your open data policy include? The Sunlight Foundation has a living document full of guidelines for open data policies. While the possible New York City has taken a leadership role in the implementation and growth of open data as a service for its citizens. Its open data legislation creates a citywide, comprehensive policy – a common set of standards and guidelines for the City’s ongoing open government efforts. Transparency is a key component of the move toward open data.
  • 8. Open Innovation • FALL 2013 1514 Open Innovation • FALL 2013 Practical Advice for Your Open Data Program 6 Steps to Open Data Success 6 Steps to Open Data Success on to more complicated sets like ethics data, such as campaign donations and lobbyist salaries. It’s tempting to avoid publishing certain data sets because you fear that they are not comprehensive or well organized enough. However, based upon what we’ve seen in the open data field so far, you get points from your citizens for being forthright. Transparency may be scary to some, but it’s worth its weight in citizen trust that comes as a result. Tip: Think about building helpful visualizations and browsing filters to help people interact with and understand the data with little effort. For example, if it is budget data, a pie chart of budget by department might be helpful. You can then embed these charts on your website where they can be automatically updated. See more tips for achieving transparency.   Step 3: Listen to Developers in Your Community Developers in your community are essential for their creativity and honest feedback. By talking to them, you get a better sense of what sorts of data sets might be useful for apps. One way to do this is to host a meet-up group and just listen. How is their access to the data? Are there any other resources that would make app creation easier for them? Be humble and collaborate! Your initiative will be all the better for it. Developers are key partners in putting your data to work and improving citizens’ quality of life. Tip: Successful programs, like the NYC Big Apps competition and the Evergreen Apps Challenge have engaged developers in a community to build many successful apps for citizens. Learn from these models and put something like it in where you live. See more tips for working with developers. You can also see our guide, “How to Run a Hackathon.”   Perhaps you’ve read about the success of open data programs seen in Chicago, New York, San Francisco or other cities, in terms of lowered crime or financial transparency. You’ve heard about the increased efficiency and community engagement an open data program can bring. But, does getting started sound overwhelming? Socrata has worked with many of these open data leaders. From our time with them, we’ve come up with six key steps to build an open data program. We hope that using them as a framework for your initiative helps make the process manageable, and it helps ensure all your bases are covered. Step 1: Start Small Transportation data. Financial records. Crime data. There are lots of places to start. But don’t get bogged down at the beginning with the number of data sets you could publish. Lots of initiatives we now look to as examples of transparency started small. In fact, many began with just one data set. Kansas City, Mo., the State of Missouri, and the United Nations Development Programme all started by focusing on one high-value data set that they wanted to make available through multiple interfaces, like APIs, visualizations, and embeds. The key is to focus on quality over quantity at the beginning. With just one new and useful resource available, your community will appreciate the first step toward transparency and information they can use. Tip: Start with easy data sets first, those that are already available in spreadsheets or PDFs in the public domain. Then, expand their use to multiple interfaces, such as an interactive visualization or map. See more tips for starting small.   Step 2: Focus on Transparency Keep your eye on achieving transparency, an essential goal for most government open data initiatives. Start with the easy data sets. These are usually financial and personnel data, because they are typically standardized in format, well-organized, and available in multiple departments already. Once you have those published, you can move Data that has longitude and latitude information can be easy to find and load into your open data portal. And, Socrata customers have found that maps are some of the most common visualizations that citizens create. Transparency may be scary to some, but it’s worth its weight in citizen trust that comes as a result.
  • 9. Open Innovation • FALL 2013 1716 Open Innovation • FALL 2013 Practical Advice for Your Open Data Program 6 Steps to Open Data Success Step 4: Increase Internal Participation Getting all of your co-workers onboard can be one of the most difficult parts of launching an open data program. Everyone is strapped for time and often responsible for multiple job descriptions, so it may be difficult to get them excited about a large new initiative. Nevertheless, it is essential to win them over, because open data programs flourish with broad support. The key message is that, in the end, an open data program makes everyone’s job easier. As you begin this work, ask about information bottlenecks in your agency’s process, and be clear about addressing them early on with your initiative. Your staff can be the primary beneficiaries of easier access to information achieved through this effort – be it through less duplication of efforts to easier collaboration with better access to data. Tip: Showcase studies from other government organizations where their peers have transformed their business processes. See more tips for increasing internal support.  Step 5: Optimize for Efficiencies and Cost Savings How much would it save your organization if even 10 percent of high-touch interactions could be moved to self-service channels? In addition to increasing transparency and improving citizen experience, it also saves time and money when you move your data to an open data platform with automated updating. For example, the Oregon Marine Board significantly reduced time spent creating print resources and costs associated with publishing and distributing with just one open data project. Your staff will have more time, money, and energy to spend on projects that require more individual service. Tip: Look at the most common public information requests and see which of these may be easy candidates for data publication. Try to move these requests for information to self-service channels early on to free up time, resources, and increase both internal and external support for your open data initiative. Read more efficiency tips.  Step 6: Pool Data with Neighboring Cities, Counties, and States Once your data is published, it opens whole new possibilities for working with surrounding cities, counties, and states. Two-way exchanges of data, called data federation, with other jurisdictions is possible when data sets are published in standard formats, a key feature of an open data initiative. The benefits of data federation are numerous, including easier sharing and comparison for citizens about quality of life in their surrounding areas. For example, the City of Chicago, Cook County, and the State of Illinois have been able to pool their data into a single, citizen-friendly site, MetroChicagoData.org. Citizens are now able to get comparable information about their surroundings in one spot. Read more about the benefits of federation.  Conclusion: Don’t Get Bogged Down By the Enormity All of these steps can be taken in tandem with one another or in any order that suits you best. Think through what will work for your organization. If you get overwhelmed, remember to: 1) Ask for help and feedback. Get input from your colleagues and community members. Don’t get caught up in a top-down system. There are lots of great minds out there. Use them! 2) Build with sustainability in mind. Start small, start easy, and pick data that will be most likely to increase efficiency. This will in turn open up time to take on the more difficult tasks down the road. This Oregon Marine Board (OMB) map shows citizens where they can launch their boats. As information changes, the OMB can easily update it in the data portal, rather than producing and mailing out a new flyer of launch locations. Your staff can be the primary beneficiaries… through less duplication of efforts to easier collaboration with better access to data.
  • 10. Open Innovation • FALL 2013 1918 Open Innovation • FALL 2013 Practical Advice for Your Open Data Program 3 Guidelines for Publishing Your First Open Data Sets 3 Guidelines for Publishing Your First Open Data Sets You may also want to ask your co- workers what data will help them to do their job better or more easily. As an example, the Oregon Marine Board used open data to help achieve their strategic goal to educate citizens about boating safety, education, and access. They used their open data platform to create interactive maps that let citizens know information such as location-specific waterway regulations, where to register a boat, where to purchase various permits, view boat ramp locations, and more. This ended up saving the Marine Board time, materials costs, and labor costs – all while using data to achieve a mission-based goal. Read more about the Oregon Marine Board’s open data experience.   2. Publish data that is already (or easily) available and organized Open data may be new, but publishing data online is not. It’s more than likely your agency already has some data available, often via PDFs, Excel spreadsheets, or other offline database extracts, shapefiles, and KML files. Since they’re already organized and perhaps online already, these are great places to start for your open data project. Starting here means that you’ll begin by republishing these sets in all the required formats, so that they are easily accessible and machine-readable. (Learn more about data formats and standards.)   Another way to approach this starting point, especially if you’re currently publishing very little data online, is to start with data that is easily made available. Usually, this will be financial transparency and personnel data about your organization. That’s because it is typically well-organized and can be easily extracted from your back-end financial systems as clean spreadsheets. Once it’s loaded on your platform, you can use it to build helpful visualizations and guided browsing filters to help citizens interact with and understand the data with little effort. One good example of this is the Ethics section of Data.gov. There, citizens can search, download and visualize extensive campaign funding and other data. Before publication on the open data portal, this would have been available only in spreadsheets or by submitting a public information request. Now, the data can be easily filtered and viewed through a variety of customizable charts, tables, and sorting features, delivering on the promise of transparency and easy access for citizens. 3. Publish the information citizens and developers are asking for This is one of the best places to start if your agency wants to increase citizen satisfaction and reduce repetitive handling of frequent information requests. There are many ways to find out what information citizens are searching for or requesting most, such as: • Analyze your website data, using programs such as Google Analytics • Review your Freedom of Information Act requests • Survey your internal public information officers, clerks, and disclosure teams • Directly request feedback from constituents and developers Using feedback as your starting point is an organic process. After gathering suggestions, it will require prioritization, often based on strategic goals or how much work it will take to provide the requested datasets on your portal. What is exciting about starting here is that it kicks off your initiative with widespread engagement. It will also help you measure the interest level of your community on a variety of community concerns. These may surprise you! From recycling data to health inspection data, take a look at what other open data leaders have learned about which data sets the public finds most useful.   You’ve decided now is the time for your agency to get started with an open data program. But how do you decide which data sets to publish first?   There is no standard formula that applies to all organizations. Depending on your program goals and priorities, there can be any number of good places to start. However, in working with a variety of organizations, we have identified a few smart starting points that have worked well. We hope they will help you decide the best route to take as you kick off your open data initiative. 1. Publish data sets that help fulfill your organization’s mission and goals Drawing clear connections between your data program and your organization’s mission will help win support, as well as give your program purpose, discipline, and measurability. Start by looking over your organization’s strategic plan. Then, identify within it potential data sets that would have the biggest impact on achieving those goals. The Oregon Marine Board’s boater information maps offer more than just the location of launch points. The “flyouts” give citizens detailed information about specific facilities, construction details, phone numbers, and more. Depending on your program goals and priorities, there can be any number of good places to start.
  • 11. Open Innovation • FALL 2013 2120 Open Innovation • FALL 2013 Op-Ed: Open Data Is Re-Defining Government in the 21st CenturyOp-Ed: Open Data Is Re-Defining Government in the 21st Century Op-Ed: Open Data Is Re-Defining Government in the 21st Century by Kevin Merritt CEO of Socrata Perhaps it’s the constrained fiscal reality, punctuated by threats of government shut-downs. Or maybe it’s the ideological wars in Washington, playing out most recently in the battle over privacy and security sparked by revelations about the PRISM surveillance program. Whatever the reasons, the public sector in the 21st century gets a bad rap. As Tim O’Reilly, the founder of O’Reilly Media, has said, government is seen by legions of citizens from coast to coast as a bloated and inefficient ATM that takes in taxes and delivers mediocre services in return. Even a muscular liberal like Paul Krugman of The New York Times calls the federal bureaucracy “an insurance company with an army.” But a new movement, spurred by digital and social activism, is taking root to renovate and redefine the public sector. This movement is based on democratizing the vast treasure trove of data that governments have accumulated over the years, transparently releasing it so citizens and companies can drive meaningful change and solve problems that government, on its own, cannot solve. “Opening up data,” says Todd Park, the U.S Chief Technology Officer, “means taking data that is sitting in the vaults of the government, that the taxpayers have already paid for, and jujitsuing it into the public domain as machine-readable fuel for entrepreneurship and innovation.” This emerging digital collaboration between the public sector and scores of entrepreneurs across the nation has the potential to profoundly transform the role of government. Indeed, instead of being an ATM, as O’Reilly observes, it’s now an accelerator that helps inspire and build new businesses that bring fresh ideas, programs and initiatives to the public.
  • 12. Open Innovation • FALL 2013 2322 Open Innovation • FALL 2013 Op-Ed: Open Data Is Re-Defining Government in the 21st CenturyOp-Ed: Open Data Is Re-Defining Government in the 21st Century New York City, for instance, has passed landmark open data legislation designed to move public information from the hands of city officials to the public. The broader access to data is saving New York millions of dollars. Mayor Bloomberg’s “geek squad” of data crunchers already has solved complicated and expensive problems, like tracking down damaged trees after Hurricane Sandy or mapping which restaurants dump harmful cooking grease into city sewers. Meanwhile, New York’s annual BigApps competition has citizens creating apps with public data, like Work+, which finds the nearest coffee shop with Wi-Fi. This culture of citizen-made apps has proved unexpectedly cost-effective. For example, the Metropolitan Transit Authority hired a local firm to produce an app showing real-time bus arrival times after it determined that in-house production would cost hundreds of millions of dollars. The final price tag? Less than $1 million. Meanwhile, Chicago also is driving innovation with open data. It recently placed first in the Bloomberg Mayors Challenge, based on its proposal to build the first open source, predictive analytics platform. When completed, it will aggregate information in a single place to help leaders make smarter, faster decisions and prevent problems before they develop. Chicago is making data available around persistent problems and challenging citizens to find solutions. Ever wonder where a snowplow is during a snowstorm? There is an app for that, which means fewer calls to the city. Need to check the status of 311 service requests? The most recent data is delivered to citizens’ mobile devices, along with public parking availability, bike maps, crime information, and more. Major universities have seen data’s potential to transform cities and are dedicating resources to it, such as University of Chicago’s Computational Urban Sciences Center, MIT’s Civic Data Design Project, and New York University’s Center for Urban Science & Progress. States are getting in on the action too. Maryland has rolled out StateStat, a performance measurement and management tool based on open data. StateStat is credited with helping Maryland save millions of dollars on prison costs while raising public school test scores to the highest level in the nation four years in a row. As a software entrepreneur, I see open data as the transformation of governments from monolithic service providers to open innovation platforms, fueled by data. This shift may hold the answers to some age-old problems in government, like chronic inefficiency There are several striking examples of new companies using open government data to create programs that benefit our communities. OPower, for example, leverages government data on energy use, weather, and appliance efficiency to give customers personalized advice on how to save on their energy bills. Employing over 250 people, OPower has helped residential customers save more than 1.4 terawatt hours of electricity (enough to power all of the homes in a small city for a year) and over $165 million on their power bills. BillGuard uses the Consumer Financial Protection Bureau’s new credit card complaint database to help find deceptive, erroneous, and fraudulent charges on users’ credit and debit card bills. BillGuard’s free software alerts consumers whenever a charge on their bill has been reported by others as fraudulent and then assists them in getting their money back.  And iTriage has harnessed downloadable information from the Department of Health and Human Services to develop a mobile application that has helped eight million people find the best local doctors and hospitals that meet their needs. Founded by two emergency-room doctors in 2008, the company has approximately 90 employees, over 600 hospital partners and thousands of physicians and urgent care partners who all are working to help provide more information and better care to consumers. The ‘Micro-Data Economy’ This isn’t the first time businesses have generated growth and prosperity by accessing open government data. In the 1970s, for instance, the release of data collected by the National Oceanic and Atmospheric Administration changed scores of industries and even created a new one -- the weather industry. This was followed by the release of GPS data in the 1990s, which gave citizens location services now considered essential by many. As Beth Blauer, my colleague at Socrata, points out, we’re now living in the “Micro-Data Economy,” and the next wave of innovation and innovative businesses will flow out of thousands of micro datasets released by the public sector: crimes in our neighborhoods; real-time bus locations; restaurant inspections; and permit and license applications, to name just a few. The executive branch of the federal government is a major player in the ongoing open-data movement. One of the White House’s key digital objectives is to “unlock the power of government data to spur innovation across our nation and improve the quality of services for the American people.” To help achieve this ambitious goal, the Obama Administration is opening up new government data sets, launching new prizes and challenges to spur innovative use of data, and showcasing entrepreneurs who are developing new apps and services fueled by open data. Says Ian Kalin, a Presidential Innovation Fellow who has been immersed in the Obama Administration’s open data efforts: “This is all about the government releasing data at the wholesale level so that entrepreneurs can help provide retail services that will spur economic growth, create jobs, and improve the quality of life for millions of Americans.”   Cities and states are also setting the tone and agenda for the move to open data in the public sector today. and a citizen experience that’s out of step with the modern consumer era. “This is the right way to frame the question of Government 2.0,” explains O’Reilly, a leading open data advocate. “How does government become an open platform that allows people inside and outside government to innovate? How do you design a system in which all of the outcomes aren’t specified beforehand, but, instead, evolve through interactions between government and its citizens, as a service provider enabling its user community?” The answers to these questions are still taking shape, but one thing we do know is that the strategic use of data is clearly re-defining government’s role in the 21st century. This emerging digital collaboration between the public sector and scores of entrepreneurs across the nation has the potential to profoundly transform the role of government. There are several striking examples of new companies using open government data to create programs that benefit our communities.
  • 13. NYC Digital Mission: Make NYC the world’s leading digital city Part of the Mayor’s Office of Media and Entertainment, NYC Digital streamlines digital communication with the public and creates public-private partnerships that serve New Yorkers and support local industry. January2011NYCDigitalestablished January 2011 Rachel Haot named NYC Chief Digital Officer May 2011 NYC Digital issues first Digital Roadmap, outlining a path to realize New York City’s potential as the world’s leading digital city June 2011 Free WiFi made available in city parks September 2011 Engage NYC, first annual social media summit held July 2011 NYC hosts first Hackathon to reinvent NYC.gov February 2013 Michael Flowers named NYC Chief Analytics Officer October 2011 Launch of new NYC Open Data platform (nyc.gov/data) powered by Socrata; over 750 datasets available May 2013 City of New York is approved for its own geographic top-level domain, .nyc May 2012 Launch of Made in NY Digital Jobs Maps, highlighting the 1,000+ tech companies hiring in New York City December 2012 NYC launches the Reinvent Payphones Design Challenge June 2013 Mayor Bloomberg announces winners of 4th annual NYC BigApps. Winning applications receive cash prizes totaling $150k August 2012 Introduction of the Small Business Digital Toolkit, which helps local businesses attract customers online December 2011 Mayor Bloomberg announces partnership to build Cornell- Technion applied science and engineering campus March 2012 NYC named “The Most Economically Competitive City in the World” by the Economist Intelligence Unit NYC Local Law 11 mandates open access to city government datasets
  • 14. Impact 4 Stories of Open Data success A Three-Year Problem Solved in Two Hours 6 “Set It and Forget It” Saves San Francisco Staff Time 10 King County Elections Takes Open Data Mobile 14 Hard Copy Is History: Web-Based Reports Save Paper, Time & Money 18
  • 15. Open Innovation • FALL 2013 2928 Open Innovation • FALL 2013 Impact A Three-Year Problem Solved in Two Hours A Three-Year Problem Solved in Two Hours Impact A Three-Year Problem Solved in Two Hours State of Oregon: Marine Board For three years, Ashley Massey sought a way to create an easy-to-update, online map of resources for Oregon boaters. Her odyssey ended with her first map on Socrata. How much time did she need to make it? Two hours. How much did it cost her? Nothing. Mayday! Troubled Technology Waters “My job is to reach out and grab as many people’s attention as I can about the Marine Board’s mission of boating safety education and access,” says Massey, public information officer for the Oregon Marine Board. Massey found a great solution with open data. Her journey toward it began in 2007. 2007 - The Marine Board’s seven- year-old Microsoft Access database of boating facility information was damaged. 2008 - Massey and colleagues recompiled all of their boating access information and entered it into Google Maps. “We had to manually enter each boat ramp location and manually place the dot on the map. It was very labor intensive,” says Massey. 2009 - Disaster occurred when all of their work in Google Maps was accidently deleted. 2010 - Massey spent six months researching vendors and price agreements. “The cheapest solution we found was for $100,000, and it wasn’t capable of doing searches, so it really wasn’t an option,” says Massey. When the Oregon Marine Board team loaded their water hazard and boat ramp data onto the state’s open data portal they could easily visualize it as maps. Those maps were then embedded on Oregon.gov. A Seaworthy Solution In the summer of 2010, Oregon’s eGovernment Program Manager Wally Rogers presented the state’s new open data portal hosted on Socrata. Massey recognized the solution to her problems. “I was excited. I said, ‘I’m ready to rock’n’roll.’ We already had a dataset and a vision for the look-and-feel ready to go,” says Massey. Rogers sat down with her that day, taught her how to upload a dataset, and visualize it in a map. Once the main map view was created, Massey and colleagues were able to add icons and images. Massey had her first map completed in less than two hours.
  • 16. Open Innovation • FALL 2013 3130 Open Innovation • FALL 2013 Impact A Three-Year Problem Solved in Two Hours A Three-Year Problem Solved in Two Hours Impact Keeping Oregon Boaters Buoyant The following datasets (and more) are now available to Oregon’s boaters on Socrata’s platform: • Where to find clear gasoline • Where to purchase aquatic invasive species permits • Where to register a boat • Boat ramp locations • Pumpout and dump stations • Floating restrooms • Navigation obstructions • State-approved “clean” marinas • Location-specific waterway regulations A Boatload of Savings The regulation handbook that the Marine Board would produce every two years would cost about $150,000, “and it would only last two years,” Massey emphasizes. Time Savings: “Using Socrata has essentially shaved 50 percent off the time I used to use for print publications. I now have more time I can put into doing public relations and marketing that I didn’t have time to do before.” The team at OMB used familiar symbols on their maps to mark boat ramps, restrooms, and other resources. And, their most up-to- date water hazard information was now available on the website map – no phone calls needed. Efficiency: “Now, when we find out about a facility change, we have a form through the platform that our boating and waterway managers can submit to us. When we approve it, it automatically populates the dataset. It’s live.” Accuracy: “We have minimal data entry now. And we’re getting [the information] from the source - the boating facility managers who operate the sites.” Cost Savings: “We used to send out yearly surveys and only half, if that, would get returned. We’d do follow- up phone calls and annual site tours. Getting people out of the office and on the road to verify the condition of boat ramps was a huge expense. We’ve got over 1,000 boat ramps in Oregon.” “Using the platform is saving money and making operations so much more efficient. We’re even getting pictures from the waterway managers that we can import directly into the dataset.” Happiness: “I can’t sing the praises of our open data platform enough. It’s completely changed the way we look at doing business.” Embarking on a Bright Future Massey takes advantage of every new feature Socrata creates. “The capabilities continue to grow. Socrata keeps us updated on their latest innovations and platform development. When we see new opportunities to enhance the maps, we seize them. The maps keep getting better and better,” says Massey. What are Massey’s biggest data dreams for the future? “I hope that one day all of Oregon’s natural resource agencies can share our data and, ultimately, our resources. Together, we have the information that people want, whether they are camping, boating, fishing or hiking. How awesome would it be to get all the information recreationists seek in one location online?” Setting Sail with Her Platform Real-Time Information “I really appreciate the speed and ease of updating. [The portal] helped us move toward real-time, digital information which is much more cost-effective and up-to-date than print publications.” Citizen Involvement “Citizens can create new views of the same data, and layer datasets on top of each other to create custom maps.” Embeddable Maps “I love the ability to embed code and share it with others. I have embedded maps based on certain datasets on boatoregon.com. And, it turns out that those are some of the most popular datasets available on Oregon’s open data portal.” Highlights Replaced $200,000 custom- built database from 2000 and eliminated high maintenance fees and server security risk Reduced both time spent producing print publications and costs associated with printing, storing and distribution by 50% Avoided paying $100,000 for a new, custom-built mapping system Paid $0 to post data on Oregon’s Socrata open data portal “I can’t sing the praises of our open data platform enough.”
  • 17. Open Innovation • FALL 2013 3332 Open Innovation • FALL 2013 “Set It and Forget It” Saves San Francisco Staff Time ImpactImpact “Set It and Forget It” Saves San Francisco Staff Time “Set It and Forget It” Saves San Francisco Staff Time City and County of San Francisco San Francisco’s more than 800,000 residents come up with a lot of requests. From sidewalk repairs to campaign finance information, the City and County of San Francisco (CCSF) processes hundreds of requests a day. Sound time consuming? It is. That is why San Francisco moved to a Socrata open data portal in 2012 with the goal of digitizing the requests for data, updating the data more easily, and publicly tracking progress on requests. It’s also why San Francisco began using Safe Software’s FME platform to help staff move their daily dose of data automatically onto the Socrata platform. Open, Transparent, and Automatic In 2011, San Francisco’s leadership, including Chief Innovation Officer Jay Nath and Chief Information Officer Jon Walton, pushed for an open data portal as a “one-stop destination for all approved City data.” They had visions of greater transparency and convenience for citizens but soon discovered, as many organizations do, that standardizing the City data onto one platform improves internal efficiency. “It’s nice to be able to point to one spot and say to a colleague, “You want this information? It’s going to be on this site. You can download it, manipulate it, create views. And then, also, you can embed it into your own websites,” says Jeff Johnson, Manager of CCSF’s Enterprise GIS Program and Open Data Services at the Department of Technology. The Ethics Commission’s High Profile Job One of Johnson’s favorite examples of greater efficiency through open data is the San Francisco Ethics Commission. It turns out that reporters, lobbyists, candidates, and others involved in San Francisco politics closely watch the data the Ethics Commission reports. “We’re under a lot of pressure to be accurate,” says Steven Massey, Information Technology Officer for the CCSF Ethics Commission. Before the November 2012 elections, the Ethics Commission decided to use the open data portal to optimize for accuracy and streamline their efforts. Massey worked with Johnson to move all campaign finance and lobbyist data on to the portal and have it automatically publish to embedded charts on sfethics.org. “We replaced many of the tables throughout our website with embedded Socrata tables so that users can export the data. We’ve gotten really good feedback from the community about these charts, since they are much easier to read than our PDF financial reports,” says Massey. In addition, Johnson helped Massey make uploading data to Socrata require, truly, no time at all. Johnson suggested Safe Software’s FME product to bring the Ethics Commission data into Socrata automatically. “I was familiar with Safe Software. I use it in my GIS work, but it can be used for more file types than just geographical information,” says Johnson. Johnson asked Safe Software to develop a writer specifically for loading a broad range of data files to Socrata, eliminating the need for a unique connector to be written by San Francisco’s busy IT Team. Having this writer paid off in significant time savings. “We’ve gotten really good feedback from the community about these charts”
  • 18. Open Innovation • FALL 2013 3534 Open Innovation • FALL 2013 “Set It and Forget It” Saves San Francisco Staff Time ImpactImpact “Set It and Forget It” Saves San Francisco Staff Time Better Reporting of Ethics Information Before Socrata and FME, news sources would collect the data on candidate funding by downloading PDFs posted by the Ethics Commission and tallying up numbers by hand. The process often came with many questions for Massey and, sometimes, incorrect results were reported. In the 2012 election season, reporters from the SF Weekly, SF Appeal, SF Bay Guardian, SF Chronicle, and SF Examiner were all able to report on the data the Ethics Commission published without going through that manual process. “Now, when people call in, you direct them to the site and you’re done,” says Massey. Johnson is excited about improving both transparency and efficiency for CCSF staff, without asking for much extra effort from them. “Our Open Data policy directs City agencies to load data onto the data.sfgov.org platform, so we need to make it as easy as possible,” says Johnson. “They have a job to do - get graffiti covered, fill potholes, share financial data. That’s their business.” A Smooth Transition Massey says that the transition from PDFs to automatic uploads on the open data portal was quick. “Within a couple of days I had what I wanted up and done. Jeff finished the scheduled data updates in August and I had the summaries up right after that with all the graphs,” says Massey. By providing up-to-date campaign finance information in a single, public location, the Ethics Commission allowed journalists and candidates to track reporting on funds without submitting an information request. Plus, Massey enjoyed a surprising benefit from the new automated and visualized data that Socrata and FME made possible. Campaign finance data has received wider attention now that it is more easily available. “Prior to Socrata, campaign finance data was most valuable to reporters. It made it into the newspaper quite a bit. Now it’s in regular demand from a broader audience,” says Massey. Massey considers this a win for public data transparency. Getting Citizens What They Need, Easily Overall, time savings, improved transparency, and greater accuracy have meant the most to the CCSF team, “I now have uploads that run every night from various databases around the city. We call it “set it and forget it,” says Johnson. Johnson is even canvassing city and county agencies to instruct his colleagues about the use of FME along with Socrata. “FME is a very simple tool. That’s the beauty of it.” Johnson wants to keep San Francisco’s staff working hard on what matters, serving more than 800,000 citizens with the data and support they need everyday, as easily as possible. Highlights CCSF staff are able to respond more quickly and easily to citizen requests Ethics Commission, GIS, and other data is scheduled to update automatically every night via FME Socrata charts embed on to the Ethics Commission website and serve up-to-date data Greater accessibility to campaign finance data increases citizen engagement with it Before up-to-date campaign finance data was made available in an open format, reporters used to make written requests for information to the Ethics Commission and calculate totals per candidate by hand. Thanks to Safe Software’s FME, new data gets automatically loaded onto CCSF’s open data portal, keeping related charts up-to-date and saving the Ethics Commission team time.
  • 19. Open Innovation • FALL 2013 3736 Open Innovation • FALL 2013 King County Elections Takes Open Data Mobile ImpactImpact King County Elections Takes Open Data Mobile King County Elections Takes Open Data Mobile King County: Elections Recreational marijuana use? Same sex marriage? Romney or Obama? These contentious issues had Washington state citizens closely watching the races leading up to their Nov. 6, 2012 election night. Behind the scenes of all this excitement, in the most populous county in the state, King County Elections offered its nearly 1.2 million registered voters something they’d never had in an election before: mobile-friendly voting information and results. Providing What Citizens Want Where do citizens look for the information? Increasingly, they rely on cell phones. In fact, King County voters indicated in a 2011 survey that there were a number of elections-related actions they’d like to be able to do via their mobile devices. Those that rated the highest included checking the latest elections results and counting down the time left to return a ballot. “Our goal was to provide voters with easier and faster access to elections information so they could get what they needed most while on the go,” says King County Elections Chief Communications Officer Kim van Ekstrom. A Short Deadline King County Elections received funding from the state’s share of a “Help America Vote Act” grant to develop web-based tools for voters. The final decision to move forward on mobile came just a month and a half before the 2012 presidential election ballots were to be sent out. “Most of our work on the grant had already been completed. By the time we decided to develop pages for mobile devices, the project was running out of time and we did not have the ability to extend the grant. We utilized Socrata to piggyback the project on the open data platform,” says Dale Hartman, IT manager for King County. King County, Washington hosts tech-savvy Seattle and its surrounding communities. The King County Elections team wanted to serve voters in the county better by improving access to voting and election results information.
  • 20. Open Innovation • FALL 2013 3938 Open Innovation • FALL 2013 King County Elections Takes Open Data Mobile ImpactImpact King County Elections Takes Open Data Mobile Interactive and Mobile- Friendly Open Data Using Socrata DataSlate, Socrata’s team built web pages specifically for small, mobile devices, with interactive charts visualizing results, as well as an interactive map of ballot drop box locations. Interactive: The charts allowed users to scroll over certain sections to get more detail. Dynamic: All of the charts were updated automatically a soon as King County loaded fresh results or information to their FTP site. Practical: The mobile-friendly map of ballot drop box locations gave users “pinpoints” they could select to request directions to their nearest ballot drop box location. They even received a site photograph as a reference. In addition, Socrata built an updated “Countdown Clock” to the ballot drop off deadline that would look great on mobile devices. Throughout the election season, voters were given up-to-date maps of ballot drop box locations, as well as daily updates on election results. Citizens could see this information both online and on their mobile devices. When King County Elections polled voters about what technological improvements they wanted to see most, the public overwhelmingly requested better mobile access to election information. Just in Time for the Elections The project was completed successfully and on time. “It was a good collaboration. We delivered the services that we wanted to, they looked great, and we were able to do it on a short timeline,” says van Ekstrom. King County Elections’ efforts to make their Nov. 6 elections results more accessible paid off. More than 236,000 people visited the King County site and viewed the new charts and maps embedded on those pages. King County Elections’ site became the busiest site Socrata supported on November 6, 2012. Fortunately, because Socrata’s technology is cloud- based, there was no interruption in service to visitors. Every citizen who wanted to see election results was able to see them - on their computer or their mobile device. A Model for the Future As mobile election results become the norm, King County Elections’ initiative will serve as a model for success. Commenting on King County’s efforts to keep up with the tech-savvy citizens, IT manager Dale Hartman said, “King County Elections has an excellent track record of using technology to improve service to citizens. The development of this mobile tool is a natural next step for Elections and King County government to deliver customer service and recognize the needs of our citizens.” Highlights Citizens access data on web or mobile Updated results instantly and automatically appear in embedded maps and charts 236,000+ views of mobile- friendly maps and charts on election night Capacity to handle election- related traffic spike thanks to a cloud-based solution Scalable systems supports 90 races and measures From concept to delivery in less than two months
  • 21. Open Innovation • FALL 2013 4140 Open Innovation • FALL 2013 Hard Copy Is History: Web-Based Reports Save Paper, Time & Money ImpactImpact Hard Copy Is History: Web-Based Reports Save Paper, Time & Money Hard Copy Is History: Web-Based Reports Save Paper, Time & Money State of Washington Every year, government agencies produce reports that inform government policies and where tax dollars flow. Expensive to produce and print, these paper- based reports are often hundreds of pages long, take thousands of hours to create, and are out of date by the time they are published. Until now... Washington’s Salmon Recovery Team Thinks Forward “We have a statute that requires us to produce a report every two years about the state of salmon recovery in Washington, as well as watershed health and funding,” says Jennifer Johnson, Recover Implementation Coordinator for the Governor’s Salmon Office (GSRO) in Washington State. Johnson says the report is typically 150 pages long and costs the GSRO up to $50,000 to produce, not including staff time. “I wanted to move to something less expensive, more frequently updated, and more accessible to the public,” says Kaleen Cottingham, Director of the Recreation and Conservation Office, which manages the GSRO. Cottingham and Johnson knew what they wanted to achieve but had no model to follow. They hired cloud- based solutions provider Paladin Data Systems, SBGH-Partners, and Mt. Olympia Design Studio to build a web site for the salmon recovery report and to post images of spreadsheet data, charts, and graphics. Their initial plan was to publish a similar, static report with a bit more detailed information and a lot less paper. Socrata’s Platform Enters the Scene The team began to gather data from the departments and regional biologists that contribute to the report. When they reached out to the Department of Fish and Wildlife (DFW) they were told to go to Washington State’s open data site hosted by Socrata, data.wa.gov, to get the latest information. “We saw the Socrata tool and thought, ‘This is cool. Maybe we could do twice as much in half the time with real, live data and cover more populations of salmon,” says Paladin and SBGH- Partner’s Scott Boettcher. They had kicked off their project in April 2012, with a deadline to produce the report by December 2012. They began loading data onto the Socrata platform starting July 2012. “I did a lot of reworking of data so we could get it into cleaned-up tables that we could easily upload. Data would come to us in landscape, portrait, Word docs, spreadsheets, phone calls, and more,” says Boettcher. Determined to finish on time, the team forged forward. The GSRO team used Socrata to create 350 visualizations of the data they had collected, and then embedded those charts on the “State of Salmon” website. “We saw the Socrata tool and thought, ‘This is cool. Maybe we could do twice as much in half the time with real, live data”
  • 22. Open Innovation • FALL 2013 4342 Open Innovation • FALL 2013 Hard Copy Is History: Web-Based Reports Save Paper, Time & Money ImpactImpact Hard Copy Is History: Web-Based Reports Save Paper, Time & Money A More Accurate Report As part of producing a digital report, Johnson wanted to publish more granular data in addition to summarized information. The paper report published previously had offered “roll-ups” of information, rather than raw, source data. “The report would be more accurate at a finer scale so we decided to show all of the fish populations, About 150 are listed under the Endangered Species Act, and then we chose to include some non-listed populations, as well. We ended up with a pretty heavy load of data,” says Johnson. Improving the report required extra work with regional fish biologists and other agencies to ensure accurate reporting and getting the data loaded onto the platform on time. Cottingham supported Johnson’s wish to offer greater detail, “There is a paradigm shift. People used to have power because they controlled the data. Now we’re shifting to an expectation publically that we earn respect by being transparent and sharing our data.” A Do-It-Yourself Approach In the end, the group pulled together and published on time with about 250 web pages, 350 charts and graphics, and many improved data steward and data management relationships. “It was a change project and change projects always have turbulence. If you look at our timeline and what we achieved, it’s remarkable we pulled it off,” says Boettcher. The State of Washington hosts a number of salmon species that are listed as “endangered” or “threatened” under the federal Endangered Species Act. The State of Salmon report provides data on their recovery. “If you look at our timeline and what we achieved, it’s remarkable we pulled it off” Cottingham’s vision was now a reality. Her team had pioneered a paper-free report with visualizations, plus now the data could be fed through the state’s open data portal to update those visualizations automatically. And, this framework will serve them well for years to come. “We have a system that Jennifer can manage entirely on her own. That was a piece that was very important to Kaleen, that GSRO would be left with a Highlights Replaced a 150-page paper report with an interactive website Saved $10,000 in printing costs Eliminated the cost of mailing out 400+ copies of a 150-page report Created embeddable charts, automatically updated when new data comes in Improved engagement with field biologists for more accurate data reporting Collaborated with multiple departments to improve data quality Report Website: http://stateofsalmon.wa.gov tool it could manage and manipulate on its own,” says Boettcher. The GSRO team looks forward to adding even more detail to the report in the future and encouraging data sources to submit data in easy-to-load formats. They’re optimistic. “Bringing in even more sources of data can be a challenge, but through the collaboration you’re getting better information in the end,” says Cottingham.
  • 23. Open Innovation • FALL 2013 4544 Open Innovation • FALL 2013 Our 10 Favorite Open Data AppsOur 10 Favorite Open Data Apps Our 10 Favorite Open Data Apps Hundreds of developers around the world have used open data hosted on Socrata to create apps for everyday citizens. We feature 10 of our favorites here. 1. TowText Chicago, Illinois So you’re in Chicago and your car is missing. Was it towed? Stolen? Chicago’s TowText app removes some of the guesswork. Sign up and the city will text you within 15 minutes if they had to move your vehicle. 5. King County Elections King County, Washington People like to access information on their mobile devices. Ballot results are no exception. When residents asked for mobile-friendly voting statistics on local elections and measures, King County Elections provided. 8. Construction Projects Edmonton Some say Edmonton, BC has two seasons: winter and road construction. The City of Edmonton created this iOS app to provide local drivers with up- to-date reports and to help them avoid active construction zones. 2. Look at Cook Cook County, Illinois Like most Americans, residents of Cook County, IL want to know where their tax dollars are going. Look at Cook provides detailed, understandable data on county spending, which promotes transparency and peace of mind for taxpayers. 6. VeloRacks Seattle, Washington Cycling has many advantages over driving, but they have a common dilemma: where to park. Need to find a bike rack? If you’re in Seattle, VeloRacks offers detailed information about nearby bike racks and businesses. 9. World Bank Finances Washington, DC This mobile app provides snapshots of World Bank Finances’ activities. Navigate maps and list views to learn about a country’s donor and beneficiary portfolios, including projects, financial instruments, and contracts and procurement. 3. Help Me, I’m Sick New York City, New York Sick in New York City? Need to get to a hospital or medical center? Help Me, I’m Sick is an iOS app that finds medical services near you. Call the facility or see a map to its location with the press of a button. 7. Adopt a Siren State of Hawaii It takes time to ensure that every emergency siren in Honolulu works properly. Adopt a Siren allows people to look up scheduled siren tests and, if they’re within hearing range, volunteer to report whether the siren worked. 10. Recollect Vancouver, BC One person’s trash is another’s ingenious niche service. Recollect serves cities everywhere, allowing residents to find their waste collection schedule, set collection day reminders, and receive updates about local waste issues. 4. Ballot Drop Box State of Oregon Sometimes, finding a convenient ballot box is almost as challenging as deciding how to vote. That’s why Oregon created its Ballot Drop Box locator. Type in an address or zoom in to find local drop boxes and their schedules.
  • 24. Open Innovation • FALL 2013 4746 Open Innovation • FALL 2013 Gut Decisions Are Expensive and DangerousGut Decisions Are Expensive and Dangerous smarter about dispatching departmental resources, the city’s leadership was able to reduce crime significantly. After Martin O’Malley was elected Mayor of Baltimore in 1999, he made it his number one priority to launch a statistics-oriented approach to governance similar to CompStat. By the summer of 2000, CitiStat, Baltimore’s version of the CompStat program was born and quickly became a game changer. The shift to a data-driven approach not only impacted crime, but it provided a data-based decision making platform for all city agencies. It gave birth to services that benefited citizens, like 311 and a 48-hour pothole guarantee. When Baltimore’s Mayor O’Malley became Maryland’s Governor O’Malley in 2006, it was clear that CitiStat would be rolled out statewide. Governor O’Malley was ambitious and bold with his vision for Maryland. His goals included an end to childhood hunger by 2015, a 20 percent decrease in crime statewide by 2018, and to get Chesapeake Bay to the “Healthy Bay Tipping Point” by 2025. He knew from his experience with CitiStat that data from multiple agencies would be essential to solving these complicated issues. He purposefully pulled together people from different departments, and their data, to find solutions. Based upon my work in the juvenile justice system, Governor O’Malley invited me to be the director of his new program, StateStat. StateStat’s Staggering Success All told, StateStat’s success was nothing short of staggering. In its first three years, the state saved $20 million in overtime in our public safety agency alone. Savings were created by consolidating print shops and state car fleets, and reducing duplication in projects. O’Malley made good on his commitment to reduced crime. Violent crimes in the state decreased by 25 percent between 2007 and 2012. In fact, homicides were down 27 percent in 2011 compared to 2006. The city of Baltimore also saw a historic reduction in crime. In addition, the O’Malley administration managed a massive $8.3 billion in spending cuts in its first seven years while recovering 81 percent of jobs lost during the recession – that’s the eighth fastest rate in the nation. Meanwhile, O’Malley’s team helped to expand healthcare coverage to more than 360,000 residents, most of them children. In 2012, Maryland had the 15 lowest foreclosure rate in the nation, 87 percent of high school seniors graduated from high school, and 56 percent more students took Advanced Placement exams in science, technology, engineering and math-related topics in 2012 than they had in 2006. The answers to problems that had bedeviled the state for years were in the data. How was such widespread success possible? I believe that it was our commitment to the philosophy of governing by data. The StateStat program oversaw 80 percent of all budgets and personnel in the state. Agencies checked in with StateStat monthly, if not weekly. And, StateStat was reviewed quarterly against Governor O’Malley’s 15 stated goals. Government Should Be an Innovation Leader By adopting cutting-edge technologies, such as cloud data storage and application programming interfaces (APIs), to share their valuable data, some government agencies are not only catching up with the private sector in terms of innovation, but accelerating beyond it. Data has long been recognized as a government asset, but now it can finally be shared and utilized both inside government, and among citizens, entrepreneurs, and researchers, to find solutions to persistent civic problems. The evidence is clear: governments must play a leading role in the data revolution. Gut Decisions Are Expensive and Dangerous Why all governments must embrace data-driven decision making By Beth Blauer Despite the potential to use readily available information to increase citizen engagement, save money, and boost program performance, many public entities still base decisions largely on instinct. Beyond contributing to inefficient processes and shortsighted policies, “gut” decision making is costly—even dangerous. In 2013 and beyond, the central question that every government leader needs to ask is: “How much longer can I afford to not adopt a data-driven approach to decision making?” The Results-Driven Revolution is Gaining Momentum A new era of data-powered government is taking shape. This nascent movement provides only a hint of what is possible in the future. It’s not a matter of if data-driven government can create the best solutions to society’s problems; it’s a matter of how soon governments will embrace the idea and reap the benefits. The Evolution of Public Performance Measurement in Maryland StateStat, Maryland’s acclaimed government performance management initiative, actually has its roots in the CompStat program implemented in New York City in the mid-1990s. The CompStat team in NYC had cross-referenced crime maps with police department resource maps and uncovered a glaring disparity– crime-fighting resources were evenly distributed, but crime wasn’t. By being Beth Blauer is the nation’s leading expert in implementing “stat” programs in government and is Director of GovStat at Socrata. The evidence is clear: governments must play a leading role in the data revolution.
  • 25. info@socrata.com (206) 340-8008 83 S. King St., Ste. 107 Seattle, WA 98104 twitter.com/socrata facebook.com/socrata