

Recomendados
Recomendados
Más contenido relacionado
Similar a Utah Data Guide, Fall 2010
Similar a Utah Data Guide, Fall 2010 (20)
Más de State of Utah, Salt Lake City
Más de State of Utah, Salt Lake City (20)
Último
Último (20)
Utah Data Guide, Fall 2010
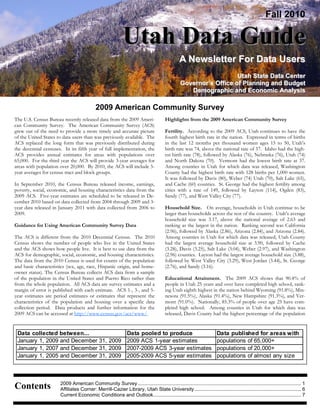
- 1. Fall 2010 Utah Data GuideUtah Data Guide A Newsletter For Data UsersA Newsletter For Data Users Utah State Data CenterUtah State Data Center Governor’s Office of Planning and BudgetGovernor’s Office of Planning and Budget Demographic and Economic AnalysisDemographic and Economic Analysis Contents 2009 American Community Survey ...................................................................................................................... 1 Affiliates Corner: Merrill-Cazier Library, Utah State University............................................................................. 6 Current Economic Conditions and Outlook........................................................................................................... 7 Highlights from the 2009 American Community Survey Fertility. According to the 2009 ACS, Utah continues to have the fourth highest birth rate in the nation. Expressed in terms of births in the last 12 months per thousand women ages 15 to 50, Utah’s birth rate was 74, above the national rate of 57. Idaho had the high- est birth rate (78), followed by Alaska (76), Nebraska (76), Utah (74) and North Dakota (70). Vermont had the lowest birth rate at 37. Among counties in Utah for which data was released, Washington County had the highest birth rate with 128 births per 1,000 women. It was followed by Davis (80), Weber (74) Utah (70), Salt Lake (65), and Cache (60) counties. St. George had the highest fertility among cities with a rate of 149, followed by Layton (114), Ogden (83), Sandy (77), and West Valley City (77). Household Size. On average, households in Utah continue to be larger than households across the rest of the country. Utah’s average household size was 3.17, above the national average of 2.63 and ranking as the largest in the nation. Ranking second was California (2.96), followed by Alaska (2.86), Arizona (2.84), and Arizona (2.84). Among counties in Utah for which data was released, Utah County had the largest average household size at 3.90, followed by Cache (3.28), Davis (3.25), Salt Lake (3.04), Weber (2.97), and Washington (2.96) counties. Layton had the largest average household size (3.88), followed by West Valley City (3.29), West Jordan (3.44), St. George (2.76), and Sandy (3.16). Educational Attainment. The 2009 ACS shows that 90.4% of people in Utah 25 years and over have completed high school, rank- ing Utah eighth highest in the nation behind Wyoming (91.8%), Min- nesota (91.5%), Alaska (91.4%), New Hampshire (91.3%), and Ver- mont (91.0%). Nationally, 85.3% of people over age 25 have com- pleted high school. Among counties in Utah for which data was released, Davis County had the highest percentage of the population The U.S. Census Bureau recently released data from the 2009 Ameri- can Community Survey. The American Community Survey (ACS) grew out of the need to provide a more timely and accurate picture of the United States to data users than was previously available. The ACS replaced the long form that was previously distributed during the decennial censuses. In its fifth year of full implementation, the ACS provides annual estimates for areas with populations over 65,000. For the third year the ACS will provide 3-year averages for areas with population over 20,000. By 2010, the ACS will include 5- year averages for census tract and block groups. In September 2010, the Census Bureau released income, earnings, poverty, social, economic, and housing characteristics data from the 2009 ACS. Five-year estimates are scheduled to be released in De- cember 2010 based on data collected from 2004 through 2009 and 3- year data released in January 2011 with data collected from 2006 to 2009. Guidance for Using American Community Survey Data The ACS is different from the 2010 Decennial Census. The 2010 Census shows the number of people who live in the United States and the ACS shows how people live. It is best to use data from the ACS for demographic, social, economic, and housing characteristics. The data from the 2010 Census is used for counts of the population and basic characteristics (sex, age, race, Hispanic origin, and home- owner status). The Census Bureau collects ACS data from a sample of the population in the United States and Puerto Rico rather than from the whole population. All ACS data are survey estimates and a margin of error is published with each estimate. ACS 1-, 3-, and 5- year estimates are period estimates or estimates that represent the characteristics of the population and housing over a specific data collection period. Data products and further information for the 2009 ACS can be accessed at http://www.census.gov/acs/www/. 2009 American Community Survey Data collected between... Data pooled to produce Data published for areas with January 1, 2009 and December 31, 2009 2009 ACS 1-year estimates populations of 65,000+ January 1, 2007 and December 31, 2009 2007-2009 ACS 3-year estimates populations of 20,000+ January 1, 2005 and December 31, 2009 2005-2009 ACS 5-year estimates populations of almost any size
- 2. 2 Fall 2010 Governor’s Office of Planning and Budget Utah Data Guide with a high school degree (95.3%), followed by Utah (93.2%), Cache (92.7%), Washington (90.4%), Salt Lake (88.5%), and Weber (88.3%) counties. Salt Lake City had the highest percentage of high school graduates with 97.3% followed by Layton (95.9%), West Jordan (91.7%), Orem (90.0%), and St. George (89.9%). Utah is only slightly above the nation for the percentage of the population over 25 that has completed a Bache- lor’s degree. In Utah, 28.5% of the population has a Bachelor’s degree, compared to 27.9% nationally, rank- ing Utah 20th among states. The District of Columbia ranked first in the nation with 48.5%, followed by Mas- sachusetts (38.2%), Colorado (35.9%), Maryland (35.7%), and Connecticut (35.6%). Among counties in Utah for which data was released, Cache County had the highest percentage of college graduates (37.4%), fol- lowed by Davis (34.0%), Utah (33.7%), Salt Lake (29.7%), Washington (21.8%), and Weber (19.8%) coun- ties. Foreign Born. In 2009, foreign born people accounted for 7.8% of the population in Utah. This was lower than the U.S., where 12.5% of the population was foreign born. California had the largest foreign born population (26.9%), followed by New York (21.4%), New Jersey (20.2%), Nevada (19.2%), and Florida (18.8%). West Virginia had the smallest foreign born population at 1.3%. Among counties in Utah for which data was re- leased, Salt Lake County had the largest foreign born population (11.4%), followed by We- ber (7.5%), Utah (6.7%), Cache (6.6%), Washington (5.4%), and Davis (4.6%) counties. West Valley had the highest percentage of foreign born population at 21.1% followed by Salt Lake City (14.8%), Ogden (14.5%), Provo (11.5%) and West Jordan (9.5%). Of the foreign born population in Utah, 59.6% were born in Latin America, 18.5% were born in Asia, and 11.1% were born in Europe with the remaining 10.9% from Africa, Oceania, and Northern America. Median Household Income. The 2009 ACS reported median household income in Utah of $55,430. This ranks Utah 15th highest in the nation. The national median household in- come was $50,221. Maryland had the highest median household income at $69,272, followed by New Jersey ($68,342), Connecticut ($67,034), Alaska ($66,953), and Hawaii ($64,098). Among counties for which data were released, Davis County had Educational Attainment for the Population 25 years and Older Source: U.S. Census Bureau, 2009 American Community Survey 2009 American Community Survey Geography Number Percent Number Percent Cache County 2,349 30.8% 5,284 69.2% Davis County 3,143 22.8% 10,668 77.2% Layton 310 10.3% 2,698 89.7% Salt Lake County 47,712 40.3% 70,725 59.7% Salt Lake City 11,104 41.1% 15,928 58.9% Sandy 1,966 33.2% 3,956 66.8% West Jordan 4,803 48.3% 5,134 51.7% West Valley City 9,518 36.0% 16,914 64.0% Utah County 14,910 41.0% 21,499 59.0% Orem 2,472 31.1% 5,465 68.9% Provo 7,428 53.7% 6,402 46.3% Washington County 2,491 33.5% 4,948 66.5% St. George 2,336 42.5% 3,164 57.5% Weber County 5,145 29.7% 12,180 70.3% Ogden 4,415 36.5% 7,667 63.5% State of Utah 83,045 38.1% 135,097 61.9% United States 12,162,582 31.6% 26,354,652 68.4% Source: 2009 American Community Survey, U.S. Census Bureau Entered 2000 or later Entered before 2000 Foreign Born Population 88.5% 93.2% 90.4% 88.3% 90.4% 85.3% 37.4% 34.0% 29.7% 33.7% 21.8% 19.8% 28.5% 27.9% 95.3% 92.7% 0% 20% 40% 60% 80% 100% Cache County Davis County Salt Lake County Utah County Washington County Weber County State of Utah United States Percent High School Graduate or Higher Percent Bachelor's Degree or Higher
- 3. 3Fall 2010 Governor’s Office of Planning and Budget Utah Data Guide Median Household and Median Family Income the highest median household income at $66,098. It was followed by Utah ($57,732), Salt Lake ($57,006), Weber ($53,058), Washington ($46,462), and Cache ($45,643) counties. Sandy had the highest median household income among cities with $72,272 followed by West Jordan ($60,857), Layton ($60,386), West Valley City ($51,510), and Orem ($50,194). Poverty. Utah’s poverty rate continues to remain below the nation and ranks 13th lowest among states. In 2009, the poverty rate in Utah was 11.5%. The national poverty rate was 14.3%. New Hampshire had the lowest poverty rate in the nation (8.5%) and Mississippi had the highest (21.9%). Among coun- ties in Utah for which data was re- leased, Davis County had the lowest poverty rate (6.6%), followed by Salt Lake (10.3%), Weber (12.5%), Utah (14.2%), Washington (14.7%), and Cache (18.6%) counties. Layton had the lowest rate of poverty with 6.0% followed by West Jordan (6.8%), Sandy (7.9%), West Valley City (11.5%), and Orem (13.9%). Utah has the fourth lowest child poverty rate in the nation at 12.2%, below the national rate of 20.0%. Utah also has a low percent of elderly in poverty, with 7.4% of people over 65 years below the pov- erty level, lower than the national rate of 9.5% and ranking Utah eighth lowest among states. Employment. A high percentage of people in Utah work compared to the rest of the country. Defined as the percent of people age 16 to 64 who are in the labor force, Utah’s labor force participation rate was 70.6%, while the national rate was 66.9%. However, Utah has the lowest percent of children with all parents in the labor force (49.6%), well below the nation (64.4%). Place of Work. The majority of workers in Utah drive alone to work and few take public transportation. Of workers 16 years and over, 76.1% drive alone, 11.7% carpool, and 2.4% use public trans- portation. The average commute in Utah was shorter than the na- tion: in Utah the mean travel time to work was 21.0 minutes, com- pared to the national average of 25.1 minutes. Workers in Cache County had the shortest commute, with a mean travel time of 16.3 minutes. It was followed by Washington (17.2 min), Utah (20.8 min), Weber (21.0 min), Salt Lake (21.6 min), and Davis (22.4 min) counties. St. George workers had the shortest commute among the cities. Orem was second with 16.8, followed by Provo (18.1), Ogden (19.0), and Salt Lake City (19.2). Median Housing Values. Recent market turmoil has caused changes in the housing market; however, as of 2009 when the ACS was conducted, the median housing value of owner-occupied hous- Selected Monthly Housing Costs 1,203 1,520 1,515 1,550 1,468 1,284 657 863 833 807 869 719 $0 $200 $400 $600 $800 $1,000 $1,200 $1,400 $1,600 $1,800 Cache County Davis County Salt Lake County Utah County Washington County Weber County Housing units with a mortgage Occupied units paying rent Source: U.S. Census Bureau, 2009 American Community Survey 2009 American Community Survey Geography Median Household Income Median Family Income Cache County $45,643 $52,181 Davis County $66,098 $73,220 Layton $60,386 $68,015 Salt Lake County $57,006 $66,166 Salt Lake City $45,754 $58,775 Sandy $72,272 $79,908 West Jordan $60,857 $67,027 West Valley City $51,510 $54,873 Utah County $57,732 $64,991 Orem $50,194 $58,904 Provo $35,937 $40,455 Washington County $46,462 $49,180 St. George $46,005 $51,177 Weber County $53,058 $59,241 Ogden $39,378 $44,216 State of Utah $55,117 $62,935 United States $50,221 $61,082 Source: 2009 American Community Survey, U.S. Census Bureau
- 4. 4 Fall 2010 Governor’s Office of Planning and Budget Utah Data Guide owner-occupied housing units with mortgage with $1,550, followed by Davis ($1,520), Salt Lake ($1,515), Washington ($1,468), Weber ($1,284), and Cache ($1,203). Median monthly housing costs for renters in Utah were $793 in 2009, lower than the national median of $842. Renting is most ex- pensive in Hawaii ($1,293 per month) and least expensive in West Virginia ($552 per month). In Utah, 45.8% of renters spend 30% or more of household income on rent and utilities, compared to 47.7% nationally. Washington County had the highest median monthly housing costs for renters with $869, followed by Davis ($863), Salt Lake ($833), Utah ($807), Weber ($719), and Cache ($657). New Construction. New home construction continued to be a significant percentage of the housing stock in Utah, where 7.6% of all housing units were built in 2005 or later, compared to 4.8% na- tionally. Other states with large percentages of homes built after 2005 were Nevada (10.7%), Arizona (8.1%), Idaho (7.9%), Texas (7.9%), and Georgia (7.6%). Among counties in Utah for which data was released, Utah County and Washington both had the highest percentage of homes built after 2005 (12.3%), followed by Davis (9.5%), Cache (8.2%), Weber (5.9%), and Salt Lake (5.5%). ing units in Utah was $224,700, above the national median of $185,200. Housing values in Utah remain lower than other western states including California ($384,200), Washington ($287,200), Ore- gon ($257,400) and Colorado ($233,900). The ACS reported that median housing values increased in six states: North Dakota, Louisi- ana, Oklahoma, Iowa, Vermont, and North Carolina. Among coun- ties in Utah for which data was released, Salt Lake County had the highest median housing value ($244,700), followed by Utah ($238,800), Davis ($234,800), Washington ($234,800), Cache ($190,300), and Weber ($174,900) counties. Sandy had the highest median housing value at $213,600 per unit, followed by Salt Lake City ($242,200), St. George ($236,900), West Jordan ($227,600), and Orem ($222,800). Housing Costs. In Utah, median monthly housing costs for owner-occupied housing units with a mortgage were $1,445 in 2009, lower than the national median of $1,505. New Jersey had the most expensive median housing costs per month ($2,401) and West Vir- ginia had the least expensive ($895). In Utah, 35.4% of home own- ers with a mortgage spent 30% or more of their household income on selected monthly owner costs, compared to 37.5% in the nation. Utah County had the highest median monthly housing costs for Percent of People in Poverty: 2009 Source: U.S. Census Bureau, 2009 American Community Survey NM 18.0 UT 11.5 AZ 16.5 CA 14.2 NV 12.4 OR 14.3 TX 17.2 OK 16.2 CO 12.9 WA 12.3 ID 14.3 MT 15.1 WY 9.8 ND 11.7 SD 14.2 MN 11.0 NE 12.3 KS 13.4 IA 11.8 MO 14.6 AR 18.8 LA 17.3 WI 12.4 IL 13.3 IN 14.4 OH 15.2 FL 14.9 TN 17.1 KY 18.6 MS 21.9 AL 17.5 GA 16.5 SC 17.1 NC 16.3 VA 10.5 WV 17.7 PA 12.5 NY 14.2 ME 12.3 AK 9.0 HI 10.4 MA 10.3 VT 11.0 NH 8.5 RI 11.5 CT 9.4 NJ 9.4 DE 10.8 MD 9.1 MI 16.2 DC 18.4 16.6% to 19.2% 11.3% to 13.9% 14.0% to 16.5% Less than 11.2% U.S. Rate: 14.3% More than 19.3% 2009 American Community Survey
- 5. 5Fall 2010 Governor’s Office of Planning and Budget Utah Data Guide Meantravel timetowork (minutes) Geography Workers16 yearsandoverNumberPercentNumberPercentNumberPercentNumberPercentNumberPercentNumberPercentNumber CacheCounty53,39538,49172.1%5,70910.7%8151.5%2,9775.6%2,6555.0%2,7485.1%16.3 DavisCounty136,671105,91577.5%15,80211.6%4,9363.6%1,7091.3%1,1430.8%7,1665.2%22.4 Layton30,43524,22879.6%3,20210.5%6372.1%3281.1%2010.7%1,8396.0%22.7 SaltLakeCounty499,823383,51176.7%55,54011.1%15,8303.2%11,6802.3%10,9492.2%22,3134.5%21.6 SaltLakeCity97,11967,89369.9%9,68710.0%5,4105.6%5,7285.9%5,0375.2%3,3643.5%19.2 Sandy45,79336,01978.7%4,0268.8%1,4793.2%6081.3%6841.5%2,9776.5%22.0 WestJordan50,90440,18278.9%6,17512.1%6631.3%3920.8%5341.0%2,9585.8%23.7 WestValleyCity57,27145,71179.8%6,76611.8%7851.4%7351.3%8221.4%2,4524.3%21.8 UtahCounty230,754169,89673.6%25,84411.2%6,0102.6%12,0205.2%4,7342.1%12,2505.3%20.8 Orem43,87034,12577.8%4,3569.9%1,2052.7%8051.8%5191.2%2,8606.5%16.8 Provo57,03534,75960.9%6,19210.9%2,5484.5%9,04115.9%2,0303.6%2,4654.3%18.1 WashingtonCounty50,83139,83778.4%5,48410.8%1480.3%2,0924.1%6331.2%2,6375.2%17.2 St.George26,94221,55380.0%2,4839.2%1330.5%1,5905.9%2310.9%9523.5%13.8 WeberCounty103,74783,92080.9%12,42312.0%1,7481.7%1,1311.1%1,4961.4%3,0292.9%21.0 Ogden36,09529,11680.7%4,61012.8%9402.6%5931.6%4471.2%3891.1%19.0 StateofUtah1,258,095957,70976.1%146,87811.7%30,2662.4%36,9852.9%25,3092.0%60,9484.8%21.0 UnitedStates138,591,804105,476,04576.1%13,916,69410.0%6,922,4245.0%3,965,6592.90%2,392,8121.7%5,918,1704.3%25.1 Source:2009AmericanCommunitySurvey,U.S.CensusBureau Car,truck,orvan-- drovealone Car,truck,orvan-- carpooled Publictransportation (excludingtaxicab)WalkedOthermeansWorkedathome CommutingtoWork
- 6. 6 Fall 2010Utah Data Guide Governor’s Office of Planning and Budget race; household income; educational attainment and school enroll- ment; household and family income by race; poverty status; house- hold units by owner and renter occupied; householder type; house- holder type by race; median home value; and consumer expenditures. The Department has projected data covering the same census geog- raphies for 2012 and 2014. These specialized data sets have served the needs not only of our academic constituents but also state agen- cies and residents of Utah generally. The Government Documents Department of Merrill-Cazier Library avidly collects not only U.S. government documents available for depository distribution but also documents of significance to Utah which, upon publication, received little or distribution. We identify, collect, and then digitize these documents, making theme widely available from our Elusive Documents Collection. http:// digital.lib.usu.edu/elusive.php The Utah Data Guide is Now Paperless The Summer 2010 edition was the last paper printing of the Utah Data Guide. The Utah Data Guide will continue to be published and posted online in PDF format each quarter. If you would like to receive email notification when a new edition is available online please send an email to dea@utah.gov. Your email address will be added to a distribution list. Affiliates Corner: Merrill-Cazier Library, Utah State University Since its founding in 1888, Utah State Uni- versity has evolved from a small, agricul- tural college to one that is nationally and internationally recog- nized for its intellec- tual and technological leadership in land, water, space, and life enhancement. As Utah's land-grant and space- grant institution, the university has more than 850 faculty who pro- vide education for more than 25,000 undergraduate and graduate students, including 10,000 in its distance education sites located throughout the state of Utah. With seven colleges, and a new Caine College of the Arts, the univer- sity offers more than 170 majors and 130 research-related classes. Utah State is known for its strength in academics. It counts 11 Goldwater Scholars and a Rhodes Scholar among its graduates in the past ten years. As a top-50 research institution, USU professors bring in millions of dollars of research funding each year. USU now has nine Carnegie Professors of the Year - more than any other school in the state. University research in animal cloning led to Popular Science magazine naming USU one of the top 10 "smartest schools" in the nation for geeks, an appellation that the University proudly wears. The Merrill-Cazier Library collections contain over 1,549,000 total volumes, including 639,000 monographic volumes (books), 306,193 government documents, over 100,000 maps, 12,533 current serial subscriptions, and access to over 170 bibliographic, text, and infor- mational databases. The Library is a regional depository of U.S. gov- ernment publications, and, thus, has extensive holdings of U.S. agency documents, maps, and periodicals. The book collection at Merrill-Cazier Library contains over 639,000 volumes, most of which are available in open stacks and arranged by the Library of Congress classification system. Some older, infre- quently used titles are housed in the Library’s automated storage system, and these may be requested from the Library Online Cata- log. The Merrill-Cazier Library became a depository for U.S. government documents in 1907, expanding its role in 1962 when it became the regional depository for the state of Utah. As such, it has the largest and most comprehensive collection of U.S. government documents in the state. It is not uncommon for residents of Ogden and Salt Lake City to make use of our collection. As regional depository, the library has pioneered in providing expert assistance in the use of census and census derived data in combina- tion with mapping software. For example, the Government Docu- ments Department makes available and provides assistance for esti- mates and projections that cover a number of census geographies, including block groups. The Department has estimates covering every state, county, census tract, zip code, and block group for each of the years, 2001-2009. Variables include: population by age and The Utah State Data Center Program In 1982 the State of Utah entered into a voluntary agreement with the U.S. Census Bureau to establish the Utah State Data Center (SDC) program. The SDC program provides training and technical assistance in accessing and using census data for research, admini- stration, planning, and decision-making by the government, the busi- ness community, university researchers, and other interested data users. The Governor's Office of Planning and Budget serves as the lead coordinating agency for 34 organizations in Utah that make up the Utah State, Business, and Industry Data Center (SDC/BIDC) infor- mation network. This extensive network of SDC affiliates consists of major universities, libraries, regional and local organizations, as well as government agencies that produce primary data on the Utah economy. Each of these affiliates use, and provide the public with economic, demographic, or fiscal data on Utah. The Affiliate’s Cor- ner page of the Utah Data Guide has been created to highlight and recognize SDC program affiliates and their great work. A complete list of the program affiliates can be found on the back page of this newsletter. For more information on the SDC program, contact SDC staff at (801) 538-1036 or email dea@utah.gov.
- 7. 7Fall 2010 Governor’s Office of Planning and Budget Utah Data Guide Actual and Estimated Indicators for Utah and the U.S.: May 2010 2007 2008 2009 2010 2011 ECONOMIC INDICATORS UNITS ACTUAL ACTUAL ESTIMATE FORECAST FORECAST 2008 2009 2010 2011 PRODUCTION AND SPENDING U.S. Real Gross Domestic Product Billion Chained $2005 13,254.1 13,312.2 12,987.4 13,436.1 13,823.3 0.4 -2.4 3.5 2.9 U.S. Real Personal Consumption Billion Chained $2005 9,313.9 9,290.9 9,235.1 9,496.1 9,772.6 -0.2 -0.6 2.8 2.9 U.S. Real Private Fixed Investment Billion Chained $2005 2,126.3 2,018.4 1,648.2 1,709.6 1,899.4 -5.1 -18.3 3.7 11.1 U.S. Real Federal Defense Spending Billion Chained $2005 611.5 659.4 695.0 712.4 691.0 7.8 5.4 2.5 -3.0 U.S. Real Exports Billion Chained $2005 1,546.2 1,629.3 1,472.4 1,644.8 1,761.5 5.4 -9.6 11.7 7.1 Utah Exports (NAICS, Census) Million Dollars 7,839.0 10,305.9 10,331.0 10,514.6 10,155.8 31.5 0.2 1.8 -3.4 Utah Coal Production Million Tons 24.3 24.3 21.9 19.8 21.9 -0.1 -9.8 -9.6 10.6 Utah Crude Oil Production Million Barrels 19.5 22.0 22.9 21.5 20.8 12.7 4.0 -6.1 -3.3 Utah Natural Gas Production Sales Billion Cubic Feet 344.5 401.9 405.7 390.0 385.0 16.7 0.9 -3.9 -1.3 Utah Copper Mined Production Million Pounds 497.0 627.8 619.8 536.6 575.4 26.3 -1.3 -13.4 7.2 Utah Molybdenum Production Million Pounds 34.2 29.6 23.1 29.8 30.7 -13.6 -21.8 28.9 3.0 SALES AND CONSTRUCTION U.S. New Auto and Truck Sales Millions 16.1 13.2 10.3 11.8 13.8 -18.0 -21.6 14.2 16.9 U.S. Housing Starts Millions 1.34 0.90 0.55 0.70 1.17 -32.9 -38.6 27.2 66.0 U.S. Private Residential Investment Billion Dollars 629.0 477.2 361.0 372.9 476.3 -24.1 -24.4 3.3 27.7 U.S. Nonresidential Structures Billion Dollars 535.3 609.5 480.0 403.3 371.8 13.9 -21.3 -16.0 -7.8 U.S. Home Price Index (FHFA) 1980Q1 = 100 381.3 370.4 355.5 326.5 324.0 -2.9 -4.0 -8.2 -0.8 U.S. Nontaxable & Taxable Retail Sales Billion Dollars 4,454.3 4,409.4 4,132.5 4,400.4 4,681.8 -1.0 -6.3 6.5 6.4 Utah New Auto and Truck Sales Thousands 115.2 90.9 66.2 74.5 84.2 -21.1 -27.1 12.5 13.0 Utah Dwelling Unit Permits Thousands 20.5 10.6 10.5 12.0 15.0 -48.4 -1.1 14.4 25.0 Utah Residential Permit Value Million Dollars 3,963.2 1,876.2 1,674.0 2,150.0 2,775.0 -52.7 -10.8 28.4 29.1 Utah Nonresidential Permit Value Million Dollars 2,051.4 1,915.5 1,054.3 900.0 800.0 -6.6 -45.0 -14.6 -11.1 Utah Additions, Alterations and Repairs Million Dollars 979.8 789.0 660.1 800.0 900.0 -19.5 -16.3 21.2 12.5 Utah Home Price Index (FHFA) 1980Q1 = 100 377.5 375.4 349.5 333.0 334.7 -0.6 -6.9 -4.7 0.5 Utah Taxable Retail Sales Million Dollars 26,504 26,489 24,930 25,539 26,695 -0.1 -5.9 2.4 4.5 DEMOGRAPHICS AND SENTIMENT U.S. July 1st Population Millions 302.1 304.9 307.8 310.9 313.9 0.9 1.0 1.0 1.0 U.S. Consumer Sentiment (U of M) Diffusion Index 85.6 63.8 66.3 75.7 79.2 -25.5 3.9 14.2 4.6 Utah July 1st Population (UPEC) Thousands 2,700 2,758 2,800 2,848 2,895 2.2 1.5 1.7 1.7 Utah Net Migration (UPEC) Thousands 44.3 16.6 1.5 8.0 8.0 PROFITS AND RESOURCE PRICES U.S. Corporate Before Tax Profits Billion Dollars 1,774.4 1,462.8 1,427.7 1,851.3 1,855.0 -17.6 -2.4 29.7 0.2 U.S. Corporate Profit [above less Fed. Res.] Billion Dollars 1,736.7 1,427.1 1,377.6 1,773.5 1,777.5 -17.8 -3.5 28.7 0.2 West Texas Intermediate Crude Oil $ Per Barrel 72.2 99.8 61.8 78.3 83.6 38.2 -38.1 26.8 6.7 U.S. Coal Producer Price Index 1982 = 100 130.5 161.6 182.0 177.5 172.9 23.8 12.6 -2.4 -2.6 Utah Coal Prices $ Per Short Ton 25.2 27.8 28.4 28.0 27.5 10.3 2.2 -1.4 -1.8 Utah Oil Prices $ Per Barrel 62.5 86.6 50.8 70.0 73.0 38.6 -41.3 37.8 4.3 Utah Natural Gas Prices $ Per MCF 3.86 6.15 3.15 4.00 4.80 59.3 -48.8 27.0 20.0 Utah Copper Prices $ Per Pound 3.23 3.16 2.34 3.25 3.40 -2.2 -25.9 38.9 4.6 Utah Molybdenum Prices $ Per Pound 30.2 30.0 11.5 16.0 14.5 -0.6 -61.6 38.8 -9.4 INFLATION AND INTEREST RATES U.S. CPI Urban Consumers (BLS) 1982-84 = 100 207.3 215.2 214.5 218.5 222.2 3.8 -0.3 1.8 1.7 U.S. GDP Chained Price Index (BEA) 2005 = 100 106.2 108.5 109.7 110.9 112.6 2.1 1.2 1.1 1.5 U.S. Federal Funds Rate (FRB) Effective Rate 5.02 1.93 0.16 0.22 1.70 U.S. 3-Month Treasury Bills (FRB) Discount Rate 4.38 1.40 0.15 0.32 2.02 U.S. 10-Year Treasury Notes (FRB) Yield (%) 4.63 3.67 3.26 3.68 4.08 30 Year Mortgage Rate (FHLMC) Percent 6.33 6.04 5.04 4.96 5.47 EMPLOYMENT AND WAGES U.S. Establishment Employment (BLS) Millions 137.6 136.8 130.9 130.5 133.0 -0.6 -4.3 -0.3 1.9 U.S. Average Annual Pay (BLS) Dollars 46,580 47,858 48,003 49,182 50,589 2.7 0.3 2.5 2.9 U.S. Total Wages & Salaries (BLS) Billion Dollars 6,408.9 6,545.9 6,284.1 6,418.6 6,728.8 2.1 -4.0 2.1 4.8 Utah Nonagricultural Employment (DWS) Thousands 1,251.3 1,252.6 1,189.0 1,181.1 1,200.4 0.1 -5.1 -0.7 1.6 Utah Average Annual Pay (DWS) Dollars 36,516 37,453 38,051 38,752 39,862 2.6 1.6 1.8 2.9 Utah Total Nonagriculture Wages (DWS) Million Dollars 45,691 46,913 45,242 45,770 47,850 2.7 -3.6 1.2 4.5 INCOME AND UNEMPLOYMENT U.S. Personal Income (BEA) Billion Dollars 11,894 12,239 12,026 12,400 12,910 2.9 -1.7 3.1 4.1 U.S. Unemployment Rate (BLS) Percent 4.6 5.8 9.3 9.6 9.1 Utah Personal Income (BEA) Million Dollars 84,709 87,411 85,975 88,468 92,564 3.2 -1.6 2.9 4.6 Utah Unemployment Rate (DWS) Percent 2.7 3.4 6.6 7.8 6.7 Sources: State of Utah Revenue Assumptions Committee, Moody's Economy.Com, and IHS Global Insight. PERECENT CHANGE
- 8. Demographic and Economic Analysis Section Governor’s Office of Planning and Budget State Capitol Complex, Suite 150 P.O. Box 142210 Salt Lake City, UT 84114 Utah State, Business & Industry Data Center Network Coordinating Agencies Bureau of Economic and Business Research......... Pam Perlich (801-581-3358) Dept. of Workforce Services ...............................Carrie Mayne (801-526-9421) Governor’s Office of Economic Development ..Spencer Eccles (801-538-8700) Office of Tourism......................................... Jim Buchanan (801-538-1375) State Affiliates Population Research Laboratory........................Michael Toney (435-797-1238) Center for Health Data.................................Barry Nangle, MD (801-538-6907) Office of Ethnic Affairs....................................... Jesse Soriano (801-538-8753) Utah State Office of Education............................... Emily Eyre (801-538-7671) Utah Foundation.................................................... Steve Kroes (801-355-1400) Harold B. Lee Library, BYU .............................Kirk Memmott (801-422-3924) Marriott Library, U of U....................................Dave Morrison (801-581-8394) Merrill Library, USU...........................................John Walters (435-797-2683) Stewart Library, WSU.........................................Lonna Rivera (801-626-6330) Gerald R. Sherratt Library, SUU ........................ Scott Lanning (435-586-7937) Salt Lake City Library........................................Anne Menzies (801-322-8135) Davis County Library System ............................... Jerry Meyer (801-451-2322) Voices for Utah Children.......................................Terry Haven (801-364-1182) Utah System of Higher Education .......................Joseph Curtin (801-321-7108) Utah Community Action Partnership................ Heather Tritten (801-433-3025) Utah College of Applied Technology.............Farah Thompson (801-456-7405) Business & Industry Affiliates Bear River AOG...................................................Brian Carver (435-752-7242) Five County AOG..............................................Gary Zabriskie (435-673-3548) Mountainland AOG............................................... Shawn Eliot (801-229-3841) Six County AOG ........................................ Emery Polelonema (435-893-0700) Southeastern AOG................................................. Debbie Hatt (435-637-5444) Uintah Basin AOG .............................................. Brett Coulam (435-722-4518) Wasatch Front Regional Council............................Scott Festin (801-363-4250) Utah Small Business Development Center ......Greg Panichello (801-957-3481) Cache County Planning & Development............. Josh Runhaar (435-716-7154) Economic Development Corp. of Utah............Brigham Mellor (801-328-8824) Moab Area Economic Development......................... Ken Davy (435-259-5121) Park City Chamber & Visitors Bureau ..... Barbara Wainwright (435-658-9619) Weber Economic Development Corp .....................Ron Kusina (801-621-8300) Center for Public Policy & Admin ...............Jennifer Robinson (801-581-6781) SLC Housing & Neighborhood Dev................ Marilynn Lewis (801-535-6409) Governor's Office of Planning and Budget 801-538-1027 John Nixon, Director Phillip Jeffery, Deputy Director Samantha Brouse, Assistant to the Director Demographic and Economic Analysis Section Juliette Tennert, DEA Manager Walter Busse, Economist Peter Donner, Senior Economist Nancy Grisel, Research Consultant Effie Johnson, Research Analyst David Stringfellow, Tax Economist The Demographic and Economic Analysis (DEA) section supports the mission of the Governor’s Office of Planning and Budget to improve decision making by providing economic and demographic data and analysis to the governor and to individuals from state agen- cies, other government entities, businesses, academia, and the public. As part of this mission, DEA functions as the lead agency in Utah for the U.S. Census Bureau’s State Data and Business and Industry Data Center (SDC/BIDC) programs. While the 34 SDC and BIDC affiliates listed in this newsletter have specific areas of expertise, they can also provide assistance to data users in accessing Census and other data sources. State Data Center Phone: 801-538-1036 Fax: 801-538-1547 Email: dea@utah.gov For a free subscription to this quarterly newsletter, and for assistance accessing other demographic and economic data, contact the State Data Center. This newsletter and other data are available via the Internet at DEA’s web site: www.governor.utah.gov/dea