SlideShare a Scribd company logo
1 of 8
Download to read offline
UK Labour Market	 8th
July 2014
The most up-to-date source of monthly UK labour market data and analysis
Report on Jobs
1998 1999 2000 2001 2002 2003 2004 2005 2006 2007 2008 2009 2010 2011 2012 2013
25
30
35
40
45
50
55
60
65
70
75
Temp/Contract	Billings
Permanent	Placements
Increasing rate of decline
Increasing rate of growth
50 = no change on previous month
Staff Appointments via Recruitment Consultancies
Record rise in starting salaries as permanent
candidate availability plummets
Commenting on the latest survey results, Bernard Brown, Partner and Head of Business
Services at KPMG, said:
“Once again employers seem ready to ‘splash the cash’ in what appears to be a desperate
attempt to lure skilled staff from competitors. Yet despite offering starting salaries at a rate
that has not been seen during the survey’s 17 year lifetime, it is clear that candidates are not
easily swayed. As consumers they may be facing rising house prices and struggling to build
financial reserves because of low interest rates, but the desire for extra disposable income
is not yet translating into a generation of employees who are only loyal to their monthly pay
cheque.
“It’s a message employers would do well to take to heart as, although many might argue
that by offering higher pay packets, they are showing market confidence, the truth is
that continued starting salary growth is unrealistic and unsustainable over the long term.
Ultimately candidates are also suggesting this by voting with their feet, because we have also
just witnessed the biggest fall in candidate availability for 17 years. Perhaps this means that
the productivity gap is being replaced with another chasm – a vacancy vacuum – and one
that is unlikely to be resolved until employers recognise that, for staff, remuneration is about
much more than take home pay.”
Markit
Henley on Thames
Oxon RG9 1HG, UK
Tel: +44 1491 461000
Fax: +44 1491 461001
email: economics@markit.com
Copies of the report are available
on annual subscription from
Markit. For subscription details
please contact:
economics@markit.com
The Report on Jobs is a monthly
publication produced by Markit and
sponsored by the Recruitment and
Employment Confederation and KPMG
LLP.
The report features original survey
data which provide the most up-to-
date monthly picture of recruitment,
employment, staff availability and
employee earnings trends available.
1	Executive summary
2	Appointments
3	Vacancies
4	Sectoral demand
5	Staff availability
6	Pay pressures
7	Special feature
Key points from the June survey:
Permanent and temporary staff availability both tumble
Demand for staff and placements both continue to rise sharply
Series record increase in average starting salaries recorded



Report on Jobs | Recruitment Industry Survey
The Report on Jobs is unique in providing the most
comprehensive guide to the UK labour market,
drawing on original survey data provided by
recruitment consultancies and employers to provide
the first indication each month of labour market
trends.
The main findings for June are:
Record fall in permanent staff
availability in June...
The latest survey of UK recruitment consultancies indicated
a considerable reduction in the availability of staff to fill
permanent roles. The rate of contraction accelerated to the
sharpest seen in the survey history, which began in October
1997. Temporary/contract staff also recorded a sharp
deterioration in availability, with June’s drop the greatest seen
since March 1998.
...helps drive starting salaries up at
series record pace...
Amid reports of a short supply of suitable candidates, and with
demand for staff increasing, permanent salaries rose during
June at a survey record rate. Salaries have now risen for
twenty-six months in succession.
Moreover, temporary/contract staff hourly pay rates rose at
the sharpest rate since November 2007.
...as demand for staff continues to
grow...
Latest vacancy data indicated faster increases in the demand
for both permanent and temporary staff during June. Growth
was led the private sector, with demand here continuing to rise
at a rate that comfortably outstripped those seen in the public
sector.
...and placements rise
As companies sought to efficiently fill vacancies, permanent
placements continued to increase during June. Although
remaining sharp by historical standards, the rate of growth was
the lowest seen since last November.
Temporary/contract staff billings in contrast increased at
the sharpest pace for five months.
1 Executive summary
1998 1999 2000 2001 2002 2003 2004 2005 2006 2007 2008 2009 2010 2011 2012 2013
25
30
35
40
45
50
55
60
65
70
Staff Appointments
Temp/Contract	Billings
Permanent	Placements
25
30
35
40
45
50
55
60
65
70
50	=	no	change	on	previous	month 50=no	change	on	previous	month
1998 1999 2000 2001 2002 2003 2004 2005 2006 2007 2008 2009 2010 2011 2012 2013
35
40
45
50
55
60
65
70
Staff Availability and Earnings Growth
Skill	shortages
Average	permanent	salaries	(LHS)
90
80
70
60
50
40
30
50	=	no	change	on	previous	month 50	=	no	change	on	previous	month	(inverted)
inverted	-	RHS)
(Availability	of	staff
1998 1999 2000 2001 2002 2003 2004 2005 2006 2007 2008 2009 2010 2011 2012 2013 2014
Temp/Contract	Vacancies
Permanent	Vacancies
50	=	no	change	on	previous	month
25
30
35
40
45
50
55
60
65
70
75 Increasing rate of growth
Increasing rate of decline
Demand for staff
All Intellectual Property Rights owned by Markit Economics Limited
Report on Jobs | Recruitment Industry Survey
Recruitment consultancies report on the number of
people placed in permanent jobs each month, and
their revenues (billings) received from placing people
in temporary or contract positions at employers.
June’s survey data showed the continuation of strong growth
in permanent placements and temporary staff billings, with the
latter recording the sharper rate of increase.
Further strong rise in permanent
placements
A sharp increase in permanent placements was again signalled
in June, with just under half of the survey panel recording
growth. There were reports amongst recruitment consultancies
that strong growth was again reflective of high demand for
staff and increased confidence amongst companies which was
leading to a buoyant labour market.
Permanent staff placements have now risen for 21 months
in a row, although the latest rate of growth was the lowest seen
since last November.
Of the four broad English regions for which data are
available, the sharpest increase in permanent placements was
seen in the Midlands, closely followed by the South. London
remained a relative laggard, although even here growth was
historically strong.
Growth of temp billings hits five-
month high
Recruitment agencies registered their strongest net increase
in temp billings for five months in June, thereby also extending
the current sequence of growth to 14 months. There were
reports of increased demand across all sectors as clients
signalled higher business requirements.
Leading the way in terms of temp billings growth was the
Midlands followed by the South. The North saw a stronger
increase in temp billings, but London recorded a slower rate of
expansion.
An index reading above 50 signals a higher number of
placements/billings than the previous month. Readings below
50 signal a decline compared with the previous month.
2 Staff appointments
1998 1999 2000 2001 2002 2003 2004 2005 2006 2007 2008 2009 2010 2011 2012 2013
25
30
35
40
45
50
55
60
65
70
75
Temp/Contract	Billings
Permanent	Placements
Increasing rate of decline
Increasing rate of growth
50 = no change on previous month
Staff Appointments via Recruitment Consultancies
2014	Jan	 49.8	 30.3	 19.9	 29.8	 64.9	 62.1
	 Feb	 49.8	 33.7	 16.5	 33.2	 66.6	 65.2
	 Mar	 49.7	 32.7	 17.6	 32.1	 66.0	 62.6
	 Apr	 50.1	 31.3	 18.6	 31.4	 65.7	 63.8
	 May	 43.4	 38.0	 18.6	 24.9	 62.4	 62.8
	 Jun	 49.0	 30.9	 20.1	 28.9	 64.4	 61.3
	 	 Higher	 Same	 Lower	 Net	 Index	 S.Adj.	
	           	 %	 %	 %	 +/-	 50 = no chg	 Index
Permanent Staff Placements
Q. Please compare the number of staff placed in permanent
positions with the number one month ago.
2014	Jan	 25.1	 45.1	 29.8	 -4.7	 47.6	 62.8
	 Feb	 42.2	 37.8	 20.0	 22.2	 61.1	 61.7
	 Mar	 40.8	 46.6	 12.6	 28.2	 64.1	 59.9
	 Apr	 37.8	 41.9	 20.3	 17.4	 58.7	 58.9
	 May	 39.2	 43.2	 17.6	 21.6	 60.8	 59.1
	 Jun	 48.1	 38.4	 13.5	 34.6	 67.3	 62.2
	 	 Higher	 Same	 Lower	 Net	 Index	 S.Adj.	
	           	 %	 %	 %	 +/-	 50 = no chg	 Index
Temporary/Contract Staff Billings
Q. Please compare your billings received from the
employment of temporary and contract staff with the
situation one month ago.
Report on Jobs | Recruitment Industry Survey
3 Vacancies
All Intellectual Property Rights owned by Markit Economics Limited
Recruitment consultants are asked to specify
whether the demand for staff from employers has
changed on the previous month, thereby providing
an indicator of the number of job vacancies. The
summary indexes shown in this page are derived
from the detailed sector data shown on page 5.
Faster increases in demand for
permanent and temporary staff
The Report on Jobs Vacancy Index remained well above
the 50.0 no-change mark in June to signal another marked
increase in the demand for staff. Posting 66.5, the index
improved on May’s five-month low and again signalled a sharp
rate of growth.
Latest data showed demand for permanent staff continued
to rise at a sharper pace than for temporary workers.
Public & private sector vacancies
June’s survey results again showed that demand for staff
continued to increase at a considerably quicker rate from the
private sector for both permanent and temporary workers.
In both the public and private sectors, demand for
temporary workers rose at rates that outstripped those seen
for permanent staff.
Other vacancy indicators
Latest official data from the Office for National Statistics (ONS)
indicated continued strong growth of job vacancies in April,
with a year-on-year rise of 22.3% recorded.
Meanwhile, internet-based recruitment spending continued
to increase at a strong annual pace. Latest data showed a
10.1% rise during Q4 2013.
The Job Vacancies Index monitors the overall demand for
staff at recruitment consultancies. An index reading above
50 signals a higher number of vacancies than the previous
month. Readings below 50 signal a decline compared with the
previous month.
1998 1999 2000 2001 2002 2003 2004 2005 2006 2007 2008 2009 2010 2011 2012 2013 2014
Temp/Contract	Vacancies
Permanent	Vacancies
50	=	no	change	on	previous	month
25
30
35
40
45
50
55
60
65
70
75
Increasing rate of growth
Increasing rate of decline
25
30
35
40
45
50
55
60
65
70
75
Job Vacancies
50	=		no	change	on	previous	month
Vacancy	Index
Increasing rate of growth
Increasing rate of decline
Job Vacancy Indicators
	 	 	 Feb’14	 Mar	 Apr	 May	 Jun	
Job Vacancy Index (recruitment industry survey)
50 = no change on previous month	 			 	
Other key vacancy data
Annual % change
Sources: 	Job centre vacancies provided by Office for National Statistics
Internet recruitment spending provided by WARC.com
Total			 67.0	 66.9	 66.8	 65.8	 66.5
Permanent Staff	 67.1	 67.0	 66.9	 65.9	 66.6
Temporary Staff	 64.8	 65.7	 64.9	 64.4	 65.7
Public: perm		 56.7	 56.0	 56.0	 57.1	 53.6
Public: temp		 56.3	 59.7	 57.8	 55.2	 57.6
Private: perm		 74.9	 72.1	 72.6	 71.4	 73.0
Private: temp		 66.8	 69.9	 67.6	 69.4	 74.0
Job centre vacancies	 22.5	 22.9	 22.3	 n/a	 n/a	
Internet recruitment	 10.1	 --	 --	 --	 --	
Public & private sector vacancies (not seasonally adjusted)
Report on Jobs | Recruitment Industry Survey
Recruitment consultancies are requested to compare
the demand for staff according to sector with the
situation one month ago.
Permanent Staff
Engineering was the best performing sector in the demand for
staff ‘league table’ during June. Construction also continued
its recent strong performance, recording a considerable rate of
growth. Hotel & Catering was the weakest performer.
4 Demand for staff by sector
50	=		no	change	on	previous	month
Demand for staff
20
30
40
50
60
70
80
90 Secretarial & Clerical
Perm
Tem p
2002 2003 2004 2005 2006 2007 2008 2009 2010 2011 2012 2013
20
30
40
50
60
70
80
90 Accounting & Financial
Tem p
Perm
200220032004200520062007200820092010201120122013
2002 2003 2004 2005 2006 2007 2008 2009 2010 2011 2012 2013
20
30
40
50
60
70
80
90 Executive & Professional
Perm
Tem p
2002 200320042005 20062007 200820092010 20112012 2013
20
30
40
50
60
70
80
90 IT & Computing
Tem p
Perm
20
30
40
50
60
70
80
90
2002 2003 2004 2005 2006 2007 2008 2009 2010 2011 2012 2013
Tem p
Blue Collar
Perm
20
30
40
50
60
70
80
90
200220032004200520062007200820092010201120122013
Nursing/Medical/Care
Tem p
Perm
2002 2003 2004 2005 2006 2007 2008 2009 2010 2011 2012 2013
20
30
40
50
60
70
80
90 Hotel & Catering
Tem p
Perm
Engineering; Construction
	 	 	This year (Last year)	
		 Rank	 Jun'14	 Rank	 Jun'13
	 	 	This year (Last year)	
	 	 Rank	 Jun'14	 Rank	 Jun'13
*Non-seasonally adjusted data. Prior to April 2013
Engineering/Construction was reported as a single category.
Data are presented in the form of diffusion indices whereby
a reading of 50 indicates no change on the previous month.
Readings above 50 signal stronger demand than a month
ago. Readings below 50 signal weaker demand than a month
ago.
Engineering*			 1	 69.7	 (2)	 (60.7)
Blue Collar			 2	 69.1	 (5)	 (56.6)
Construction*			 3	 67.0	 (3)	 (58.1)
Secretarial/Clerical		 4	 64.3	 (6)	 (56.3)
IT & Computing			 5	 63.8	 (4)	 (57.6)
Accounting/Financial		 6	 63.0	 (9)	 (53.7)
Nursing/Medical/Care		 7	 62.9	 (1)	 (65.3)
Hotel & Catering			 8	 62.7	 (7)	 (55.2)
Executive/Professional		 9	 62.0	 (8)	 (54.1)
Engineering*			 1	 74.3	 (4)	 (60.7)
Construction*			 2	 72.7	 (4)	 (60.7)
Accounting/Financial		 3	 68.0	 (6)	 (58.3)
IT & Computing			 4	 66.9	 (1)	 (61.7)
Executive/Professional		 5	 66.6	 (3)	 (61.0)
Secretarial/Clerical		 6	 64.4	 (7)	 (56.0)
Nursing/Medical/Care		 7	 63.2	 (2)	 (61.1)
Blue Collar			 8	 62.4	 (8)	 (53.9)
Hotel & Catering			 9	 60.4	 (9)	 (53.4)
46
50
54
58
62
66
70
74
78
Engineering Construction
Perm Temp
Temporary/contract staff
Engineering workers were also the most in-demand type of
temporary staff during June, followed by Blue Collar and then
Construction. Demand for temporary staff is rising at stronger
rates across all categories when compared to 12 months ago,
with the exception of Nursing/Medical/Care.
Report on Jobs | Recruitment Industry Survey
Recruitment consultants are asked to report whether
availability of permanent and temporary staff has
changed on the previous month. An overall indicator
of staff availability is also calculated.
Availability of permanent staff
In line with a rapidly tightening UK labour market, the
availability of permanent staff continued to decline in June.
Moreover, the rate of contraction accelerated for a fifth
successive month to a new series record (data have been
collected since October 1997).
Nearly half of the survey panel indicated a fall in candidate
availability during June and it was in the South of England
where the sharpest reduction was registered, followed by the
Midlands, the North and then London.
Availability of temp/contract staff
Having eased slightly during May, the latest data indicated
a sharp acceleration in the rate of contraction in temporary/
contract staff. With 38% of the survey panel recording a fall,
the net decline was the sharpest since March 1998.
In line with recent trends, temp availability fell across all
four English regions. The Midlands and London recorded the
sharpest reductions.
5 Staff availability
1998 1999 2000 2001 2002 2003 2004 2005 2006 2007 2008 2009 2010 2011 2012 2013
Temp	Availability Permanent	Availability
50	=	no	change	on	previous	month
20
30
40
50
60
70
80
90Improving availability
Deteriorating availability
20
30
40
50
60
70
80
90
Staff Availability
50	=		no	change	on	previous	month
Staff	Availability	Index
Improving availability
Deteriorating availability
2014	Jan	 27.3	 42.2	 30.5	 -3.2	 48.4	 41.1
	 Feb	 16.8	 49.4	 33.8	 -17.0	 41.5	 39.0
	 Mar	 13.8	 47.9	 38.3	 -24.5	 37.8	 38.0
	 Apr	 12.2	 50.1	 37.7	 -25.5	 37.2	 37.6
	 May	 7.8	 51.6	 40.5	 -32.7	 33.6	 34.9
	 Jun	 4.9	 45.2	 49.9	 -45.0	 27.5	 28.9
Key permanent staff skills reported in short supply:*
Accountancy/Financial: Accountants. Blue Collar:
HGV Drivers. Engineering: Qualified Engineers, Project
Managers. Executive/Professional: Client Relationship
Managers, Logistics Professionals, Field Sales. Hotels/
Catering: F&B Managers, Chefs. Nursing/Medical/Care:
Care Workers, Home Carers, Nurses. IT/Computing: CAD
Designer, eCommerce, .net, JAVA, SQL, Net Developers, IT
Developers. Secretarial/Clerical: HR. Other: Estimators,
Supervisors, Telesales Professionals, Business Developers.
Key temp skills reported in short supply:*
Accountancy/Financial: Payroll. Blue Collar: FLT Drivers,
LGV Drivers Engineering: Fabricator Welders, Plater
Welders, Qualified Engineers. Hotels/Catering: Chefs. IT/
Computing: Developers, eCommerce, JAVA, SQL. Nursing/
Medical/Care: Health Care Assistants, Home Care Workers,
Nurses. Secretarial/Clerical: Repographics Operators,
Legal Secretaries, Receptionists. Other: Tele Marketers,
Experienced Sales Personnel, Marketing, Business
Developers.
Availability of permanent staff
Q. Is the availability of candidates for permanent vacancies
better, the same or worse than one month ago?
	 	 Better	 Same	 Worse	 Net	 Index	 S.Adj.	
	           	 %	 %	 %	 +/-	 	 Index
2014	Jan	 24.6	 53.2	 22.3	 2.3	 51.1	 44.6
	 Feb	 17.6	 57.1	 25.3	 -7.7	 46.1	 43.6
	 Mar	 10.6	 60.2	 29.1	 -18.5	 40.8	 41.7
	 Apr	 10.3	 56.6	 33.2	 -22.9	 38.6	 39.8
	 May	 9.8	 57.6	 32.6	 -22.8	 38.6	 40.1
	 Jun	 10.5	 51.9	 37.6	 -27.2	 36.4	 36.6
Availability of temporary/contract staff
Q. Is the availability of candidates for temporary vacancies
better, the same or worse than one month ago?
	 	 Better	 Same	 Worse	 Net	 Index	 S.Adj.	
	           	 %	 %	 %	 +/-	 	 Index
All Intellectual Property Rights owned by Markit Economics Limited
*consultants are invited to specify any areas in which they have encountered skill
shortages during the latest month
Report on Jobs | Recruitment Industry Survey
The recruitment industry survey tracks both the
average salaries awarded to people placed in
permanent jobs each month, as well as average
hourly rates of pay for temp/contract staff.
Permanent salaries
A survey record increase in average starting salaries for
workers placed into permanent jobs by recruitment agencies
was signalled by the June survey data. Strong demand for
candidates, which also tended to be in short supply, alongside
competitive pressures underpinned June’s increase, which was
the twenty-sixth in successive months.
Strong increases in salaries were recorded across all
English regions, with the Midlands and London leading the
way.
Temp/contract pay rates
June data marked a seventeenth successive monthly
increase in the hourly rates of pay for temporary/contract staff.
Moreover, the pace of increase was the sharpest recorded
by the survey since November 2007. Around 22% of the
survey panel registered a rise in pay rates, generally citing a
strengthening marketplace.
All four English regions recorded rises in temp pay, with the
Midlands again recording the sharpest increase.
6 Pay pressures
1998 1999 2000 2001 2002 2003 2004 2005 2006 2007 2008 2009 2010 2011 2012 2013
35
40
45
50
55
60
65
70
Temp/Contract	Hourly	Pay	Rates
Permanent	Salaries
Increasing rate of decline
Increasing rate of growth
50 = no change on previous month
Pay Pressures
2013	Dec	 21.7	 75.8	 2.5	 19.2	 59.6	 60.6
2014	Jan	 23.8	 70.3	 5.8	 18.0	 59.0	 60.5
	 Feb	 25.5	 71.7	 2.8	 22.7	 61.4	 61.7
	 Mar	 29.0	 67.4	 3.6	 25.3	 62.7	 62.2
	 Apr	 32.1	 65.8	 2.1	 30.1	 65.0	 64.7
	 May	 33.3	 62.4	 4.3	 29.0	 64.5	 63.9
	 Jun	 38.3	 58.2	 3.5	 34.8	 67.4	 66.2
	 	 Higher	 Same	 Lower	 Net	 Index	 S.Adj.	
	           	 %	 %	 %	 +/-	 	 Index
Permanent Salaries
Q.Areaverage salaries awarded tostaffplaced in permanent
positions higher, the same or lower than one month ago?
2013	Dec	 9.0	 88.1	 2.9	 6.2	 53.1	 54.7
2014	Jan	 14.9	 81.6	 3.5	 11.4	 55.7	 55.0
	 Feb	 15.4	 82.1	 2.5	 13.0	 56.5	 56.7
	 Mar	 12.9	 83.9	 3.2	 9.7	 54.8	 54.6
	 Apr	 13.3	 85.4	 1.3	 12.0	 56.0	 56.5
	 May	 18.6	 76.9	 4.5	 14.2	 57.1	 57.2
	 Jun	 22.4	 74.1	 3.5	 18.8	 59.4	 59.7
	 	 Higher	 Same	 Lower	 Net	 Index	 S.Adj.	
	           	 %	 %	 %	 +/-	 	 Index
Temporary/Contract Pay Rates
Q. Are average hourly pay rates for temporary/contract staff
higher, the same or lower than one month ago?
2001 2002 2003 2004 2005 2006 2007 2008 2009 2010 2011 2012 2013
-6
-3
0
3
6
9
Public	sector
Private	sector
Annual percent change
Yr/yr % chg in average weekly earnings (3mma)
	 2011	 2012	 2013	 Jan'14	 Feb	 Mar	 Apr
Whole economy	 2.4	 1.4	 1.2	 1.4	 1.7	 1.9	 0.7
Private sector	 2.5	 1.5	 1.4	 1.6	 2.0	 2.0	 0.6
Public sector	 2.5	 1.3	 1.0	 0.5	 0.9	 1.1	 1.0
Services	 2.8	 1.4	 1.1	 1.1	 1.5	 1.7	 0.7
Manufacturing	 1.6	 1.8	 2.2	 3.2	 3.2	 3.1	 2.0
Construction	 0.9	 0.9	 0.0	 2.9	 3.2	 3.1	 -0.5
UK average weekly earnings
Data from the Office for National Statistics signalled
that annual growth of employee earnings (including
bonuses) dropped to just 0.7% during the three months
to April. The slowdown emanated mainly from the
private sector, where earnings rose just 0.6%.
Report on Jobs | Recruitment Industry Survey
7 Feature Record rise in employment	
	 KPMG LLP, a UK limited liability partnership, is a
	 subsidiary of KPMG Europe LLP and operates
	 from 22 offices across the UK with over 12,000
partners and staff.  The UK firm recorded a turnover of £1.8 billion
in the year ended September 2012. KPMG is a global network of
professional firms providing Audit, Tax, and Advisory services. We
operate in 156 countries and have 152,000 professionals working in
member firms around the world. The independent member firms of
the KPMG network are affiliated with KPMG International Cooperative
(“KPMG International”), a Swiss entity. KPMG International provides
no client services.
	 The REC is the professional body representing
	 the UK’s £24.6 billion private recruitment and
	 staffingindustrywithmorethan8,000recruitment
agencies and 6,000 recruitment consultants in membership. There are
over 1 million temporary workers registered with UK agencies who are
deployed in industry, commerce and the public services every day.
	 is a leading global diversified provider of
	 financial 	 information services. We provide
productsthatenhancetransparency,reduceriskandimproveoperational
efficiency. Our customers include banks, hedge funds, asset managers,
central banks, regulators, auditors, fund administrators and insurance
companies. Founded in 2003, we employ over 3,000 people in 11
countries. For more information, please see www.markit.com.
Recruitment Industry Survey
The monthly survey features original research data collected via
questionnaire by Markit from a panel of 400 UK recruitment and
employment consultancies. In 2010/11, some 1,049,333 people were
employed in either temporary or contract work through consultancies
and 604,193 people were placed in permanent positions through
consultancies. Monthly survey data were first collected in October
1997 and are collected in the end of each month, with respondents
asked to specify the direction of change in a number of survey variables.
Markit do not revise underlying survey data after first publication, but
seasonal adjustment factors may be revised from time to time as
appropriate which will affect the seasonally adjusted data series.
The intellectual property rights to these data are owned by or licensed to
MarkitEconomicsLimited.Anyunauthoriseduse,includingbutnotlimitedto
copying, distributing, transmitting or otherwise of any data appearing is not
permitted without Markit’s prior consent. The publication or release of any
of these data prior to the general release time is an infringement of Markit
Economics Limited’s intellectual property rights. Markit shall not have any
liability, duty or obligation for or relating to the content or information (“data”)
contained herein, any errors, inaccuracies, omissions or delays in the data,
or for any actions taken in reliance thereon. In no event shall Markit be liable
for any special, incidental, or consequential damages, arising out of the use
of the data. Purchasing Managers’ Index®
and PMI®
are either registered
trade marks of Markit Economics Limited or licensed to Markit Economics
Limited. Markit is a registered trade mark of Markit Group Limited.
Strong employment growth pushes jobless rate down
to 6.6%
UK unemployment continues to fall sharply amid yet another
bout of record hiring, bringing the jobless total to its lowest
since the start of 2009.
The latest figures from the Office for National Statistics
showed that the rate of unemployment fell from 7.2% in the
three months to January to 6.6% in the February to April
period, its lowest since January 2009.
The number of people claiming unemployment benefit also
decreased in May, down by 27,400 to the lowest since October
2008.
The number of people in employment meanwhile shot up by
345,000 in the three months to April, the largest jump seen
since data were first available in 1971.
Contrasting with prior months, the latest rise was driven by
companies taking on staff, rather than an increase in self-
employment.
All Intellectual Property Rights owned by Markit Economics Limited
Source: ONS.
Unemployment indicators
4.5
5.0
5.5
6.0
6.5
7.0
7.5
8.0
8.5
2005 2006 2007 2008 2009 2010 2011 2012 2013 2014
700
900
1100
1300
1500
1700
Unemployment rate
Claimant Count
UK unemployment rate (% ) Claimant count ('000)

More Related Content

What's hot

Ulster Bank NI PMI Slide Pack, April 2013
Ulster Bank NI PMI Slide Pack, April 2013Ulster Bank NI PMI Slide Pack, April 2013
Ulster Bank NI PMI Slide Pack, April 2013Richard Ramsey
 
January Labour Market Update
January Labour Market UpdateJanuary Labour Market Update
January Labour Market UpdateKaylan Bland
 
Ulster Bank NI PMI January 2018
Ulster Bank NI PMI January 2018Ulster Bank NI PMI January 2018
Ulster Bank NI PMI January 2018Richard Ramsey
 
The Latvian Economy - No 7, September 14, 2011
The Latvian Economy - No 7, September 14, 2011The Latvian Economy - No 7, September 14, 2011
The Latvian Economy - No 7, September 14, 2011Swedbank
 
Employment and Job Market - Canada - July 2016
Employment and Job Market - Canada - July 2016Employment and Job Market - Canada - July 2016
Employment and Job Market - Canada - July 2016paul young cpa, cga
 
February Labour Market Update
February Labour Market UpdateFebruary Labour Market Update
February Labour Market UpdateKaylan Bland
 
Ulster Bank Northern Ireland PMI Slide Pack August 2016
Ulster Bank Northern Ireland PMI Slide Pack August 2016Ulster Bank Northern Ireland PMI Slide Pack August 2016
Ulster Bank Northern Ireland PMI Slide Pack August 2016Richard Ramsey
 
The Latvian Economy - 2010 September (pdf)
The Latvian Economy - 2010 September (pdf)The Latvian Economy - 2010 September (pdf)
The Latvian Economy - 2010 September (pdf)Swedbank
 
Ulster Bank NI Slide Pack August 2017
Ulster Bank NI Slide Pack August 2017Ulster Bank NI Slide Pack August 2017
Ulster Bank NI Slide Pack August 2017Richard Ramsey
 
C&W-Marketbeat-U.S. Industrial-Q3-2018 #CRE #REALESTATE
C&W-Marketbeat-U.S. Industrial-Q3-2018 #CRE #REALESTATEC&W-Marketbeat-U.S. Industrial-Q3-2018 #CRE #REALESTATE
C&W-Marketbeat-U.S. Industrial-Q3-2018 #CRE #REALESTATEGuy Masse
 
DCR Trendline December 2013 – Contingent Worker Forecast and Supply Report
DCR Trendline December 2013 – Contingent Worker Forecast and Supply ReportDCR Trendline December 2013 – Contingent Worker Forecast and Supply Report
DCR Trendline December 2013 – Contingent Worker Forecast and Supply Reportss
 
Slide pack Ulster Bank NI PMI May 2016
Slide pack Ulster Bank NI PMI May 2016Slide pack Ulster Bank NI PMI May 2016
Slide pack Ulster Bank NI PMI May 2016Richard Ramsey
 
Ulster Bank NI Slide Pack November 2017
Ulster Bank NI Slide Pack November 2017Ulster Bank NI Slide Pack November 2017
Ulster Bank NI Slide Pack November 2017Richard Ramsey
 
Ulster Bank Northern Ireland Purchasing Managers Index (PMI) Slide Pack - Jan...
Ulster Bank Northern Ireland Purchasing Managers Index (PMI) Slide Pack - Jan...Ulster Bank Northern Ireland Purchasing Managers Index (PMI) Slide Pack - Jan...
Ulster Bank Northern Ireland Purchasing Managers Index (PMI) Slide Pack - Jan...Richard Ramsey
 
Ulster Bank Northern Ireland Purchasing Managers Index (PMI) December 2016
Ulster Bank Northern Ireland Purchasing Managers Index (PMI) December 2016Ulster Bank Northern Ireland Purchasing Managers Index (PMI) December 2016
Ulster Bank Northern Ireland Purchasing Managers Index (PMI) December 2016Richard Ramsey
 
Report on jobs November 6th
Report on jobs November 6thReport on jobs November 6th
Report on jobs November 6thAdrian Orton
 

What's hot (20)

Ulster Bank NI PMI Slide Pack, April 2013
Ulster Bank NI PMI Slide Pack, April 2013Ulster Bank NI PMI Slide Pack, April 2013
Ulster Bank NI PMI Slide Pack, April 2013
 
January Labour Market Update
January Labour Market UpdateJanuary Labour Market Update
January Labour Market Update
 
Ulster Bank NI PMI January 2018
Ulster Bank NI PMI January 2018Ulster Bank NI PMI January 2018
Ulster Bank NI PMI January 2018
 
The Latvian Economy - No 7, September 14, 2011
The Latvian Economy - No 7, September 14, 2011The Latvian Economy - No 7, September 14, 2011
The Latvian Economy - No 7, September 14, 2011
 
Employment and Job Market - Canada - July 2016
Employment and Job Market - Canada - July 2016Employment and Job Market - Canada - July 2016
Employment and Job Market - Canada - July 2016
 
February Labour Market Update
February Labour Market UpdateFebruary Labour Market Update
February Labour Market Update
 
Ulster Bank Northern Ireland PMI Slide Pack August 2016
Ulster Bank Northern Ireland PMI Slide Pack August 2016Ulster Bank Northern Ireland PMI Slide Pack August 2016
Ulster Bank Northern Ireland PMI Slide Pack August 2016
 
Ags Ed7 English
Ags Ed7 EnglishAgs Ed7 English
Ags Ed7 English
 
The Latvian Economy - 2010 September (pdf)
The Latvian Economy - 2010 September (pdf)The Latvian Economy - 2010 September (pdf)
The Latvian Economy - 2010 September (pdf)
 
Ulster Bank NI Slide Pack August 2017
Ulster Bank NI Slide Pack August 2017Ulster Bank NI Slide Pack August 2017
Ulster Bank NI Slide Pack August 2017
 
ONS Economic Forum 26 April 2018
ONS Economic Forum 26 April 2018ONS Economic Forum 26 April 2018
ONS Economic Forum 26 April 2018
 
Productivity and structural reforms
Productivity and structural reformsProductivity and structural reforms
Productivity and structural reforms
 
C&W-Marketbeat-U.S. Industrial-Q3-2018 #CRE #REALESTATE
C&W-Marketbeat-U.S. Industrial-Q3-2018 #CRE #REALESTATEC&W-Marketbeat-U.S. Industrial-Q3-2018 #CRE #REALESTATE
C&W-Marketbeat-U.S. Industrial-Q3-2018 #CRE #REALESTATE
 
DCR Trendline December 2013 – Contingent Worker Forecast and Supply Report
DCR Trendline December 2013 – Contingent Worker Forecast and Supply ReportDCR Trendline December 2013 – Contingent Worker Forecast and Supply Report
DCR Trendline December 2013 – Contingent Worker Forecast and Supply Report
 
Slide pack Ulster Bank NI PMI May 2016
Slide pack Ulster Bank NI PMI May 2016Slide pack Ulster Bank NI PMI May 2016
Slide pack Ulster Bank NI PMI May 2016
 
Ulster Bank NI Slide Pack November 2017
Ulster Bank NI Slide Pack November 2017Ulster Bank NI Slide Pack November 2017
Ulster Bank NI Slide Pack November 2017
 
Ulster Bank Northern Ireland Purchasing Managers Index (PMI) Slide Pack - Jan...
Ulster Bank Northern Ireland Purchasing Managers Index (PMI) Slide Pack - Jan...Ulster Bank Northern Ireland Purchasing Managers Index (PMI) Slide Pack - Jan...
Ulster Bank Northern Ireland Purchasing Managers Index (PMI) Slide Pack - Jan...
 
Ulster Bank Northern Ireland Purchasing Managers Index (PMI) December 2016
Ulster Bank Northern Ireland Purchasing Managers Index (PMI) December 2016Ulster Bank Northern Ireland Purchasing Managers Index (PMI) December 2016
Ulster Bank Northern Ireland Purchasing Managers Index (PMI) December 2016
 
JLL Pittsburgh Chart of the Week: April 6, 2015
JLL Pittsburgh Chart of the Week: April 6, 2015JLL Pittsburgh Chart of the Week: April 6, 2015
JLL Pittsburgh Chart of the Week: April 6, 2015
 
Report on jobs November 6th
Report on jobs November 6thReport on jobs November 6th
Report on jobs November 6th
 

Similar to Steven Jagger - June report on jobs

Permanent salaries rise at fastest rate since July 2007
Permanent salaries rise at fastest rate since July 2007Permanent salaries rise at fastest rate since July 2007
Permanent salaries rise at fastest rate since July 2007Steven Jagger
 
Market Intelligent Report
Market Intelligent ReportMarket Intelligent Report
Market Intelligent ReportLauraDeegan
 
DCR Trendline April 2015
DCR Trendline April 2015DCR Trendline April 2015
DCR Trendline April 2015ss
 
First Friday October 2014
First Friday October 2014First Friday October 2014
First Friday October 2014JCianciolo
 
March 2015 U.S. employment update and outlook
March 2015 U.S. employment update and outlookMarch 2015 U.S. employment update and outlook
March 2015 U.S. employment update and outlookJLL
 
First Friday august 2014
First Friday august 2014First Friday august 2014
First Friday august 2014Joe Cianciolo
 
FirstFridayPreview October 2014jims
FirstFridayPreview October 2014jimsFirstFridayPreview October 2014jims
FirstFridayPreview October 2014jimsJim Spellacy
 
February 2015 U.S. employment update and outlook
February 2015 U.S. employment update and outlookFebruary 2015 U.S. employment update and outlook
February 2015 U.S. employment update and outlookJLL
 
DCR Workforce June 2013 Trendline Report
DCR Workforce June 2013 Trendline ReportDCR Workforce June 2013 Trendline Report
DCR Workforce June 2013 Trendline Reportss
 
Q2 bms construction sales index
Q2 bms construction sales indexQ2 bms construction sales index
Q2 bms construction sales indexBMSRecruitment
 
RemX Workforce Perspectives Newsletter July 2017
RemX Workforce Perspectives Newsletter July 2017RemX Workforce Perspectives Newsletter July 2017
RemX Workforce Perspectives Newsletter July 2017RemX Staffing
 
RemX Workforce Perspectives Newsletter July 2017
RemX Workforce Perspectives Newsletter July 2017RemX Workforce Perspectives Newsletter July 2017
RemX Workforce Perspectives Newsletter July 2017Saskia Styles
 
Economic update (may 2013)
Economic update (may 2013)Economic update (may 2013)
Economic update (may 2013)veredus
 
Q1 bms business services sales index report
Q1 bms business services sales index reportQ1 bms business services sales index report
Q1 bms business services sales index reportBMSRecruitment
 
DCR TrendLine July 2014 - Non Employee Workforce Insight
DCR TrendLine July 2014 - Non Employee Workforce InsightDCR TrendLine July 2014 - Non Employee Workforce Insight
DCR TrendLine July 2014 - Non Employee Workforce Insightss
 
U.S. employment rate data and trends June 2014
U.S. employment rate data and trends June 2014U.S. employment rate data and trends June 2014
U.S. employment rate data and trends June 2014JLL
 
US employment rate data and trends – January 2017
US employment rate data and trends – January 2017US employment rate data and trends – January 2017
US employment rate data and trends – January 2017JLL
 
Friday market insight
Friday market insightFriday market insight
Friday market insightCurtis Stahle
 

Similar to Steven Jagger - June report on jobs (20)

Permanent salaries rise at fastest rate since July 2007
Permanent salaries rise at fastest rate since July 2007Permanent salaries rise at fastest rate since July 2007
Permanent salaries rise at fastest rate since July 2007
 
Market Intelligent Report
Market Intelligent ReportMarket Intelligent Report
Market Intelligent Report
 
FFP5DEC14-
FFP5DEC14-FFP5DEC14-
FFP5DEC14-
 
DCR Trendline April 2015
DCR Trendline April 2015DCR Trendline April 2015
DCR Trendline April 2015
 
First Friday October 2014
First Friday October 2014First Friday October 2014
First Friday October 2014
 
March 2015 U.S. employment update and outlook
March 2015 U.S. employment update and outlookMarch 2015 U.S. employment update and outlook
March 2015 U.S. employment update and outlook
 
First Friday august 2014
First Friday august 2014First Friday august 2014
First Friday august 2014
 
FirstFridayPreview October 2014jims
FirstFridayPreview October 2014jimsFirstFridayPreview October 2014jims
FirstFridayPreview October 2014jims
 
February 2015 U.S. employment update and outlook
February 2015 U.S. employment update and outlookFebruary 2015 U.S. employment update and outlook
February 2015 U.S. employment update and outlook
 
DCR Workforce June 2013 Trendline Report
DCR Workforce June 2013 Trendline ReportDCR Workforce June 2013 Trendline Report
DCR Workforce June 2013 Trendline Report
 
Q2 bms construction sales index
Q2 bms construction sales indexQ2 bms construction sales index
Q2 bms construction sales index
 
RemX Workforce Perspectives Newsletter July 2017
RemX Workforce Perspectives Newsletter July 2017RemX Workforce Perspectives Newsletter July 2017
RemX Workforce Perspectives Newsletter July 2017
 
RemX Workforce Perspectives Newsletter July 2017
RemX Workforce Perspectives Newsletter July 2017RemX Workforce Perspectives Newsletter July 2017
RemX Workforce Perspectives Newsletter July 2017
 
Economic update (may 2013)
Economic update (may 2013)Economic update (may 2013)
Economic update (may 2013)
 
Q1 bms business services sales index report
Q1 bms business services sales index reportQ1 bms business services sales index report
Q1 bms business services sales index report
 
Q2 bms it sales index
Q2 bms it sales indexQ2 bms it sales index
Q2 bms it sales index
 
DCR TrendLine July 2014 - Non Employee Workforce Insight
DCR TrendLine July 2014 - Non Employee Workforce InsightDCR TrendLine July 2014 - Non Employee Workforce Insight
DCR TrendLine July 2014 - Non Employee Workforce Insight
 
U.S. employment rate data and trends June 2014
U.S. employment rate data and trends June 2014U.S. employment rate data and trends June 2014
U.S. employment rate data and trends June 2014
 
US employment rate data and trends – January 2017
US employment rate data and trends – January 2017US employment rate data and trends – January 2017
US employment rate data and trends – January 2017
 
Friday market insight
Friday market insightFriday market insight
Friday market insight
 

Recently uploaded

美国SU学位证,雪城大学毕业证书1:1制作
美国SU学位证,雪城大学毕业证书1:1制作美国SU学位证,雪城大学毕业证书1:1制作
美国SU学位证,雪城大学毕业证书1:1制作ss846v0c
 
Ioannis Tzachristas Self-Presentation for MBA.pdf
Ioannis Tzachristas Self-Presentation for MBA.pdfIoannis Tzachristas Self-Presentation for MBA.pdf
Ioannis Tzachristas Self-Presentation for MBA.pdfjtzach
 
格里菲斯大学毕业证(Griffith毕业证)#文凭成绩单#真实留信学历认证永久存档
格里菲斯大学毕业证(Griffith毕业证)#文凭成绩单#真实留信学历认证永久存档格里菲斯大学毕业证(Griffith毕业证)#文凭成绩单#真实留信学历认证永久存档
格里菲斯大学毕业证(Griffith毕业证)#文凭成绩单#真实留信学历认证永久存档208367051
 
Gurgaon Call Girls: Free Delivery 24x7 at Your Doorstep G.G.N = 8377087607
Gurgaon Call Girls: Free Delivery 24x7 at Your Doorstep G.G.N = 8377087607Gurgaon Call Girls: Free Delivery 24x7 at Your Doorstep G.G.N = 8377087607
Gurgaon Call Girls: Free Delivery 24x7 at Your Doorstep G.G.N = 8377087607dollysharma2066
 
ME 205- Chapter 6 - Pure Bending of Beams.pdf
ME 205- Chapter 6 - Pure Bending of Beams.pdfME 205- Chapter 6 - Pure Bending of Beams.pdf
ME 205- Chapter 6 - Pure Bending of Beams.pdfaae4149584
 
原版定制copy澳洲查尔斯达尔文大学毕业证CDU毕业证成绩单留信学历认证保障质量
原版定制copy澳洲查尔斯达尔文大学毕业证CDU毕业证成绩单留信学历认证保障质量原版定制copy澳洲查尔斯达尔文大学毕业证CDU毕业证成绩单留信学历认证保障质量
原版定制copy澳洲查尔斯达尔文大学毕业证CDU毕业证成绩单留信学历认证保障质量sehgh15heh
 
定制(ECU毕业证书)埃迪斯科文大学毕业证毕业证成绩单原版一比一
定制(ECU毕业证书)埃迪斯科文大学毕业证毕业证成绩单原版一比一定制(ECU毕业证书)埃迪斯科文大学毕业证毕业证成绩单原版一比一
定制(ECU毕业证书)埃迪斯科文大学毕业证毕业证成绩单原版一比一fjjwgk
 
AICTE PPT slide of Engineering college kr pete
AICTE PPT slide of Engineering college kr peteAICTE PPT slide of Engineering college kr pete
AICTE PPT slide of Engineering college kr peteshivubhavv
 
Crack JAG. Guidance program for entry to JAG Dept. & SSB interview
Crack JAG. Guidance program for entry to JAG Dept. & SSB interviewCrack JAG. Guidance program for entry to JAG Dept. & SSB interview
Crack JAG. Guidance program for entry to JAG Dept. & SSB interviewNilendra Kumar
 
原版快速办理MQU毕业证麦考瑞大学毕业证成绩单留信学历认证
原版快速办理MQU毕业证麦考瑞大学毕业证成绩单留信学历认证原版快速办理MQU毕业证麦考瑞大学毕业证成绩单留信学历认证
原版快速办理MQU毕业证麦考瑞大学毕业证成绩单留信学历认证nhjeo1gg
 
办澳洲詹姆斯库克大学毕业证成绩单pdf电子版制作修改
办澳洲詹姆斯库克大学毕业证成绩单pdf电子版制作修改办澳洲詹姆斯库克大学毕业证成绩单pdf电子版制作修改
办澳洲詹姆斯库克大学毕业证成绩单pdf电子版制作修改yuu sss
 
定制(SCU毕业证书)南十字星大学毕业证成绩单原版一比一
定制(SCU毕业证书)南十字星大学毕业证成绩单原版一比一定制(SCU毕业证书)南十字星大学毕业证成绩单原版一比一
定制(SCU毕业证书)南十字星大学毕业证成绩单原版一比一z xss
 
8377877756 Full Enjoy @24/7 Call Girls in Pitampura Delhi NCR
8377877756 Full Enjoy @24/7 Call Girls in Pitampura Delhi NCR8377877756 Full Enjoy @24/7 Call Girls in Pitampura Delhi NCR
8377877756 Full Enjoy @24/7 Call Girls in Pitampura Delhi NCRdollysharma2066
 
Most Inspirational Leaders Empowering the Educational Sector, 2024.pdf
Most Inspirational Leaders Empowering the Educational Sector, 2024.pdfMost Inspirational Leaders Empowering the Educational Sector, 2024.pdf
Most Inspirational Leaders Empowering the Educational Sector, 2024.pdfTheKnowledgeReview2
 
办理(Salford毕业证书)索尔福德大学毕业证成绩单原版一比一
办理(Salford毕业证书)索尔福德大学毕业证成绩单原版一比一办理(Salford毕业证书)索尔福德大学毕业证成绩单原版一比一
办理(Salford毕业证书)索尔福德大学毕业证成绩单原版一比一diploma 1
 
办理学位证(纽伦堡大学文凭证书)纽伦堡大学毕业证成绩单原版一模一样
办理学位证(纽伦堡大学文凭证书)纽伦堡大学毕业证成绩单原版一模一样办理学位证(纽伦堡大学文凭证书)纽伦堡大学毕业证成绩单原版一模一样
办理学位证(纽伦堡大学文凭证书)纽伦堡大学毕业证成绩单原版一模一样umasea
 
Application deck- Cyril Caudroy-2024.pdf
Application deck- Cyril Caudroy-2024.pdfApplication deck- Cyril Caudroy-2024.pdf
Application deck- Cyril Caudroy-2024.pdfCyril CAUDROY
 
Drawing animals and props.pptxDrawing animals and props.pptxDrawing animals a...
Drawing animals and props.pptxDrawing animals and props.pptxDrawing animals a...Drawing animals and props.pptxDrawing animals and props.pptxDrawing animals a...
Drawing animals and props.pptxDrawing animals and props.pptxDrawing animals a...RegineManuel2
 
Jumark Morit Diezmo- Career portfolio- BPED 3A
Jumark Morit Diezmo- Career portfolio- BPED 3AJumark Morit Diezmo- Career portfolio- BPED 3A
Jumark Morit Diezmo- Career portfolio- BPED 3Ajumarkdiezmo1
 

Recently uploaded (20)

美国SU学位证,雪城大学毕业证书1:1制作
美国SU学位证,雪城大学毕业证书1:1制作美国SU学位证,雪城大学毕业证书1:1制作
美国SU学位证,雪城大学毕业证书1:1制作
 
Ioannis Tzachristas Self-Presentation for MBA.pdf
Ioannis Tzachristas Self-Presentation for MBA.pdfIoannis Tzachristas Self-Presentation for MBA.pdf
Ioannis Tzachristas Self-Presentation for MBA.pdf
 
格里菲斯大学毕业证(Griffith毕业证)#文凭成绩单#真实留信学历认证永久存档
格里菲斯大学毕业证(Griffith毕业证)#文凭成绩单#真实留信学历认证永久存档格里菲斯大学毕业证(Griffith毕业证)#文凭成绩单#真实留信学历认证永久存档
格里菲斯大学毕业证(Griffith毕业证)#文凭成绩单#真实留信学历认证永久存档
 
Gurgaon Call Girls: Free Delivery 24x7 at Your Doorstep G.G.N = 8377087607
Gurgaon Call Girls: Free Delivery 24x7 at Your Doorstep G.G.N = 8377087607Gurgaon Call Girls: Free Delivery 24x7 at Your Doorstep G.G.N = 8377087607
Gurgaon Call Girls: Free Delivery 24x7 at Your Doorstep G.G.N = 8377087607
 
ME 205- Chapter 6 - Pure Bending of Beams.pdf
ME 205- Chapter 6 - Pure Bending of Beams.pdfME 205- Chapter 6 - Pure Bending of Beams.pdf
ME 205- Chapter 6 - Pure Bending of Beams.pdf
 
原版定制copy澳洲查尔斯达尔文大学毕业证CDU毕业证成绩单留信学历认证保障质量
原版定制copy澳洲查尔斯达尔文大学毕业证CDU毕业证成绩单留信学历认证保障质量原版定制copy澳洲查尔斯达尔文大学毕业证CDU毕业证成绩单留信学历认证保障质量
原版定制copy澳洲查尔斯达尔文大学毕业证CDU毕业证成绩单留信学历认证保障质量
 
定制(ECU毕业证书)埃迪斯科文大学毕业证毕业证成绩单原版一比一
定制(ECU毕业证书)埃迪斯科文大学毕业证毕业证成绩单原版一比一定制(ECU毕业证书)埃迪斯科文大学毕业证毕业证成绩单原版一比一
定制(ECU毕业证书)埃迪斯科文大学毕业证毕业证成绩单原版一比一
 
AICTE PPT slide of Engineering college kr pete
AICTE PPT slide of Engineering college kr peteAICTE PPT slide of Engineering college kr pete
AICTE PPT slide of Engineering college kr pete
 
Crack JAG. Guidance program for entry to JAG Dept. & SSB interview
Crack JAG. Guidance program for entry to JAG Dept. & SSB interviewCrack JAG. Guidance program for entry to JAG Dept. & SSB interview
Crack JAG. Guidance program for entry to JAG Dept. & SSB interview
 
原版快速办理MQU毕业证麦考瑞大学毕业证成绩单留信学历认证
原版快速办理MQU毕业证麦考瑞大学毕业证成绩单留信学历认证原版快速办理MQU毕业证麦考瑞大学毕业证成绩单留信学历认证
原版快速办理MQU毕业证麦考瑞大学毕业证成绩单留信学历认证
 
办澳洲詹姆斯库克大学毕业证成绩单pdf电子版制作修改
办澳洲詹姆斯库克大学毕业证成绩单pdf电子版制作修改办澳洲詹姆斯库克大学毕业证成绩单pdf电子版制作修改
办澳洲詹姆斯库克大学毕业证成绩单pdf电子版制作修改
 
定制(SCU毕业证书)南十字星大学毕业证成绩单原版一比一
定制(SCU毕业证书)南十字星大学毕业证成绩单原版一比一定制(SCU毕业证书)南十字星大学毕业证成绩单原版一比一
定制(SCU毕业证书)南十字星大学毕业证成绩单原版一比一
 
8377877756 Full Enjoy @24/7 Call Girls in Pitampura Delhi NCR
8377877756 Full Enjoy @24/7 Call Girls in Pitampura Delhi NCR8377877756 Full Enjoy @24/7 Call Girls in Pitampura Delhi NCR
8377877756 Full Enjoy @24/7 Call Girls in Pitampura Delhi NCR
 
Most Inspirational Leaders Empowering the Educational Sector, 2024.pdf
Most Inspirational Leaders Empowering the Educational Sector, 2024.pdfMost Inspirational Leaders Empowering the Educational Sector, 2024.pdf
Most Inspirational Leaders Empowering the Educational Sector, 2024.pdf
 
办理(Salford毕业证书)索尔福德大学毕业证成绩单原版一比一
办理(Salford毕业证书)索尔福德大学毕业证成绩单原版一比一办理(Salford毕业证书)索尔福德大学毕业证成绩单原版一比一
办理(Salford毕业证书)索尔福德大学毕业证成绩单原版一比一
 
办理学位证(纽伦堡大学文凭证书)纽伦堡大学毕业证成绩单原版一模一样
办理学位证(纽伦堡大学文凭证书)纽伦堡大学毕业证成绩单原版一模一样办理学位证(纽伦堡大学文凭证书)纽伦堡大学毕业证成绩单原版一模一样
办理学位证(纽伦堡大学文凭证书)纽伦堡大学毕业证成绩单原版一模一样
 
Application deck- Cyril Caudroy-2024.pdf
Application deck- Cyril Caudroy-2024.pdfApplication deck- Cyril Caudroy-2024.pdf
Application deck- Cyril Caudroy-2024.pdf
 
Young Call~Girl in Pragati Maidan New Delhi 8448380779 Full Enjoy Escort Service
Young Call~Girl in Pragati Maidan New Delhi 8448380779 Full Enjoy Escort ServiceYoung Call~Girl in Pragati Maidan New Delhi 8448380779 Full Enjoy Escort Service
Young Call~Girl in Pragati Maidan New Delhi 8448380779 Full Enjoy Escort Service
 
Drawing animals and props.pptxDrawing animals and props.pptxDrawing animals a...
Drawing animals and props.pptxDrawing animals and props.pptxDrawing animals a...Drawing animals and props.pptxDrawing animals and props.pptxDrawing animals a...
Drawing animals and props.pptxDrawing animals and props.pptxDrawing animals a...
 
Jumark Morit Diezmo- Career portfolio- BPED 3A
Jumark Morit Diezmo- Career portfolio- BPED 3AJumark Morit Diezmo- Career portfolio- BPED 3A
Jumark Morit Diezmo- Career portfolio- BPED 3A
 

Steven Jagger - June report on jobs

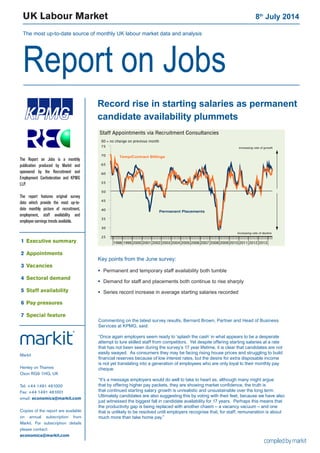
  • 1. UK Labour Market 8th July 2014 The most up-to-date source of monthly UK labour market data and analysis Report on Jobs 1998 1999 2000 2001 2002 2003 2004 2005 2006 2007 2008 2009 2010 2011 2012 2013 25 30 35 40 45 50 55 60 65 70 75 Temp/Contract Billings Permanent Placements Increasing rate of decline Increasing rate of growth 50 = no change on previous month Staff Appointments via Recruitment Consultancies Record rise in starting salaries as permanent candidate availability plummets Commenting on the latest survey results, Bernard Brown, Partner and Head of Business Services at KPMG, said: “Once again employers seem ready to ‘splash the cash’ in what appears to be a desperate attempt to lure skilled staff from competitors. Yet despite offering starting salaries at a rate that has not been seen during the survey’s 17 year lifetime, it is clear that candidates are not easily swayed. As consumers they may be facing rising house prices and struggling to build financial reserves because of low interest rates, but the desire for extra disposable income is not yet translating into a generation of employees who are only loyal to their monthly pay cheque. “It’s a message employers would do well to take to heart as, although many might argue that by offering higher pay packets, they are showing market confidence, the truth is that continued starting salary growth is unrealistic and unsustainable over the long term. Ultimately candidates are also suggesting this by voting with their feet, because we have also just witnessed the biggest fall in candidate availability for 17 years. Perhaps this means that the productivity gap is being replaced with another chasm – a vacancy vacuum – and one that is unlikely to be resolved until employers recognise that, for staff, remuneration is about much more than take home pay.” Markit Henley on Thames Oxon RG9 1HG, UK Tel: +44 1491 461000 Fax: +44 1491 461001 email: economics@markit.com Copies of the report are available on annual subscription from Markit. For subscription details please contact: economics@markit.com The Report on Jobs is a monthly publication produced by Markit and sponsored by the Recruitment and Employment Confederation and KPMG LLP. The report features original survey data which provide the most up-to- date monthly picture of recruitment, employment, staff availability and employee earnings trends available. 1 Executive summary 2 Appointments 3 Vacancies 4 Sectoral demand 5 Staff availability 6 Pay pressures 7 Special feature Key points from the June survey: Permanent and temporary staff availability both tumble Demand for staff and placements both continue to rise sharply Series record increase in average starting salaries recorded   
  • 2. Report on Jobs | Recruitment Industry Survey The Report on Jobs is unique in providing the most comprehensive guide to the UK labour market, drawing on original survey data provided by recruitment consultancies and employers to provide the first indication each month of labour market trends. The main findings for June are: Record fall in permanent staff availability in June... The latest survey of UK recruitment consultancies indicated a considerable reduction in the availability of staff to fill permanent roles. The rate of contraction accelerated to the sharpest seen in the survey history, which began in October 1997. Temporary/contract staff also recorded a sharp deterioration in availability, with June’s drop the greatest seen since March 1998. ...helps drive starting salaries up at series record pace... Amid reports of a short supply of suitable candidates, and with demand for staff increasing, permanent salaries rose during June at a survey record rate. Salaries have now risen for twenty-six months in succession. Moreover, temporary/contract staff hourly pay rates rose at the sharpest rate since November 2007. ...as demand for staff continues to grow... Latest vacancy data indicated faster increases in the demand for both permanent and temporary staff during June. Growth was led the private sector, with demand here continuing to rise at a rate that comfortably outstripped those seen in the public sector. ...and placements rise As companies sought to efficiently fill vacancies, permanent placements continued to increase during June. Although remaining sharp by historical standards, the rate of growth was the lowest seen since last November. Temporary/contract staff billings in contrast increased at the sharpest pace for five months. 1 Executive summary 1998 1999 2000 2001 2002 2003 2004 2005 2006 2007 2008 2009 2010 2011 2012 2013 25 30 35 40 45 50 55 60 65 70 Staff Appointments Temp/Contract Billings Permanent Placements 25 30 35 40 45 50 55 60 65 70 50 = no change on previous month 50=no change on previous month 1998 1999 2000 2001 2002 2003 2004 2005 2006 2007 2008 2009 2010 2011 2012 2013 35 40 45 50 55 60 65 70 Staff Availability and Earnings Growth Skill shortages Average permanent salaries (LHS) 90 80 70 60 50 40 30 50 = no change on previous month 50 = no change on previous month (inverted) inverted - RHS) (Availability of staff 1998 1999 2000 2001 2002 2003 2004 2005 2006 2007 2008 2009 2010 2011 2012 2013 2014 Temp/Contract Vacancies Permanent Vacancies 50 = no change on previous month 25 30 35 40 45 50 55 60 65 70 75 Increasing rate of growth Increasing rate of decline Demand for staff All Intellectual Property Rights owned by Markit Economics Limited
  • 3. Report on Jobs | Recruitment Industry Survey Recruitment consultancies report on the number of people placed in permanent jobs each month, and their revenues (billings) received from placing people in temporary or contract positions at employers. June’s survey data showed the continuation of strong growth in permanent placements and temporary staff billings, with the latter recording the sharper rate of increase. Further strong rise in permanent placements A sharp increase in permanent placements was again signalled in June, with just under half of the survey panel recording growth. There were reports amongst recruitment consultancies that strong growth was again reflective of high demand for staff and increased confidence amongst companies which was leading to a buoyant labour market. Permanent staff placements have now risen for 21 months in a row, although the latest rate of growth was the lowest seen since last November. Of the four broad English regions for which data are available, the sharpest increase in permanent placements was seen in the Midlands, closely followed by the South. London remained a relative laggard, although even here growth was historically strong. Growth of temp billings hits five- month high Recruitment agencies registered their strongest net increase in temp billings for five months in June, thereby also extending the current sequence of growth to 14 months. There were reports of increased demand across all sectors as clients signalled higher business requirements. Leading the way in terms of temp billings growth was the Midlands followed by the South. The North saw a stronger increase in temp billings, but London recorded a slower rate of expansion. An index reading above 50 signals a higher number of placements/billings than the previous month. Readings below 50 signal a decline compared with the previous month. 2 Staff appointments 1998 1999 2000 2001 2002 2003 2004 2005 2006 2007 2008 2009 2010 2011 2012 2013 25 30 35 40 45 50 55 60 65 70 75 Temp/Contract Billings Permanent Placements Increasing rate of decline Increasing rate of growth 50 = no change on previous month Staff Appointments via Recruitment Consultancies 2014 Jan 49.8 30.3 19.9 29.8 64.9 62.1 Feb 49.8 33.7 16.5 33.2 66.6 65.2 Mar 49.7 32.7 17.6 32.1 66.0 62.6 Apr 50.1 31.3 18.6 31.4 65.7 63.8 May 43.4 38.0 18.6 24.9 62.4 62.8 Jun 49.0 30.9 20.1 28.9 64.4 61.3 Higher Same Lower Net Index S.Adj. % % % +/- 50 = no chg Index Permanent Staff Placements Q. Please compare the number of staff placed in permanent positions with the number one month ago. 2014 Jan 25.1 45.1 29.8 -4.7 47.6 62.8 Feb 42.2 37.8 20.0 22.2 61.1 61.7 Mar 40.8 46.6 12.6 28.2 64.1 59.9 Apr 37.8 41.9 20.3 17.4 58.7 58.9 May 39.2 43.2 17.6 21.6 60.8 59.1 Jun 48.1 38.4 13.5 34.6 67.3 62.2 Higher Same Lower Net Index S.Adj. % % % +/- 50 = no chg Index Temporary/Contract Staff Billings Q. Please compare your billings received from the employment of temporary and contract staff with the situation one month ago.
  • 4. Report on Jobs | Recruitment Industry Survey 3 Vacancies All Intellectual Property Rights owned by Markit Economics Limited Recruitment consultants are asked to specify whether the demand for staff from employers has changed on the previous month, thereby providing an indicator of the number of job vacancies. The summary indexes shown in this page are derived from the detailed sector data shown on page 5. Faster increases in demand for permanent and temporary staff The Report on Jobs Vacancy Index remained well above the 50.0 no-change mark in June to signal another marked increase in the demand for staff. Posting 66.5, the index improved on May’s five-month low and again signalled a sharp rate of growth. Latest data showed demand for permanent staff continued to rise at a sharper pace than for temporary workers. Public & private sector vacancies June’s survey results again showed that demand for staff continued to increase at a considerably quicker rate from the private sector for both permanent and temporary workers. In both the public and private sectors, demand for temporary workers rose at rates that outstripped those seen for permanent staff. Other vacancy indicators Latest official data from the Office for National Statistics (ONS) indicated continued strong growth of job vacancies in April, with a year-on-year rise of 22.3% recorded. Meanwhile, internet-based recruitment spending continued to increase at a strong annual pace. Latest data showed a 10.1% rise during Q4 2013. The Job Vacancies Index monitors the overall demand for staff at recruitment consultancies. An index reading above 50 signals a higher number of vacancies than the previous month. Readings below 50 signal a decline compared with the previous month. 1998 1999 2000 2001 2002 2003 2004 2005 2006 2007 2008 2009 2010 2011 2012 2013 2014 Temp/Contract Vacancies Permanent Vacancies 50 = no change on previous month 25 30 35 40 45 50 55 60 65 70 75 Increasing rate of growth Increasing rate of decline 25 30 35 40 45 50 55 60 65 70 75 Job Vacancies 50 = no change on previous month Vacancy Index Increasing rate of growth Increasing rate of decline Job Vacancy Indicators Feb’14 Mar Apr May Jun Job Vacancy Index (recruitment industry survey) 50 = no change on previous month Other key vacancy data Annual % change Sources: Job centre vacancies provided by Office for National Statistics Internet recruitment spending provided by WARC.com Total 67.0 66.9 66.8 65.8 66.5 Permanent Staff 67.1 67.0 66.9 65.9 66.6 Temporary Staff 64.8 65.7 64.9 64.4 65.7 Public: perm 56.7 56.0 56.0 57.1 53.6 Public: temp 56.3 59.7 57.8 55.2 57.6 Private: perm 74.9 72.1 72.6 71.4 73.0 Private: temp 66.8 69.9 67.6 69.4 74.0 Job centre vacancies 22.5 22.9 22.3 n/a n/a Internet recruitment 10.1 -- -- -- -- Public & private sector vacancies (not seasonally adjusted)
  • 5. Report on Jobs | Recruitment Industry Survey Recruitment consultancies are requested to compare the demand for staff according to sector with the situation one month ago. Permanent Staff Engineering was the best performing sector in the demand for staff ‘league table’ during June. Construction also continued its recent strong performance, recording a considerable rate of growth. Hotel & Catering was the weakest performer. 4 Demand for staff by sector 50 = no change on previous month Demand for staff 20 30 40 50 60 70 80 90 Secretarial & Clerical Perm Tem p 2002 2003 2004 2005 2006 2007 2008 2009 2010 2011 2012 2013 20 30 40 50 60 70 80 90 Accounting & Financial Tem p Perm 200220032004200520062007200820092010201120122013 2002 2003 2004 2005 2006 2007 2008 2009 2010 2011 2012 2013 20 30 40 50 60 70 80 90 Executive & Professional Perm Tem p 2002 200320042005 20062007 200820092010 20112012 2013 20 30 40 50 60 70 80 90 IT & Computing Tem p Perm 20 30 40 50 60 70 80 90 2002 2003 2004 2005 2006 2007 2008 2009 2010 2011 2012 2013 Tem p Blue Collar Perm 20 30 40 50 60 70 80 90 200220032004200520062007200820092010201120122013 Nursing/Medical/Care Tem p Perm 2002 2003 2004 2005 2006 2007 2008 2009 2010 2011 2012 2013 20 30 40 50 60 70 80 90 Hotel & Catering Tem p Perm Engineering; Construction This year (Last year) Rank Jun'14 Rank Jun'13 This year (Last year) Rank Jun'14 Rank Jun'13 *Non-seasonally adjusted data. Prior to April 2013 Engineering/Construction was reported as a single category. Data are presented in the form of diffusion indices whereby a reading of 50 indicates no change on the previous month. Readings above 50 signal stronger demand than a month ago. Readings below 50 signal weaker demand than a month ago. Engineering* 1 69.7 (2) (60.7) Blue Collar 2 69.1 (5) (56.6) Construction* 3 67.0 (3) (58.1) Secretarial/Clerical 4 64.3 (6) (56.3) IT & Computing 5 63.8 (4) (57.6) Accounting/Financial 6 63.0 (9) (53.7) Nursing/Medical/Care 7 62.9 (1) (65.3) Hotel & Catering 8 62.7 (7) (55.2) Executive/Professional 9 62.0 (8) (54.1) Engineering* 1 74.3 (4) (60.7) Construction* 2 72.7 (4) (60.7) Accounting/Financial 3 68.0 (6) (58.3) IT & Computing 4 66.9 (1) (61.7) Executive/Professional 5 66.6 (3) (61.0) Secretarial/Clerical 6 64.4 (7) (56.0) Nursing/Medical/Care 7 63.2 (2) (61.1) Blue Collar 8 62.4 (8) (53.9) Hotel & Catering 9 60.4 (9) (53.4) 46 50 54 58 62 66 70 74 78 Engineering Construction Perm Temp Temporary/contract staff Engineering workers were also the most in-demand type of temporary staff during June, followed by Blue Collar and then Construction. Demand for temporary staff is rising at stronger rates across all categories when compared to 12 months ago, with the exception of Nursing/Medical/Care.
  • 6. Report on Jobs | Recruitment Industry Survey Recruitment consultants are asked to report whether availability of permanent and temporary staff has changed on the previous month. An overall indicator of staff availability is also calculated. Availability of permanent staff In line with a rapidly tightening UK labour market, the availability of permanent staff continued to decline in June. Moreover, the rate of contraction accelerated for a fifth successive month to a new series record (data have been collected since October 1997). Nearly half of the survey panel indicated a fall in candidate availability during June and it was in the South of England where the sharpest reduction was registered, followed by the Midlands, the North and then London. Availability of temp/contract staff Having eased slightly during May, the latest data indicated a sharp acceleration in the rate of contraction in temporary/ contract staff. With 38% of the survey panel recording a fall, the net decline was the sharpest since March 1998. In line with recent trends, temp availability fell across all four English regions. The Midlands and London recorded the sharpest reductions. 5 Staff availability 1998 1999 2000 2001 2002 2003 2004 2005 2006 2007 2008 2009 2010 2011 2012 2013 Temp Availability Permanent Availability 50 = no change on previous month 20 30 40 50 60 70 80 90Improving availability Deteriorating availability 20 30 40 50 60 70 80 90 Staff Availability 50 = no change on previous month Staff Availability Index Improving availability Deteriorating availability 2014 Jan 27.3 42.2 30.5 -3.2 48.4 41.1 Feb 16.8 49.4 33.8 -17.0 41.5 39.0 Mar 13.8 47.9 38.3 -24.5 37.8 38.0 Apr 12.2 50.1 37.7 -25.5 37.2 37.6 May 7.8 51.6 40.5 -32.7 33.6 34.9 Jun 4.9 45.2 49.9 -45.0 27.5 28.9 Key permanent staff skills reported in short supply:* Accountancy/Financial: Accountants. Blue Collar: HGV Drivers. Engineering: Qualified Engineers, Project Managers. Executive/Professional: Client Relationship Managers, Logistics Professionals, Field Sales. Hotels/ Catering: F&B Managers, Chefs. Nursing/Medical/Care: Care Workers, Home Carers, Nurses. IT/Computing: CAD Designer, eCommerce, .net, JAVA, SQL, Net Developers, IT Developers. Secretarial/Clerical: HR. Other: Estimators, Supervisors, Telesales Professionals, Business Developers. Key temp skills reported in short supply:* Accountancy/Financial: Payroll. Blue Collar: FLT Drivers, LGV Drivers Engineering: Fabricator Welders, Plater Welders, Qualified Engineers. Hotels/Catering: Chefs. IT/ Computing: Developers, eCommerce, JAVA, SQL. Nursing/ Medical/Care: Health Care Assistants, Home Care Workers, Nurses. Secretarial/Clerical: Repographics Operators, Legal Secretaries, Receptionists. Other: Tele Marketers, Experienced Sales Personnel, Marketing, Business Developers. Availability of permanent staff Q. Is the availability of candidates for permanent vacancies better, the same or worse than one month ago? Better Same Worse Net Index S.Adj. % % % +/- Index 2014 Jan 24.6 53.2 22.3 2.3 51.1 44.6 Feb 17.6 57.1 25.3 -7.7 46.1 43.6 Mar 10.6 60.2 29.1 -18.5 40.8 41.7 Apr 10.3 56.6 33.2 -22.9 38.6 39.8 May 9.8 57.6 32.6 -22.8 38.6 40.1 Jun 10.5 51.9 37.6 -27.2 36.4 36.6 Availability of temporary/contract staff Q. Is the availability of candidates for temporary vacancies better, the same or worse than one month ago? Better Same Worse Net Index S.Adj. % % % +/- Index All Intellectual Property Rights owned by Markit Economics Limited *consultants are invited to specify any areas in which they have encountered skill shortages during the latest month
  • 7. Report on Jobs | Recruitment Industry Survey The recruitment industry survey tracks both the average salaries awarded to people placed in permanent jobs each month, as well as average hourly rates of pay for temp/contract staff. Permanent salaries A survey record increase in average starting salaries for workers placed into permanent jobs by recruitment agencies was signalled by the June survey data. Strong demand for candidates, which also tended to be in short supply, alongside competitive pressures underpinned June’s increase, which was the twenty-sixth in successive months. Strong increases in salaries were recorded across all English regions, with the Midlands and London leading the way. Temp/contract pay rates June data marked a seventeenth successive monthly increase in the hourly rates of pay for temporary/contract staff. Moreover, the pace of increase was the sharpest recorded by the survey since November 2007. Around 22% of the survey panel registered a rise in pay rates, generally citing a strengthening marketplace. All four English regions recorded rises in temp pay, with the Midlands again recording the sharpest increase. 6 Pay pressures 1998 1999 2000 2001 2002 2003 2004 2005 2006 2007 2008 2009 2010 2011 2012 2013 35 40 45 50 55 60 65 70 Temp/Contract Hourly Pay Rates Permanent Salaries Increasing rate of decline Increasing rate of growth 50 = no change on previous month Pay Pressures 2013 Dec 21.7 75.8 2.5 19.2 59.6 60.6 2014 Jan 23.8 70.3 5.8 18.0 59.0 60.5 Feb 25.5 71.7 2.8 22.7 61.4 61.7 Mar 29.0 67.4 3.6 25.3 62.7 62.2 Apr 32.1 65.8 2.1 30.1 65.0 64.7 May 33.3 62.4 4.3 29.0 64.5 63.9 Jun 38.3 58.2 3.5 34.8 67.4 66.2 Higher Same Lower Net Index S.Adj. % % % +/- Index Permanent Salaries Q.Areaverage salaries awarded tostaffplaced in permanent positions higher, the same or lower than one month ago? 2013 Dec 9.0 88.1 2.9 6.2 53.1 54.7 2014 Jan 14.9 81.6 3.5 11.4 55.7 55.0 Feb 15.4 82.1 2.5 13.0 56.5 56.7 Mar 12.9 83.9 3.2 9.7 54.8 54.6 Apr 13.3 85.4 1.3 12.0 56.0 56.5 May 18.6 76.9 4.5 14.2 57.1 57.2 Jun 22.4 74.1 3.5 18.8 59.4 59.7 Higher Same Lower Net Index S.Adj. % % % +/- Index Temporary/Contract Pay Rates Q. Are average hourly pay rates for temporary/contract staff higher, the same or lower than one month ago? 2001 2002 2003 2004 2005 2006 2007 2008 2009 2010 2011 2012 2013 -6 -3 0 3 6 9 Public sector Private sector Annual percent change Yr/yr % chg in average weekly earnings (3mma) 2011 2012 2013 Jan'14 Feb Mar Apr Whole economy 2.4 1.4 1.2 1.4 1.7 1.9 0.7 Private sector 2.5 1.5 1.4 1.6 2.0 2.0 0.6 Public sector 2.5 1.3 1.0 0.5 0.9 1.1 1.0 Services 2.8 1.4 1.1 1.1 1.5 1.7 0.7 Manufacturing 1.6 1.8 2.2 3.2 3.2 3.1 2.0 Construction 0.9 0.9 0.0 2.9 3.2 3.1 -0.5 UK average weekly earnings Data from the Office for National Statistics signalled that annual growth of employee earnings (including bonuses) dropped to just 0.7% during the three months to April. The slowdown emanated mainly from the private sector, where earnings rose just 0.6%.
  • 8. Report on Jobs | Recruitment Industry Survey 7 Feature Record rise in employment KPMG LLP, a UK limited liability partnership, is a subsidiary of KPMG Europe LLP and operates from 22 offices across the UK with over 12,000 partners and staff. The UK firm recorded a turnover of £1.8 billion in the year ended September 2012. KPMG is a global network of professional firms providing Audit, Tax, and Advisory services. We operate in 156 countries and have 152,000 professionals working in member firms around the world. The independent member firms of the KPMG network are affiliated with KPMG International Cooperative (“KPMG International”), a Swiss entity. KPMG International provides no client services. The REC is the professional body representing the UK’s £24.6 billion private recruitment and staffingindustrywithmorethan8,000recruitment agencies and 6,000 recruitment consultants in membership. There are over 1 million temporary workers registered with UK agencies who are deployed in industry, commerce and the public services every day. is a leading global diversified provider of financial information services. We provide productsthatenhancetransparency,reduceriskandimproveoperational efficiency. Our customers include banks, hedge funds, asset managers, central banks, regulators, auditors, fund administrators and insurance companies. Founded in 2003, we employ over 3,000 people in 11 countries. For more information, please see www.markit.com. Recruitment Industry Survey The monthly survey features original research data collected via questionnaire by Markit from a panel of 400 UK recruitment and employment consultancies. In 2010/11, some 1,049,333 people were employed in either temporary or contract work through consultancies and 604,193 people were placed in permanent positions through consultancies. Monthly survey data were first collected in October 1997 and are collected in the end of each month, with respondents asked to specify the direction of change in a number of survey variables. Markit do not revise underlying survey data after first publication, but seasonal adjustment factors may be revised from time to time as appropriate which will affect the seasonally adjusted data series. The intellectual property rights to these data are owned by or licensed to MarkitEconomicsLimited.Anyunauthoriseduse,includingbutnotlimitedto copying, distributing, transmitting or otherwise of any data appearing is not permitted without Markit’s prior consent. The publication or release of any of these data prior to the general release time is an infringement of Markit Economics Limited’s intellectual property rights. Markit shall not have any liability, duty or obligation for or relating to the content or information (“data”) contained herein, any errors, inaccuracies, omissions or delays in the data, or for any actions taken in reliance thereon. In no event shall Markit be liable for any special, incidental, or consequential damages, arising out of the use of the data. Purchasing Managers’ Index® and PMI® are either registered trade marks of Markit Economics Limited or licensed to Markit Economics Limited. Markit is a registered trade mark of Markit Group Limited. Strong employment growth pushes jobless rate down to 6.6% UK unemployment continues to fall sharply amid yet another bout of record hiring, bringing the jobless total to its lowest since the start of 2009. The latest figures from the Office for National Statistics showed that the rate of unemployment fell from 7.2% in the three months to January to 6.6% in the February to April period, its lowest since January 2009. The number of people claiming unemployment benefit also decreased in May, down by 27,400 to the lowest since October 2008. The number of people in employment meanwhile shot up by 345,000 in the three months to April, the largest jump seen since data were first available in 1971. Contrasting with prior months, the latest rise was driven by companies taking on staff, rather than an increase in self- employment. All Intellectual Property Rights owned by Markit Economics Limited Source: ONS. Unemployment indicators 4.5 5.0 5.5 6.0 6.5 7.0 7.5 8.0 8.5 2005 2006 2007 2008 2009 2010 2011 2012 2013 2014 700 900 1100 1300 1500 1700 Unemployment rate Claimant Count UK unemployment rate (% ) Claimant count ('000)