SlideShare una empresa de Scribd logo
1 de 58
Descargar para leer sin conexión
Swedbank – Interim report January-June 2013 Page 1 of 58
Second quarter 2013
Compared with first quarter 2013
 The result for the quarter amounted to SEK 1 592m (3 525), of which the
result for continuing operations** was SEK 3 478m (3 916)
 Earnings per share for total operations amounted to SEK 1.45 (3.21*)
before dilution and SEK 1.44 (3.19*) after dilution
 Earnings per share for continuing operations** after dilution amounted to
SEK 3.15 (3.54*)
 The return on equity was 6.5 per cent (13.8) and the return on equity for
continuing operations** was 14.1 per cent (15.3)
 The cost/income ratio was 0.46 (0.45)
 Net interest income amounted to SEK 5 409m (5 353)
 Profit before impairments decreased by 4 per cent to SEK 4 853m (5 039)
 Swedbank reported net credit impairments of SEK 88m (60)
 The Common Equity Tier 1 ratio was 18.0 per cent according to Basel 2
(16.7 per cent on 31 December 2012). The Common Equity Tier 1 ratio
according to Basel 3 was 17.2*** per cent (15.4 per cent on 31 December
2012).
January-June 2013
Compared with January-June 2012
 The result for the period amounted to SEK 5 117m (6 557), of which the
result for continuing operations** was SEK 7 394m (7 177)
 Earnings per share for total operations amounted to SEK 4.66* (5.97)
before dilution and SEK 4.63* (5.95) after dilution
 Earnings per share for continuing operations** after dilution amounted to
SEK 6.69* (6.51)
 The return on equity was 10.1 per cent (13.6) and the return on equity for
continuing operations** was 14.7 per cent (14.9)
 The cost/income ratio was 0.45 (0.48)
 Net interest income increased by 8 per cent to SEK 10 762m (9 930)
 Profit before impairments increased by 6 per cent to SEK 9 892m (9 362)
 Swedbank reported net credit impairments of SEK 148m (net recoveries of
SEK 145m)
* After deducting the preference share dividend, earnings per share for the first quarter 2013 were
SEK 1.63 for total operations. The calculations are specified on page 50.
** Russia and Ukraine are reported as discontinued operations.
*** According to Swedbank’s interpretation of future regulations.
0
500
1 000
1 500
2 000
2 500
3 000
3 500
4 000
4 500
5 000
Q2-
2012
Q3-
2012
Q4-
2012
Q1-
2013
Q2-
2013
SEKm
Profit for the quarter
0,0
0,5
1,0
1,5
2,0
2,5
3,0
3,5
4,0
4,5
5,0
Q2-
2012
Q3-
2012
Q4-
2012
Q1-
2013
Q2-
2013
SEK
Earnings per share after dilution*,
continuing operations**
0,0
2,0
4,0
6,0
8,0
10,0
12,0
14,0
16,0
18,0
20,0
Q2-
2012
Q3-
2012
Q4-
2012
Q1-
2013
Q2-
2013
%
Return on equity, continuing
operations**
12,0
13,0
14,0
15,0
16,0
17,0
18,0
Q2-
2012
Q3-
2012
Q4-
2012
Q1-
2013
Q2-
2013
%
Common Equity Tier 1 ratio, %,
Basel 3 ***
Swedbank – Interim report January-June 2013 Page 2 of 58
CEO Comment
Cautiously positive economic development at the start
of the year in large parts of the world continued during
the second quarter. Several central banks have begun
to announce that they are nearing the point when they
will gradually scale back their stimulus measures, which
has periodically led to increased volatility in the financial
markets.
Stable result
Swedbank continued to report a stable result. The return
on equity for continuing operations was 14 per cent for
the second quarter. Net interest income rose slightly,
mainly as a result of stronger net interest income from
corporate lending. Margins on new mortgages in
Sweden continued to fall during the second quarter and
had a slightly negative impact on net interest income. At
the same time we have gradually increased our share of
new lending during the year. Deposit margins were
stable due to unchanged short-term market interest
rates. In the Baltic countries we are continuing to
actively reassess our loan pricing to better reflect risk as
well as capital and return. Strong business activity,
especially as regards LC&I’s financing solutions,
contributed to improved net commission income.
Repurchases of outstanding government guaranteed
bonds and rising long-term interest rates produced
negative valuation effects. Expenses were stable. I see
cost efficiencies as an increasingly important long-term
competitive factor that at the same time facilitate future
investments. The second quarter result was negatively
affected by larger than usual writedowns within Ektornet
as well as IT writedowns.
In May we finalised the sale of the Ukrainian subsidiary.
As previously announced, the earnings impact was SEK
-1.9bn within discontinued operations and does not
affect the bank's equity, since a corresponding positive
amount is recognised in other comprehensive income.
The Board of Directors will not take this into account in
its dividend proposal for 2013.
Focus on business
It is gratifying to see the LC&I business area further
strengthen its position. Our strategy of sector teams,
with focus on selected customers for whom the bank is
most appropriate, has led to improved growth and
profitability. The customer-driven portion of trading
operations has gradually grown in recent years, which
has meant more stable revenue. Increased activity in
corporate advice during the second quarter largely
offset a lower result in fixed income and currency
trading.
Our customers increasingly use digital channels, which
over time will entail a new relationship with the bank.
This confirms that we have made the right decision to
gradually increase investments in these channels. We
will continue to simplify and improve the digital channels
with the goal that our customers will choose them for
practically all their daily transactions. This will free up
more time for proactive customer contacts and qualified
advice at the branches. At the same time the advice we
provide in our digital channels will be improved and
become more proactive. The goal is to create a better,
more personal experience for every customer, at the
same time that we become more efficient. A recent
example is the option to trade mutual funds through the
Mobile Bank, which was introduced in June. On the very
first trading day 13 per cent of fund purchases and 8 per
cent of sales were made through the Mobile Bank. With
the reorganisation of the Retail business area at the
beginning of the year, when the Channel & Concepts
unit was established, we have taken another step in this
direction.
Continued focus on capital
Swedbank’s capitalisation was further strengthened
during the second quarter. The Common Equity Tier 1
capital ratio is now 17.2 per cent (Basel 3*). We are
awaiting approval from the Swedish Financial
Supervisory Authority to use an advanced model to
calculate risk weights for our Swedish corporate lending,
which will further strengthen the Common Equity Tier 1
capital ratio.
The Board of Directors has not yet decided on the
bank’s capital objectives, since several new regulations
that will affect them have not been finalised. Based on
the Swedish Financial Supervisory Authority’s final
proposal on mortgage risk weights, Swedbank’s
executive management today believes that the Common
Equity Tier 1 capital ratio needs to be around 15 per
cent according to Basel 3*.
Swedbank has continued to reduce its risks in the last
year, as confirmed by our new scenario-based stress
tests for 2013. The stress test in the Riksbank’s most
recent stability report also underscored Swedbank’s low
risks.
On 4 June the credit rating agency Moody’s raised
Swedbank’s long-term rating from A2 to A1. We are
working actively for further recognition of the extensive
risk reduction Swedbank has made and expect over
time that this will continue to positively affect our ratings.
Relative funding costs will continue to decline and will
be a sustainable competitive advantage for the bank.
On 9 July Latvia received final approval to adopt the
euro on 1 January 2014, which demonstrates how well it
has managed the crisis. For Swedbank it also means a
reduction in currency risks.
Outlook
We continue to plan for an environment with low interest
rates and weak credit demand, even though there are
positive signs in the markets. Our intent is to maintain
total expenses at the same level in 2013 as in 2012. We
continue to focus on profitability and capital efficiency at
the same time that we invest in a better customer
experience and development opportunities for our
employees.
Michael Wolf
President and CEO
* According to Swedbank’s interpretation of future regulations.
Swedbank – Interim report January-June 2013 Page 3 of 58
Table of contents
Page
Financial summary 4
Overview 5
Market 5
Important events during the quarter 5
Second quarter 2013 compared with first quarter 2013 5
Results 5
January-June 2013 compared with January-June 2012 6
Results 6
Credit and asset quality 7
Stress test – Internal Capital Adequacy Assessment Process (ICAAP) for 2013 8
Funding and liquidity 8
Ratings 9
Capital and capital adequacy 9
Market risk 11
Operational risks 11
Other events 11
Events after 30 June 2013 11
Business areas
Retail 12
Large Corporates & Institutions 14
Baltic Banking 16
Group Functions & Other 18
Eliminations 20
Product areas 21
Financial information
Group
Income statement, condensed 26
Statement of comprehensive income, condensed 27
Key ratios 27
Balance sheet, condensed 28
Statement of changes in equity, condensed 29
Cash flow statement, condensed 30
Notes 30
Parent company 53
Signatures of the Board of Directors and the President 57
Review report 57
Contact information 58
More detailed information can be found in Swedbank’s fact book, www.swedbank.com/ir, under Financial information and
publications.
Swedbank – Interim report January-June 2013 Page 4 of 58
Financial summary
Income statement Q2 Q1 Q2 Jan-Jun Jan-Jun
SEKm 2013 2013 % 2012 % 2013 2012 %
Net interest income 5 409 5 353 1 5 035 7 10 762 9 930 8
Net commissions 2 525 2 388 6 2 339 8 4 913 4 737 4
Net gains and losses on financial items at fair value 296 557 -47 577 -49 853 1 556 -45
Other income 749 784 -4 837 -11 1 533 1 637 -6
Total income 8 979 9 082 -1 8 788 2 18 061 17 860 1
Staff costs 2 391 2 358 1 2 336 2 4 749 4 745 0
Other expenses 1 735 1 685 3 1 835 -5 3 420 3 753 -9
Total expenses 4 126 4 043 2 4 171 -1 8 169 8 498 -4
Profit before impairments 4 853 5 039 -4 4 617 5 9 892 9 362 6
Impairment of intangible assets 170 0 4 170 4
Impairment of tangible assets 202 85 124 63 287 164 75
Credit impairments 88 60 47 -49 148 -145
Operating profit 4 393 4 894 -10 4 538 -3 9 287 9 339 -1
Tax expense 913 976 -6 1 047 -13 1 889 2 155 -12
Profit for the period from continuing operations 3 480 3 918 -11 3 491 0 7 398 7 184 3
Profit for the period from discontinued operations, after tax -1 887 -390 -341 -2 277 -620
Profit for the period 1 593 3 528 -55 3 150 -49 5 121 6 564 -22
Profit for the period attributable to the shareholders of
Swedbank AB 1 592 3 525 -55 3 147 -49 5 117 6 557 -22
Q2 Q1 Q2 Jan-Jun Jan-Jun
Key ratios and data per share 2013 2013 2012 2013 2012
Return on equity, continuing operations, % 14.1 15.3 14.6 14.7 14.9
Return on equity, total operations, % 6.5 13.8 13.2 10.1 13.6
Earnings per share before dilution,
continuing operations, SEK 1)
3.16 3.57 3.17 6.73 6.53
Earnings per share after dilution,
continuing operations, SEK 1)
3.15 3.54 3.16 6.69 6.51
Cost/income ratio 0.46 0.45 0.47 0.45 0.48
Equity per share, SEK 1)
89.44 84.57 85.18 89.44 85.18
Loan/deposit ratio, % 186 188 216 186 216
Common Equity Tier 1 ratio, %, Basel 3 2)
17.2 16.4 15.1 17.2 15.1
Tier 1 capital ratio, %, Basel 3 2)
18.6 17.8 16.6 18.6 16.6
Capital adequacy ratio, %, Basel 3 2)
19.6 19.4 18.5 19.6 18.5
Common Equity Tier 1 ratio, %, Basel 2 18.0 17.3 16.2 18.0 16.2
Tier 1 capital ratio, %, Basel 2 19.0 18.3 17.8 19.0 17.8
Capital adequacy ratio, %, Basel 2 19.5 19.5 19.0 19.5 19.0
Credit impairment ratio, % 0.03 0.02 -0.01 0.02 -0.02
Share of impaired loans, gross, % 0.76 0.77 1.53 0.76 1.53
Total provision ratio for impaired loans, % 54 57 64 54 64
Balance sheet data 30 Jun 31 Dec 30 Jun
SEKbn 2013 2012 % 2012 %
Loans to the public 1 246 1 239 1 1 228 1
Deposits and borrowings from the public 673 580 16 560 20
Shareholders' equity 101 103 -2 96 5
Total assets 1 883 1 847 2 1 834 3
Risk weighted assets, Basel 3 2)
459 487 -6 508 -10
Risk weighted assets, Basel 2 455 464 -2 485 -6
1)
After deducting the preference share dividend, earnings per share for the first quarter 2013 were SEK 1.63 for total operations (SEK 1.99 for continuing
operations) after dilution. The calculations are specified on page 50.
2)
According to Swedbank’s interpretation of future regulations.
The key ratios are based on profit and shareholders’ equity allocated to shareholders of Swedbank.
Swedbank – Interim report January-June 2013 Page 5 of 58
Overview
Market
The Swedish economy grew more than expected during
the first quarter. GDP rose by 1.7 per cent at an annual
rate, compared with a decline of slightly over 1 per cent
for the EMU countries as a whole. Sweden’s growth was
driven by rising inventories and increased private
consumption. Investment fell at the same time that
exports were hampered by weak demand and a
relatively strong krona. It will probably take time before
investment picks up. The strong krona and growing
domestic competition contributed to negative inflation in
April and May, which strengthens household purchasing
power. Unemployment rose during the first months of
the year due to an increased labour supply. However,
on the positive side, the number of people employed
continues to rise, indicating a recovery in the Swedish
economy.
Growth in the Baltic economies slowed during the first
quarter, especially in Estonia, which faced weak
external demand. GDP rose by 3.6 per cent in Latvia,
3.5 per cent in Lithuania, and 1.1 per cent in Estonia
compared with the previous year. Private consumption
accounts for a growing share of growth, while
businesses are putting off investing.
Signals that the US Federal Reserve may taper its bond
buying during the second quarter, along with weaker
Chinese growth, led to increased volatility in the global
financial markets, which weakened the Swedish krona
during the spring and summer months at the same time
that bond yields rose. The Riksbank maintained the
repo rate at 1 per cent at its recent monetary policy
meetings in April and July.
The Stockholm stock exchange (OMXSPI) gained 5 per
cent during the first half-year. The Tallinn stock
exchange (OMXTGI) rose by 11 per cent, the Vilnius
stock exchange (OMXVGI) by 14 per cent and the Riga
stock exchange (OMXRGI) by 10 per cent.
Important events during the quarter
In early May Swedbank completed the sale of its
Ukrainian subsidiary. As previously announced, the sale
generated a cumulative negative exchange rate
difference of SEK 1 875m, which was reclassified to the
income statement during the second quarter. These and
the remaining Russian operations are recognised as
discontinued operations. The reclassification does not
affect Swedbank’s capital, capitalisation or cash flow
and will be excluded from the Board of Directors’
dividend proposal for 2013, and when calculating
variable remuneration. For more information, see
page 9.
In June Moody’s Investor Service upgraded Swedbank’s
long-term credit rating from A2 to A1 with a stable
outlook. For more information, see page 9.
Swedbank announced a tender offer to the holders of
outstanding government guaranteed bonds.
Government guaranteed debt amounted to SEK 8bn on
30 June. For more information, see page 9.
Second quarter 2013
Compared with first quarter 2013
Result
Profit before impairments decreased by 4 per cent to
SEK 4 853m (5 039). Profit for Retail and Group
Treasury in Group Functions & Other decreased, while
Baltic Banking accounted for the largest increase.
Profit before
impairments
by business area Q2 Q1 Q2
SEKm 2013 2013 2012
Retail 2 914 2 971 2 941
Large Corporates &
Institutions 1 092 1 078 828
Baltic Banking 785 700 823
Group Functions & Other 62 293 -18
Total excl FX effects 4 853 5 042 4 574
FX effects -3 43
Total 4 853 5 039 4 617
The second quarter result amounted to SEK 1 592m
(3 525) and the result for continuing operations was
SEK 3 478m (3 916). The result for discontinued
operations was SEK -1 887m (-390), of which SEK
1 875m is a cumulative negative exchange rate
difference that was reclassified to the income statement
in connection with the sale of the Ukrainian operations
(due to the depreciation of the Ukrainian hryvnia against
the Swedish krona). When the cumulative exchange
rate difference arose, mainly between 2007 and 2009, it
directly affected equity through other comprehensive
income. Consequently, the reclassification does not
affect Swedbank’s capital, capitalisation or cash flow
and will not be taken into account when the Board of
Directors announces its dividend proposal for 2013.
Credit impairments amounted to SEK 88m (60).
Tangible asset writedowns amounted to SEK 202m
(85), of which SEK 200m related to Ektornet’s
properties. Intangible asset writedowns of SEK 170m (0)
related to IT systems within Swedbank Finance AB and
LC&I. The return on equity was 6.5 per cent (13.8). For
the continuing operations the return on equity was 14.1
per cent (15.3). The cost/income ratio was 0.46 (0.45).
Income decreased by 1 per cent to SEK 8 979m
(9 082). Net interest income was stable, while net gains
and losses on financial items at fair value decreased.
Net commission income increased during the quarter.
Net interest income was stable at SEK 5 409m (5 353).
Net interest income was slightly higher for Retail and
Baltic Banking, but rose more for LC&I, mainly due to
increased volumes and margins. Group Treasury’s net
interest income has decreased as earlier positions have
matured. Stibor and Euribor rates were unchanged
during the quarter and the previous pressure on deposit
margins in Retail and Baltic Banking ended. The
repricing of corporate lending continued within LC&I
during the second quarter, but at a slightly slower pace,
at the same time that new business generated higher
margins. The margin on new mortgages continued to
decline, while the stock margin declined slightly. A
stability fee refund had a positive effect of SEK 37m.
Net commission income increased by 6 per cent to SEK
2 525m (2 388), mainly due to increased activity in
financing solutions and corporate finance as well as
Swedbank – Interim report January-June 2013 Page 6 of 58
higher income from card operations. Asset management
also contributed positively, as a result of higher average
assets under management following a rise in share
prices and positive net flows, while income from
brokerage services and other securities decreased. The
outsourcing of Retail’s ATMs has reduced payment
commissions and expenses. For more information, see
page 13.
Net gains and losses on financial items at fair value fell
by 47 per cent to SEK 296m (557). The tender offer to
repurchase government guaranteed bonds negatively
affected net gains and losses on financial items at fair
value by SEK 107m and other repurchases by SEK
103m. Trading-related income within LC&I was lower
than in the previous quarter.
Expenses increased by 2 per cent from the previous
quarter to SEK 4 126m (4 043,) mainly due to higher
expenses for IT, consultants and personnel.
Expense analysis
Group Q2 Q1 Q2
SEKm 2013 2013 2012
Retail 2 398 2 406 2 411
Large Corporates &
Institutions 834 733 754
Baltic Banking 593 589 571
Group Functions & Other
and Eliminations 301 318 402
Total excl FX effects 4 126 4 046 4 138
FX effects -3 33
Total expenses 4 126 4 043 4 171
The number of full-time positions decreased during the
quarter by 62, to 14 351, of which 89 relate to Baltic
Banking and 57 relate to Ektornet. Retail increased by
49.
Credit impairments amounted to SEK 88m (60). LC&I
and Retail reported credit impairments, while Baltic
Banking reported slightly lower net recoveries than in
the first quarter.
Tangible asset writedowns amounted to SEK 202m
(85), of which SEK 200m related to Ektornet’s property
holdings. Intangible asset writedowns amounted to SEK
170m and related to IT systems within Swedbank
Finance AB and LC&I.
The result from discontinued operations (Ukraine and
Russia) amounted to SEK -1 887m (-390). The sale of
the Ukrainian operations was finalised during the
quarter, at which point a cumulative negative exchange
rate difference of SEK 1 875m (due to the depreciation
of the Ukrainian hryvnia against the Swedish krona) was
reclassified from other comprehensive income to the
income statement. The reclassification does not affect
Swedbank’s capital, capitalisation or cash flow and will
not be taken into account when the Board of Directors
announces its dividend proposal for 2013, and when
calculating variable remuneration.
The tax expense amounted to SEK 913m (976),
corresponding to an effective tax rate of 20.8 per cent
(19.9). The higher effective rate during the quarter
compared with the first quarter was due to a non-
deductible property writedown of SEK 200m by
Ektornet. No deferred tax assets were booked in
connection with the writedown, since it is doubtful
whether these deficits can be offset against future
income.
January-June 2013
Compared with January-June 2012
Result
Profit before impairments increased by 6 per cent to
SEK 9 892m (9 362). The first quarter 2012 was
negatively affected by SEK 250m by a one-off
adjustment within Group Treasury. Stronger net interest
income and lower expenses affected profit positively,
while net gains and losses on financial items at fair
value were lower than in the same period in 2012.
Profit before
impairments
by business area Jan-Jun Jan-Jun ∆
SEKm 2013 2012 SEKm
Retail 5 885 5 858 27
Large Corporates &
Institutions 2 172 2 126 46
Baltic Banking 1 480 1 634 -154
Group Functions & Other 355 -334 689
Total excl FX effects 9 892 9 284 608
FX effects 78 -78
Total 9 892 9 362 530
The result for the period decreased by 22 per cent to
SEK 5 117m (6 557), of which the result for continuing
operations was SEK 7 394m (7 177). The result for
discontinued operations was SEK -2 277m (-620), of
which SEK 1 875m is a cumulative negative exchange
rate difference that was reclassified to the income
statement in connection with the sale of the Ukrainian
operations (due to the depreciation of the Ukrainian
hryvnia against the Swedish krona). Credit impairments
amounted to SEK 148m (net recoveries of 145), tangible
asset writedowns to SEK 287m (164) and intangible
asset writedowns to SEK 170m (4). Fluctuations in
exchange rates, primarily the strengthening of the
Swedish krona against the euro and the Baltic
currencies, decreased profit by SEK 69m. The return on
equity was 10.1 per cent (13.6). The return on equity for
continuing operations was 14.7 per cent (14.9). The
cost/income ratio was 0.45 (0.48).
Income increased slightly to SEK 18 061m (17 860).
Income in Retail and LC&I was stable compared with
the previous year. Baltic Banking reported lower
income, mainly due to falling market interest rates.
Income in LC&I decreased from fixed income and
currency trading. Group Treasury reported higher
income year-on-year. Fluctuations in exchange rates
reduced income by SEK 141m.
Net interest income increased by 8 per cent to SEK
10 762m (9 930). The repricing of corporate lending
within Retail and LC&I affected net interest income
positively. Treasury’s net interest income has been
temporarily strengthened by positions that have
benefitted from falling market interest rates. The fee for
government guaranteed funding decreased by SEK
133m. Lower deposit margins due to falling Stibor and
Euribor rates as well as increased competition for
deposits in Sweden negatively affected net interest
income. Fluctuations in exchange rates reduced net
interest income by SEK 77m.
Swedbank – Interim report January-June 2013 Page 7 of 58
Net commission income improved to SEK 4 913m
(4 737). Higher commission income from asset
management owing to increased assets under
management, higher income from card operations and
greater activity in financing solutions positively affected
net commission income, while corporate finance income
was lower. The outsourcing of ATMs by Retail has
reduced payment commissions and expenses. For more
information, see page 13.
Net gains and losses on financial items at fair value
decreased by 45 per cent to SEK 853m (1 556). The
first quarter 2012 was negatively affected by SEK 250m
by a one-off adjustment within Group Treasury. The
tender offer during the second quarter 2013 to
repurchase government guaranteed bonds negatively
affected net gains and losses on financial items at fair
value by SEK 107m and other repurchases by SEK
103m. The results from equity, fixed income and
currency trading were lower than in the same period in
2012, when the first-quarter results were very strong
due to favourable market conditions.
Expenses decreased by 4 per cent to SEK 8 169m
(8 498). The largest decrease was in depreciation and
amortisation, mainly from a reclassification within
Swedbank Finance AB (Group Functions & Other),
which at the same time reduced net interest income.
Moreover, depreciations decreased as a result of lower
depreciation in Ektornet. Expenses for transports and
security fell by SEK 59m, IT expenses by SEK 44m and
fixed staff costs by SEK 56m. Variable staff costs rose
to SEK 457m (397), mainly because a new share-based
programme for 2013 was added to the accruals of
previous share-based programmes for 2010, 2011 and
2012. Changes in exchange rates reduced expenses by
SEK 63m.
Expense analysis
Group Jan-Jun Jan-Jun ∆
SEKm 2013 2012 SEKm
Retail 4 804 4 840 -36
Large Corporates & Institutions 1 568 1 515 53
Baltic Banking 1 179 1 177 2
Group Functions & Other
and Eliminations 618 903 -285
Total excl FX effects 8 169 8 435 -266
FX effects 63 -63
Total expenses 8 169 8 498 -329
The number of full-time positions has decreased in one
year by 1 337, of which 808 were in Ukraine and
Russia, 50 in Retail and 370 in Ektornet (Group
Functions & Other).
Since 1 July 2010 Swedbank pays parts of its variable
remuneration in the form of shares. This remuneration is
accrued as an expense until the shares are settled. As a
result variable remuneration allocated to employees
during the period differs from the recognised amount. A
more detailed analysis of variable remuneration is
provided on page 14 of the fact book
1
.
Credit impairments of SEK 148m were recognised in the
first half-year 2013 (net recoveries of SEK 145m). LC&I
and Retail reported credit impairments, while Baltic
Banking reported net recoveries.
1
More detailed information can be found in Swedbank’s fact book,
www.swedbank.com/ir, under Financial information and publications.
Tangible asset writedowns rose by SEK 123m to SEK
287m, of which SEK 281m related to Ektornet.
Intangible asset writedowns amounted to SEK 170m (4)
and mainly related to a writedown of IT systems within
Swedbank Finance AB and LC&I.
The result from discontinued operations (Ukraine and
Russia) amounted to SEK -2 277m (-620), of which SEK
2 236m related to the sale of the Ukrainian operations.
For more information, see note 24.
The tax expense amounted to SEK 1 889m (2 155),
corresponding to an effective tax rate of 20.3 per cent
(23.1). The lower effective tax rate in 2013 was mainly
due to the reduction of the Swedish corporate tax rate
as of 1 January 2013.
Credit and asset quality
Despite weak economic development in the eurozone,
there are no signs of problems in the bank’s credit
portfolios. Credit impairments remain low and impaired
loans are gradually decreasing. The economic situation
in Swedbank’s home markets has been stronger than in
the rest of Europe. In the Baltic countries economic
conditions have stabilised. In Sweden the situation is
stable, although a slight increase in bankruptcies is
evident among small businesses. This has not led to an
increase in credit impairments in Swedbank’s portfolio,
however.
Swedbank’s lending increased during the first half-year
by SEK 9.2bn, where SEK 2.2bn is attributable to
currency effects. Lending to Swedish mortgage
customers (including tenant-owner associations) rose by
SEK 6.5bn. Corporate lending within LC&I and Retail
increased by SEK 4.0bn. The lending portfolio in Baltic
Banking rose slightly in local currency, mainly due to a
few large corporate customers with low risk. In Estonia
loan demand increased during the first half-year,
including from private customers. In Latvia amortisations
still exceed new lending, which is why the portfolio has
shrunk slightly. The discontinuation of the operations in
Russia and Ukraine has reduced lending volume by
SEK 4.2bn.
The average loan-to-value ratio of Swedbank’s
mortgages in Sweden was 62.7 per cent (63.5) as of 30
June, based on property level. The average loan-to-
value ratio for new mortgages in Sweden is 69.0 per
cent in 2013. House prices in major Baltic cities have
stabilised, with a clear rise in Estonia. Baltic Banking’s
new lending has an average loan-to-value ratio of about
70 per cent.
Impaired loans fell by SEK 4bn during the first half-year
to SEK 10bn, with the discontinued operations in Russia
and Ukraine accounting for SEK 3bn of the decrease. In
Baltic Banking impaired loans fell by SEK 1.6bn, mainly
due to write-offs and improved quality in the loan
portfolio. Impaired loans within LC&I increased by SEK
0.9bn related to a few large commitments, while in
Retail they decreased by SEK 0.2bn during the period.
Impaired loans to private customers decreased during
the first half-year. The share of Swedish mortgages past
due by more than 60 days is stable at 0.12 per cent of
the portfolio (0.13). The share of impaired loans in Baltic
Banking has fallen, with the largest decrease in Latvia.
The share of mortgages past due by more than 60 days
was 1.0 per cent in Estonia (1.1), 9.8 per cent in Latvia
(10.5) and 5.2 per cent in Lithuania (5.4). Further
Swedbank – Interim report January-June 2013 Page 8 of 58
improvements are expected during the second half of
2013.
Credit impairments, net
by business area Q2 Q1 Q2
SEKm 2013 2013 2012
Retail 37 55 102
Large Corporates &
Institutions 94 74 53
Baltic Banking -43 -70 -204
Estonia -36 -54 -25
Latvia 18 4 -197
Lithuania -25 -20 18
Group Functions & Other 0 1 0
Total 88 60 -49
Credit impairments for the first half-year amounted to
SEK 148m (recoveries of SEK 145m). Credit
impairments within Retail and LC&I remain low and are
related to a few corporate commitments. The recoveries
in the Baltic countries primarily relate to a limited
number of corporate commitments.
The value of repossessed assets in the Group fell by
SEK 1.4bn to SEK 3.7bn during the first half-year, of
which SEK 200m related to a property writedown by
Ektornet during the second quarter. Ektornet acquired
properties for SEK 180m mainly in Ukraine. Properties
with a book value of SEK 1 501m were sold during the
first half-year. For more information on Ektornet, see
page 19.
Swedbank’s exposure to counterparties in the GIIPS
countries (Greece, Ireland, Italy, Portugal and Spain)
remains low. The exposures totalled SEK 251m as of 30
June 2013 (401).
GIIPS exposure
30 Jun 2013
SEKm Greece Ireland Italy Portugal Spain Total
Bonds 0 85 27 5 117
of which sovereign 0 85 27 5 117
of which held to maturity1
0 85 27 5 117
Loans (money market
and commercial paper) 9 5 14
Loans (credit facilities)
Derivatives net2
7 7 71 85
Other3
0 0 24 2 9 35
Total 0 7 125 34 85 251
2
Derivatives at market value taking into account netting and collateral agreements.
The derivatives gross value i.e. market value plus internal add-ons, amounts to:
Ireland SEK 10m, Italy SEK 374m and Spain SEK 203m. Total SEK 588m.
3
Includes funds, trade finance and mortgage loans.
1
Current market values are approximately SEK 9m below the carrying amounts.
Stress test – Internal Capital Adequacy
Assessment Process 2013
Swedbank has worked actively to reduce risk on its
balance sheet since 2009. As a result of this and the
more normalised macroeconomic climate, the Internal
Capital Adequacy Assessment Process (ICAAP) for
2013 shows Swedbank has limited risks. The bank is
well capitalised for the effects of a potentially negative
scenario, even when taking into account future
regulatory changes.
A recession scenario extending over five years was
selected as the main scenario in the 2013 ICAAP. The
five-year macro scenario shows negative growth for
three consecutive years and high unemployment
throughout the scenario period in Sweden and the Baltic
countries. Confidence in politicians and the market is
low, leading to a weaker euro and protracted recession,
where the strong krona prevents Sweden from pulling
itself out of the crisis through increased exports. The
Baltic economies and export industry experience slower
demand.
In this scenario net interest income falls by 15 per cent
to end 2015 before rising in the last two years. Total
credit impairments amount to SEK 31.6bn, where LC&I
and Retail together account for 76 per cent of the
losses.
Swedbank has incorporated future regulatory changes
into this year's ICAAP. The changes include the pending
Basel 3/CRD IV rules and revisions to the reporting
standard for pensions (IAS 19). During the first year
future regulations would impact the Common Equity Tier
1 ratio by nearly 2 percentage points. In the results of
the stress test, Swedbank’s Common Equity Tier 1 ratio
is strengthened throughout the scenario period. The
scenario results do not take into account measures
taken by Swedbank’s executive management. If the
executive management’s expected measures are
included in the stress scenario, the Common Equity Tier
1 ratio would be even stronger.
The Baltic countries today have a significantly better
macroeconomic balance and resilience compared with a
few years ago. The work done in 2009-2012 to improve
credit quality in the lending portfolios and strengthen the
capital base in the Baltic subsidiaries has made them
more resilient, as also evident in the 2013 ICAAP. This
is also evident in the years with the highest stress level.
Swedbank’s resilience in a stress scenario is confirmed
by the Riksbank’s most recent stability report, where
Swedbank is the only one of the four major Swedish
banks with a positive result throughout the scenario
period and where its Common Equity Tier 1 ratio does
not decrease.
For more information on Swedbank’s scenario
simulation and its outcome, see pages 56-57 of the fact
book.
Funding and liquidity
During the first half-year Swedbank issued a total of
SEK 68bn in long-term debt instruments, of which SEK
46bn was covered bonds and SEK 20bn was senior
debt. Issuance during the second quarter amounted to
SEK 29bn, of which covered bonds accounted for SEK
23bn and senior debt for SEK 5bn. The bank saw
continued high demand for private placements during
the first half-year. In total Swedbank plans to issue
around SEK 120bn in 2013 to meet maturing long-term
funding with a nominal value of SEK 86bn as of the
beginning of the year. Liquidity in excess of its
refinancing needs will be used to repurchase bonds
maturing in 2014.
The average maturity of all capital market funding
arranged through the bank’s short- and long-term
programmes was 33 months as of 30 June 2013 (31).
The average maturity of long-term funding issued during
the first half-year was 74 months (55). The bank’s short-
term funding is mainly used as a cash management
tool, not to finance lending to the public. Outstanding
volume decreased during the quarter to SEK 134bn
(147).
Swedbank – Interim report January-June 2013 Page 9 of 58
Swedbank completed its last issuance as part of the
government guarantee programme in the summer of
2009 and subsequently left the programme in April
2010. Since then government guaranteed bonds have
filled no purpose in the bank’s funding structure. As part
of its ongoing liquidity management, the bank
announced a tender offer during the second quarter to
repurchase certain series of government guaranteed
bonds. Swedbank repurchased a total of SEK 9bn, or 53
per cent of the volume. After the repurchase, the state-
guaranteed debt as of 30 June 2013 was SEK 8bn.
The repurchase negatively affected net gains and
losses on financial items by SEK 107m during the
second quarter and is expected to positively affect net
interest income by approximately SEK 146m in the next
year. As a whole, this represents savings of about SEK
40m.
Due to the composition of its assets, Swedbank has a
limited structural need for senior funding. The share of
senior funding is mainly determined by the bank’s
liquidity needs and the buffer it wants to maintain in its
cover pool in the form of overcollateralisation in order to
withstand fluctuations in house prices.
Issued long-term debt Q2 Q1
SEKbn 2013 2013
Covered bonds 23 23
of which SEK 14 13
of which EUR 9 1
of which USD 0 7
of which Other 0 2
Senior unsecured bonds 5 15
Structured retail bonds (SPAX) 1 1
Total 29 39
Swedbank’s liquidity reserve, which is reported in
accordance with the Swedish Bankers’ Association’s
definition, amounted to SEK 289bn on 30 June 2013
(300). In addition to the liquidity reserve, liquid securities
in other parts of the Group amounted to SEK 35bn (57).
The liquidity reserve and the Liquidity Coverage Ratio
(LCR) fluctuate over time depending, among other
things, on the maturity structure of the bank’s issued
securities. According to current Swedish regulations in
effect as of 1 January 2013, the Group’s LCR was 129
per cent as of 30 June (139). Distributed by USD and
EUR, LCR was 295 per cent and 207 per cent,
respectively. In early 2013 the Basel Committee
published a new recommendation on the definition of
LCR. According to Swedbank’s interpretation of the new
definition, LCR would have been 166 per cent as of 30
June.
According to Swedbank’s interpretation of the current
draft regulation, the Group’s Net Stable Funding Ratio
(NSFR) was 95 per cent on 30 June (93). The main
liquidity measure used by the Board of Directors and
executive management is the so-called survival horizon,
which shows how long the bank could manage long
periods of stress in capital markets, where access to
new financing would be limited. At present the bank
would survive more than 12 months with the capital
markets completely shut down. This applies to the
Group’s total liquidity as well as liquidity in USD and
EUR.
For more information on Swedbank’s funding and
liquidity (including the survival horizon), see pages
58-72 of the fact book.
Ratings
On 4 June Moody’s Investor Service upgraded
Swedbank’s long-term credit rating to A1 from A2 with a
stable outlook. Moody’s said the upgrade was due to
Swedbank’s improved credit profile as a result of 1) a
sustainable reduction of its risk profile and strengthening
of the bank's corporate governance; 2) the continued
reduction of problem loans and stabilisation of
revenues; and 3) enhanced capital levels and improved
funding profile.
Capital and capital adequacy
The Common Equity Tier 1 ratio according to Basel 3
continued to strengthen during the second quarter 2013
to 17.2 per cent, according to Swedbank’s calculation
based on current knowledge of future regulations (16.4
per cent on 31 March 2013 and 15.4 per cent on 31
December 2012). The new regulations were adopted by
the EU in June and take effect on 1 January 2014. The
Common Equity Tier 1 ratio according to Basel 2 was
18.0 per cent on 30 June (17.3 and 16.7 respectively).
Common Equity Tier 1 capital (Basel 2) increased by
SEK 3.0bn during the second quarter to SEK 81.9bn.
The increase was mainly due to the second quarter
profit, after deducting the anticipated dividend, and
includes a dividend of EUR 75m from Swedbank’s Baltic
life insurance company. The sale of Swedbank’s
Ukrainian operations was finalised in late April, in
connection with which a negative cumulative exchange
rate difference of SEK 1.9bn was reclassified from other
comprehensive income to the result for the period.
Common Equity Tier 1 capital is not affected, and it will
have no bearing on the Board of Directors’ dividend
proposal for 2013.
As of 1 January 2013 new rules have entered into force
on the recognition of pensions (accounting standard IAS
19). The revisions to IAS 19 will continue to create
volatility in the estimated pension liability, which also
affects equity through other comprehensive income.
During the second quarter Common Equity Tier 1 capital
increased by approximately SEK 1.2bn due to rising
discount rates.
Swedbank – Interim report January-June 2013 Page 10 of 58
Change in Common Equity Tier 1 capital 2013, Swedbank
financial companies group
Basel 3
75.2
Basel 3
76.1
Basel 3
79.2
1.2
4.0
-2.6
0.4
Basel 2
77.5
Basel 2
78.9
Basel 2
81.9
40
45
50
55
60
65
70
75
80
85
90
SEKbn
Increase Decrease
* Profit for financial companies group excl reclassification effect due to the
Ukrainian divestment.
Subordinated loans that may be included in the capital
base decreased by SEK 3.3bn mainly due to the
redemption of a EUR 400m subordinated loan at the
end of June.
Risk weighted assets (Basel 2) decreased by about
SEK 2bn during the second quarter to SEK 455bn. The
risk weighted amount for credit risks decreased by
nearly SEK 2bn. Increased exposures, mainly to
customers in Sweden, have raised the risk weighted
amount by SEK 6.8bn, while the sale of Swedbank’s
Ukrainian operations decreased the risk weighted
amount for credit risks by SEK 1.7bn and the reduction
in credit exposures in Russia decreased the risk
weighted amount by SEK 1.2bn. Positive rating
migrations reduced the risk weighted amount by SEK
5.5bn, while exposures with corrected exposure classes
reduced the risk weighted amount by SEK 3.7bn.
Fluctuations in exchange rates, mainly attributable to
the Baltic credit portfolio, increased the risk weighted
amount for credit risks by SEK 4.5bn due to the
depreciation of the Swedish krona against the euro.
The risk weighted amount for market risks was
essentially unchanged as of 30 June compared with 31
March. The sale of Swedbank’s Ukrainian operations
decreased the risk weighted amount for market risks by
SEK 1.2bn, while market risks within Large Corporates
& Institutions increased. The capital requirement for
operational risks in the Ukrainian operations was
removed after the disposal, which reduced the risk
weighted amount for operational risks by SEK 0.6bn.
Change in risk weighted assets 2013, Swedbank financial
companies group
Basel 2
464.3
Basel 2
457.0
Basel 2
455.2
4.5 -4.4
0.5
4.0
-5.5 - 0.1 -0.6
Basel 3
487.1
Basel 3
464.9
Basel 3
459.5
380
400
420
440
460
480
500
SEKbn
Increase Decrease
The reduced Basel 3 effect on the risk weighted amount
compared with 31 March is due to a clarification from
the European Banking Authority (EBA) with regard to
the capital requirement for currency risks.
On 21 May the Swedish Financial Supervisory Authority
(FI) announced its decision to introduce a risk weight
floor of 15 per cent for the Swedish mortgage portfolio,
in accordance with the proposal announced in
November 2012. The floor will be implemented as a
supervisory measure within Pillar 2. Consequently, the
reported capital ratios will not be affected, since these
calculations are made according to the rules for Pillar 1.
Based on an average risk weight in Swedbank’s
Swedish mortgage portfolio of 4.4 per cent as of 30
June according to Pillar 1 and the Swedish Common
Equity Tier 1 capital requirement of 12 per cent (as of
2015), Swedbank, as per FI’s decision, has to maintain
additional Common Equity Tier 1 capital of SEK 9.6bn
for Swedish mortgages, corresponding to 2.1
percentage points of the Common Equity Tier 1 ratio
according to Pillar 1. In its internal controls, Swedbank
has for some time allocated additional capital to its
mortgage business equivalent to the risk weight floor
that has now been announced.
30 Jun 31 Dec 30 Jun
SEKbn 2013 2012 2012
Retail 201 202 214
Large Corporates &
Institutions 133 134 135
Baltic Banking 92 95 98
Estonia 37 38 39
Latvia 29 31 33
Lithuania 26 26 26
Group Functions & Other 29 33 38
Group Products 4 4 3
Treasury 17 15 16
Ektornet 5 6 7
Other 3 8 12
Total risk-weighted assets 455 464 485
Risk-weighted assets by
business area, Basel 2
Swedbank – Interim report January-June 2013 Page 11 of 58
Discussions among regulators and other interested
parties on the harmonisation of risk weights have
intensified in the last quarter. One topic of discussion is
how the leverage ratio can be used to ensure a
minimum capital level in relation to the size of the
balance sheet. When the EU’s new capital adequacy
rules (CRD IV/CRR) take effect on 1 January 2014,
banks will be obligated to report their leverage ratios to
the supervisory authority. Swedbank’s leverage ratio
(according to CRR) was 4.5 per cent on 30 June. The
Basel Committee has recently issued a draft of revised
rules on calculating the leverage ratio. Swedbank’s
leverage ratio would only be marginally affected if the
Basel Committee’s proposal became EU law.
Market risk
The majority of the Group’s market risks are of a
structural or strategic nature and are managed by Group
Treasury. Structural interest rate risks arise when the
maturity of the Group’s assets and liabilities, such as
deposits and lending, do not coincide. These differences
are managed by Group Treasury within given mandates
by matching the maturities directly or through the use of
various derivatives such as interest rate swaps. Net
interest income sensitivity is also affected by the
structural risks in the bank’s deposit operations, where
various products show different sensitivity to changes in
market interest rates.
Strategic currency risks arise primarily through risks tied
to holdings in foreign subsidiaries and their financing.
In Swedbank market risks also arise in LC&I’s trading
operations in connection with customer transactions and
by maintaining a secondary market for various types of
securities.
Swedbank measures market risks with a Value-at-Risk
(VaR) model, among other things. For each portfolio,
VaR expresses a loss level that statistically will be
exceeded by a specific probability during a set time
horizon. Swedbank uses a 99 per cent probability and a
time horizon of one day. This means that the potential
loss for the portfolio, based on historical data, will
exceed VaR on one day of 100.
The table below shows Swedbank’s VaR*) performance
during the year.
VaR by risk category
30 Jun 31 Dec
SEKm Max Min Average 2013 2012
Interest risk 97 (131) 65 (76) 80 (102) 65 71
Currency rate risk 17 (14) 2 (3) 7 (6) 6 5
Stock price risk 9 (14) 2 (4) 5 (8) 4 4
Diversification 0 0 -16 (-21) -16 -14
Total 89 (123) 59 (69) 76 (95) 60 66
Jan-Jun 2013 (2012)
*) VaR here excludes strategic currency rate risks, since a VaR
measurement based on a time horizon of one day is not
relevant.
For individual risk types, VaR is supplemented with risk
measures and limits based on sensitivity to changes in
various market prices. Risk taking is also monitored with
stress tests.
An increase in all market interest rates of one
percentage point would have reduced the Group’s net
gains and losses on financial items at fair value by SEK
783m as of 30 June 2013, compared with a decrease of
SEK 52m as of 31 December 2012.
Operational risks
Swedbank’s measures to stabilise and safeguard IT
operations in the Internet Bank and Telephone Bank
have resulted in fewer disruptions and improved
accessibility. In comparison with the first five months of
2012, the number of major IT-related incidents
decreased by 39 per cent at the same time that the time
it took to address the incidents decreased by 55 per
cent. The long-term work to improve the bank’s IT
infrastructure is continuing according to plan.
In connection with the replacement of old ATMs by new
ones by Bankomat AB, which is jointly owned by
Sweden’s largest banks, accessibility to a number of
ATMs was adversely affected during the first quarter.
During the second quarter accessibility again improved.
External fraud attempts against the bank’s customers
have continued, but through its active efforts the bank
has been able to prevent money from being embezzled.
We are also working to inform our customers about
security improvements.
Operational risks in the Group were also reduced as a
result of the Ukrainian bank sale. Expenses associated
with operational risk events have remained low.
Other events
Peter Borsos, previously head of Communications for
the Swedish operations, succeeds Thomas Backteman
as Group head of Communications on 16 July.
Jonas Erikson, head of Group Treasury, will be part of
the Group Executive Committee as from 16 July.
Gregori Karamouzis, head of Debt IR, will as of 1
September also be responsible for Investor Relations.
Johannes Rudbeck, present head of Investor Relations,
will become CFO of Baltic Banking.
Events after 30 June 2013
In July the European Central Bank and the EU
Commission confirmed that Latvia meets the Maastricht
criteria for euro accession. Latvia will convert to the euro
on 1 January 2014.
Swedbank – Interim report January-June 2013 Page 12 of 58
Retail
 Stable net interest income
 Stable deposit and lending volumes
 Continued improvements to digital services
Income statement
Q2 Q1 Q2 Jan-Jun Jan-Jun
SEKm 2013 2013 % 2012 % 2013 2012 %
Net interest income 3 367 3 332 1 3 362 0 6 699 6 733 -1
Net commissions 1 536 1 589 -3 1 531 0 3 125 3 069 2
Net gains and losses on financial items at fair value 33 34 -3 41 -20 67 85 -21
Share of profit or loss of associates 197 204 -3 209 -6 401 412 -3
Other income 179 218 -18 209 -14 397 399 -1
Total income 5 312 5 377 -1 5 352 -1 10 689 10 698 0
Staff costs 866 871 -1 852 2 1 737 1 725 1
Variable staff costs 68 47 45 42 62 115 76 51
Other expenses 1 434 1 458 -2 1 485 -3 2 892 2 975 -3
Depreciation/amortisation 30 30 0 32 -6 60 64 -6
Total expenses 2 398 2 406 0 2 411 -1 4 804 4 840 -1
Profit before impairments 2 914 2 971 -2 2 941 -1 5 885 5 858 0
Credit impairments 37 55 -33 102 -64 92 123 -25
Operating profit 2 877 2 916 -1 2 839 1 5 793 5 735 1
Tax expense 586 635 -8 733 -20 1 221 1 477 -17
Profit for the period 2 291 2 281 0 2 106 9 4 572 4 258 7
Profit for the period attributable to the shareholders of
Swedbank AB 2 290 2 279 0 2 103 9 4 569 4 251 7
Non-controlling interests 1 2 -50 3 -67 3 7 -57
Return on allocated equity, % 28.1 27.9 26.3 28.0 27.4
Loan/deposit ratio, % 243 246 246 243 246
Credit impairment ratio, % 0.02 0.02 0.04 0.02 0.03
Cost/income ratio 0.45 0.45 0.45 0.45 0.45
Loans, SEKbn 919 915 0 902 2 919 902 2
Deposits, SEKbn 378 371 2 367 3 378 367 3
Full-time employees 4 921 4 872 1 4 971 -1 4 921 4 971 -1
Development January-June
The Swedish economy improved in the spring and early
summer. Order bookings for Swedish manufacturing
rose from both domestic and export markets.
Investment plans are less than ambitious, however, and
point to a continued decline in 2013. Despite a pickup in
the economy, the number of corporate bankruptcies has
risen. Swedish household optimism about their own
finances grew in recent months. Low interest rates,
increased real incomes and rising asset prices are
benefitting Swedish households, but to date have not
accelerated lending, which in March rose by 4.6 per
cent at an annual rate.
Profit for the period amounted to SEK 4 569m,
compared with SEK 4 251m in the first half of 2012.
Both income and expenses were stable and credit
impairments decreased. The result was positively
affected by the lower Swedish corporate tax rate.
Net interest income was stable during the period
compared with the first half of 2012. A stability fee
refund had a positive effect of SEK 31m. The repricing
of corporate credit largely offset the lower deposit
margins, which were adversely affected by declining
market interest rates. Stibor was unchanged during the
second quarter and deposit margins were stable. The
margin on new mortgages fell during the quarter, while
the stock margin declined slightly since the beginning of
the year. The margin on new loans was 10-15bp lower
than the stock margin as of 30 June.
Household deposit volume grew by 0.4 per cent from
the beginning of the year. At the same time fund inflow
increased. Swedbank’s share of household deposits
was 21 per cent (22 per cent as of 31 December 2012).
Retail’s deposits from corporate customers are
unchanged from the beginning of the year. Swedbank’s
market share was 17 per cent as of 31 May (16 per cent
as of 31 December 2012).
Mortgage lending has gradually increased in recent
months, and Swedbank’s share of the net growth was 8
per cent during the period January-May 2013. In May its
share of new sales was 14 per cent. Swedbank’s share
of the total market was unchanged at 26 per cent (26
per cent as of 31 December 2012). Corporate lending
volume has increased by SEK 1bn from the beginning
of the year. The market share was 17 per cent (17).
Risk weighted assets amounted to SEK 201bn, a
decrease of SEK 1bn from the beginning of the year.
Increased exposures were offset by positive rating
migrations and by exposures with revised exposure
classes.
Net commission income increased by 2 per cent
compared with the first half of 2012. The increase was
Swedbank – Interim report January-June 2013 Page 13 of 58
mainly due to higher income in card payment acquiring
and increased activity in Fastighetsbyrån AB (real
estate brokerage), while payment commissions saw the
biggest decrease. As of January 2013 Bankomat AB is
gradually taking over responsibility for Swedbank’s
ATMs. Swedbank pays a commission to Bankomat AB
for this service. As a result, both net payment
commissions and expenses will decrease. During the
second quarter commissions paid to Bankomat AB
amounted to approximately SEK 53m. In 2013
commissions of approximately SEK 300m are expected
to be paid to Bankomat AB, with expenses decreasing
by approximately the same amount. As of 30 June, 78
per cent of ATMs had been replaced. Fund volumes
increased during the first half-year, with the largest
inflow to private banking investment solutions, short-
term fixed income funds and collective occupational
pensions.
Expenses for the first half-year fell by 1 per cent year-
on-year. Following work to reduce manual cash
handling, 277 branches, or 90 per cent of the total
number, have now stopped handling cash, which has
reduced transport and security expenses. Retail now
has 308 branches. Expenses were unchanged during
the second quarter. The cost/income ratio was 0.45
(0.45).
Credit quality has remained good. Credit impairments
decreased during the period, and the inflow of impaired
loans is low. The bank is well prepared for an economic
decline, and its continuous credit analysis contains an
assessment of business cycle impacts. Migrations to
better risk classes continue. The share of impaired
loans was 0.18 per cent (0.19).
Channels & Concepts
Swedbank continues to improve its digital offering and
during the second quarter introduced several new
mobile features, including an OCR bill scanning, new
functionality for savings and investments, and a first
version of a mobile notification system when, for
example, a new e-bill has arrived. In June Swedbank
also launched a service where customers can call for
help to get started with the Mobile Bank.
Use of Swedbank’s digital services has continued to
grow. The Internet Bank now has 3.5 million users ( an
increase of 21 000 in the second quarter), while the
Mobile Bank has 1.3 million (+63 000) and the iPad
Bank has 260 000 (+47 000).
Retail, Swedbank’s dominant business area, is responsible for all Swedish customers except for large corporates and
financial institutions. The bank’s services are offered through our digital channels such as the Telephone Bank, Mobile
Bank and Internet Bank as well as through Swedbank’s own branch network and the savings banks’ distribution network.
Retail includes Channels & Concepts, which is responsible for developing, managing and driving business in our digital
channels in Sweden. The various product areas are described on page 21.
Swedbank – Interim report January-June 2013 Page 14 of 58
Large Corporates & Institutions
 High business activity in Large Corporates
 Increased activity in Corporate Finance
 Weak fixed income trading and equity trading remains slow
Income statement
Q2 Q1 Q2 Jan-Jun Jan-Jun
SEKm 2013 2013 % 2012 % 2013 2012 %
Net interest income 851 783 9 750 13 1 634 1 478 11
Net commissions 523 419 25 396 32 942 881 7
Net gains and losses on financial items at fair value 503 579 -13 443 14 1 082 1 290 -16
Share of profit or loss of associates 0 0 0 0 6
Other income 49 33 48 12 82 17
Total income 1 926 1 814 6 1 601 20 3 740 3 672 2
Staff costs 292 287 2 290 1 579 595 -3
Variable staff costs 104 88 18 120 -13 192 225 -15
Other expenses 426 346 23 339 26 772 684 13
Depreciation/amortisation 12 13 -8 11 9 25 22 14
Total expenses 834 734 14 760 10 1 568 1 526 3
Profit before impairments 1 092 1 080 1 841 30 2 172 2 146 1
Impairment of intangible assets 56 0 4 56 4
Credit impairments 94 74 27 53 77 168 70
Operating profit 942 1 006 -6 784 20 1 948 2 072 -6
Tax expense 256 217 18 262 -2 473 701 -33
Profit for the period 686 789 -13 522 31 1 475 1 371 8
Profit for the period attributable to the shareholders of
Swedbank AB 686 789 -13 522 31 1 475 1 371 8
Return on allocated equity, % 14.5 16.7 10.3 15.6 14.4
Loan/deposit ratio, % 219 185 224 219 224
Credit impairment ratio, % 0.17 0.13 0.09 0.14 0.06
Cost/income ratio 0.43 0.40 0.47 0.42 0.42
Loans, SEKbn 151 150 1 150 1 151 150 1
Deposits, SEKbn 69 81 -15 67 3 69 67 3
Full-time employees 1 031 1 040 -1 1 049 -2 1 031 1 049 -2
Development January-June
The global economy is split. US growth has
strengthened, while business cycle conditions in the
eurozone remain weak. Several emerging markets also
saw weaker than expected growth rates. Signals from
the US Federal Reserve that it may taper its bond
buying have led to increased volatility in the global
financial markets at the same time that concerns about
the Chinese economy have grown. After rising earlier in
the year, stocks fell broadly in June at the same time
that the bond yields have risen significantly.
The result for the period was SEK 1 475m, an increase
of 8 per cent year-on-year. Higher lending income in
LC&I and higher income from fund and card products
contributed to the improvement. The result was
negatively affected by slower activity and earnings in
fixed income, currency and equity trading. During the
second quarter IT investments were written down by
SEK 56m. The return on allocated equity was 15.6 per
cent.
Net interest income increased by 11 per cent compared
with the first half of 2012. Lending volume rose by 1 per
cent or SEK 1bn. The lending margin has expanded
over time, and we are still seeing the effects of the
earlier repricing of corporate loans, including after
stricter regulatory requirements were introduced on
capital adequacy and liquidity. Compared with the
previous quarter net interest income rose by 9 per cent
to SEK 851m. The margin on the loan portfolio and
volumes increased slightly during the quarter. Deposit
margins were stable. Business activity in LC&I
remained good during the second quarter. Business
volumes mainly increased in the Energy, Shipping &
Offshore, and Telecoms sectors. M&A financing also
had a strong second quarter.
Risk weighted assets increased by SEK 2.9bn during
the quarter to SEK 133.4bn. Risk weighted assets for
credit risk increased by SEK 1.4bn, mainly due to
increased corporate lending volumes. Risk weighted
assets related to market risk increased by SEK 1.5bn,
mainly due to higher currency trading activity.
Net commission income increased by 7 per cent year-
on-year to SEK 942m. Compared with the first quarter
net commission income increased by 25 per cent to
SEK 523m. A high level of corporate finance activity in
Norway at the end of the quarter contributed to the
increase, as did higher income from card and fund
products. Continued low turnover and activity in equity
markets during the quarter led to continued weak
earnings in this area. Bond issuance activity remained
good in both Sweden and Norway. May was an
especially strong month for SEK in terms of both
number of issues and volume. Swedbank’s market
share for issuances by Swedish customers was 19.6 per
Swedbank – Interim report January-June 2013 Page 15 of 58
cent for the first half-year. The corresponding figure in
Norway was 16.8 per cent, making the bank the third
largest player in Sweden and the second largest in
Norway.
Net gains and losses on financial items at fair value
decreased by 16 per cent to SEK 1 082m compared
with 2012, when the result from equity, fixed income and
currency trading was very strong due to positive market
conditions. Net gains and losses on financial items at
fair value decreased by 13 per cent compared with the
previous quarter as a result of continued low interest
rates and low customer activity in fixed income
derivatives. Moreover, risk management was
complicated at the end of the quarter by turbulence in
the financial markets after indications by the Federal
Reserve that it may taper its bond buying, which
negatively affected earnings.
Total expenses increased by 3 per cent compared with
2012. Other expenses rose by 13 per cent. The
increase was due to higher expenses for funds and card
product sales, which were previously recognised within
Retail.
Intangible asset writedowns relate to IT systems and
amounted to SEK 56m.
Credit impairments amounted to SEK 168m in the first
half-year. The share of impaired loans increased to 0.49
per cent (0.10). The increases in impaired loans and
credit impairments are attributable to a few previously
identified problem loans managed by the Group’s
Financial Restructuring & Recovery (FR&R) unit. Credit
quality in the loan portfolio remains good.
Reorganisation to increase customer satisfaction
and strengthen profitability
LC&I is implementing a reorganisation to increase
customer satisfaction and raise profitability. The
organisational goal is to further develop customer
relations and create new business through a more
distinctive product offering. The new organisation, which
took effect on 1 July 2013, is divided into the following
units.
Two existing units, Large Corporates and Financial
Institutions, are responsible for bank lending and
deposits and have overarching responsibility for
customer contact. These units account for half of the
business area’s revenues. Customers are served by
teams of specialists in various sectors, types of
companies and institutions. The Investment Banking
unit, which supports customers with strategic advice and
financing solutions, consists of Corporate Finance,
Structured & Acquisition Finance and Debt Capital
Markets units. The unit accounts for around 10 per cent
of the business area’s revenue.
Product responsibility for fixed income, currency and
equity products has been consolidated in the Markets
unit, which is responsible for trading in these products
and creating a strong sales force for the various
customer segments. The unit accounts for about 30 per
cent of the business area’s revenue.
Global Transaction Services (GTS) has been
responsible since the beginning of 2013 for the bank’s
transaction services for large corporate and institutional
customers. It is responsible for driving and developing
solutions for document payments, bank guarantees,
payment services, cash management, custodial
services, card management and leasing across national
borders. The unit accounts for about 10 per cent of the
business area’s revenue.
During the quarter a new global analysis unit was
created within LC&I. In addition to analysis units for
fixed income, equity and credit products, it includes the
Economic Research Department. This will ensure that
the bank’s customers are provided a uniform macro
view.
Large Corporates & Institutions is responsible for large corporates, financial institutions and banks as well as for
trading and capital market products. Operations are carried out by the parent bank in Sweden, branch offices in Norway,
Denmark, Finland, the US and China, and through the trading and capital market operations in subsidiary banks in
Estonia, Latvia and Lithuania.
Swedbank – Interim report January-June 2013 Page 16 of 58
Baltic Banking
 Good activity in the daily banking business
 Net interest income increased compared with the first quarter
 New operating model to achieve efficiencies
Income statement
Q2 Q1 Q2 Jan-Jun Jan-Jun
SEKm 2013 2013 % 2012 % 2013 2012 %
Net interest income 763 742 3 868 -12 1 505 1 778 -15
Net commissions 445 388 15 394 13 833 780 7
Net gains and losses on financial items at fair value 72 62 16 75 -4 134 141 -5
Other income 98 89 10 111 -12 187 217 -14
Total income 1 378 1 281 8 1 448 -5 2 659 2 916 -9
Staff costs 189 188 1 187 1 377 379 -1
Variable staff costs 9 17 -47 15 -40 26 35 -26
Other expenses 366 351 4 364 1 717 745 -4
Depreciation/amortisation 29 30 -3 28 4 59 64 -8
Total expenses 593 586 1 594 0 1 179 1 223 -4
Profit before impairments 785 695 13 854 -8 1 480 1 693 -13
Impairment of tangible assets 2 4 -50 4 -50 6 2
Credit impairments -43 -70 -39 -204 -79 -113 -338 -67
Operating profit 826 761 9 1 054 -22 1 587 2 029 -22
Tax expense 68 61 11 96 -29 129 173 -25
Profit for the period 758 700 8 958 -21 1 458 1 856 -21
Profit for the period attributable to the shareholders of
Swedbank AB 758 700 8 958 -21 1 458 1 856 -21
Return on allocated equity, % 13.4 12.6 15.0 12.7 14.8
Loan/deposit ratio, % 108 109 115 108 115
Credit impairment ratio, % -0.15 -0.25 -0.69 -0.20 -0.57
Cost/income ratio 0.43 0.46 0.41 0.44 0.42
Loans, SEKbn 119 113 5 115 3 119 115 3
Deposits, SEKbn 110 104 6 100 10 110 100 10
Full-time employees 4 053 4 142 -2 4 123 -2 4 053 4 123 -2
Development January-June
The Baltic countries are feeling the bite of recession,
although growth remained among the strongest in the
EU in the first quarter of 2013. GDP rose by 3.6 per cent
in Latvia, 3.5 per cent in Lithuania, and 1.1 per cent in
Estonia compared with the previous year. Growth was
slowed by weaker foreign demand and lower
investments. Household consumption is still strong,
especially in Latvia and Estonia, due to rising incomes
and robust confidence. The export sector is slightly
stronger in Lithuania.
The result amounted to SEK 1 458m for the first half-
year, against SEK 1 856m in the same period a year
earlier. The decrease was mainly due to lower net
interest income.
Net interest income declined by 12 per cent in local
currency compared with 2012. Lower market rates
negatively affected net interest income, while increased
deposit volumes and a slightly larger loan portfolio had a
positive impact. Fluctuations in exchange rates reduced
net interest income by SEK 60m. Compared with the
previous quarter net interest income rose by 2 per cent
in local currency.
Work has been initiated to reprice business that does
not meet the desired risk-adjusted returns. Exposures
whose returns requirements cannot be met will be
divested when possible.
Lending volumes increased by 3 per cent in local
currency from the previous year. The increase is mainly
attributable to the corporate segment. During the
second half of 2012 loan portfolios with a volume of
SEK 1.6bn were acquired from Hipoteku Bank in Latvia.
The first signs of improvement in new household lending
have been seen in Estonia and Lithuania in recent
months. Swedbank’s market share in lending was 28
per cent as of 31 May (28 per cent as of 31 December
2012).
Deposits increased by 9 per cent in local currency from
the previous year. Corporate and private deposits both
increased significantly year-on-year. The Latvian
deposit portfolio increased the most, with the acquisition
of Hipoteku Bank accounting for SEK 1.8bn of the
increase. Swedbank’s market share for deposits was 30
per cent as of 31 May (31 per cent as of 31 December
2012).
The loan-to-deposit ratio was 108 per cent (108 per cent
as of 31 December 2012).
Net commission income increased by 11 per cent in
local currency compared with the first half of 2012. The
increase was mainly due to higher payment
commissions, supported by increased customer activity
and retail revenue. The number of active customers has
grown by 115 000 in the last year to nearly 2.6 million.
Higher commission income from fund management also
contributed to net commission income growth.
Swedbank – Interim report January-June 2013 Page 17 of 58
Compared with the previous quarter net commission
income rose by 14 per cent in local currency.
Expenses stayed flat in local currency from the previous
year, including euro transition costs of SEK 11m in
Latvia. The cost/income ratio was 0.44 (0.42). To
increase efficiencies, a new Baltic Banking operating
model has been created and launched in 2013. The new
model will improve collaboration across the region. In
addition, the bank is looking into the possibility of
reducing the number of branches while at the same time
improving service in digital channels.
Net recoveries amounted to SEK 113m, compared with
SEK 338m for the first half-year 2012. Recoveries were
generated in the corporate portfolios in all three
countries, while the mortgage portfolios generated minor
impairments. Impaired loans continued to decrease
during the first half-year in all three Baltic countries.
Impaired loans, gross, amounted to SEK 7.3bn (SEK
12.8bn on 30 June 2012). The decrease was due to
amortisations, write-offs and loans that have started to
perform, while the inflow of new impaired loans was
limited. Credit quality has strengthened through a
gradual increase in new lending, which carries a lower
risk.
Risk-weighted assets decreased by SEK 3bn during the
first half-year to SEK 92bn, mainly driven by the
corporate portfolio. Risk-weighted assets have stabilised
or decreased in most of the lending portfolios due to an
improved risk profile, where improved ratings and
collateral have had a positive effect. Exchange rate
effects increased risk-weighted assets by SEK 2bn.
During the quarter Swedbank received recognition in all
three Baltic countries. In Estonia it was named the most
reputable large company for the sixth consecutive year.
In similar surveys in Latvia and Lithuania Swedbank
ranked second and third, respectively.
Latvia is preparing to convert to the euro on 1 January
2014. In June the European Central Bank and the EU
Commission confirmed that Latvia fulfils the Maastricht
criteria. The bank’s expenses related to the euro
transition are estimated at SEK 90m.
Baltic Banking has business operations in Estonia, Latvia and Lithuania. The bank’s services are sold through
Swedbank’s own branch network, the Telephone Bank and the Internet Bank. The various product areas are described on
page 21.
Swedbank – Interim report January-June 2013 Page 18 of 58
Group Functions & Other
Income statement
Q2 Q1 Q2 Jan-Jun Jan-Jun
SEKm 2013 2013 % 2012 % 2013 2012 %
Net interest income 426 495 -14 56 921 -57
Net commissions 1 -25 -4 -24 -27 -11
Net gains and losses on financial items at fair value -312 -118 18 -430 40
Share of profit or loss of associates 0 2 1 2 1 100
Other income 303 297 2 348 -13 600 698 -14
Total income 418 651 -36 419 0 1 069 655 63
Staff costs 812 787 3 818 -1 1 599 1 649 -3
Variable staff costs 51 73 -30 12 124 61
Other expenses -604 -600 1 -540 12 -1 204 -1 012 -19
Depreciation/amortisation 97 98 -1 148 -34 195 292 -33
Total expenses 356 358 -1 438 -19 714 990 -28
Profit before impairments 62 293 -79 -19 355 -335
Impairment of intangible assets 114 0 0 114 0
Impairment of tangible assets 200 81 120 67 281 162 73
Credit impairments 0 1 0 1 0
Operating profit -252 211 -139 81 -41 -497 -92
Tax expense 3 63 -95 -44 66 -196
Profit for the period from continuing operations -255 148 -95 -107 -301 -64
Profit for the period from discontinued operations, after tax -1 887 -390 -341 -2 277 -620
Profit for the period -2 142 -242 -436 -2 384 -921
Profit for the period attributable to the shareholders of
Swedbank AB -2 142 -243 -436 -2 385 -921
Non-controlling interests 0 1 0 1 0
Full-time employees 4 346 4 359 0 5 545 -22 4 346 5 545 -22
Development January-June
Group Functions & Other comprises the bank's Group
functions (including Group Products) and Ektornet.
Group Functions & Other also includes the banking
operations in Russia and Ukraine, which are reported as
discontinued operations as of the first quarter 2013.
Income for Group Functions & Other consists of net
interest income and net gains and losses on financial
items, which mainly come from Group Treasury. Other
income primarily consists of revenue from the savings
banks as well as sales revenue and operating income
from Ektornet. Income amounted to SEK 1 069m (655).
Expenses for Group Functions & Other decreased by 28
per cent from the previous year to SEK 714m (990).
Excluding the net of services purchased and sold
internally, expenses fell by 7 per cent to SEK 3 408m
(3 674). The decrease was mainly due to lower staff
costs as a result of a reduction in the number of
employees as well as lower costs for IT operations and
depreciation.
Group Products
Established on 1 January 2013, Group Products (GP)
consists of around 1 800 employees in Sweden,
Estonia, Latvia and Lithuania. GP is responsible for a
large part of Swedbank’s product areas with a strategy
to support the business areas by reducing the
complexity of the product range and simplifying sales in
the various distribution channels. The product areas GP
is responsible for – cards, payments, lending, deposits,
insurance and asset management – are described in
more detail on page 21. GP also comprises the
subsidiary Swedbank Franchise AB, which in turn
includes the real estate and business brokerages and a
legal service provider.
In GP’s revenue and expense model, revenue from
Swedbank’s customers is posted by each business area
and GP receives compensation from the business area
to cover its expenses. GP’s external revenue largely
comes from the savings banks for the products their
customers use.
Expenses, excluding the net of services purchased and
sold internally, amounted to SEK 1 583m (1 689) in the
first half year 2013. The decrease was mainly due to
lower IT maintenance expenses thanks to increased
efficiencies as well as lower mailing costs resulting from
increased digitalisation.
Group Treasury
Group Treasury is responsible for the bank’s funding,
liquidity and capital planning, including internal control
and pricing within these areas. The Group’s equity is
allocated to each business area on the basis of capital
adequacy rules and how much capital is needed based
on the bank's Internal Capital Adequacy Assessment
Process (ICAAP).
Group Treasury prices funding and liquidity in an
internal pricing system, where the most important
parameters for setting internal rates are maturity,
interest fixing period, currency, and the need for liquidity
reserves. Swedbank is conducting a project to further
refine internal rate setting control during 2013.
Group Treasury’s result over time should be nearly nil,
with the exception of earnings that may arise in debt
and liquidity management within given risk mandates.
The fee paid to the Swedish National Debt Office for
government guaranteed funding is charged against
Group Treasury. Risk hedging by Group Treasury is
Swedbank – Interim report January-June 2013 Page 19 of 58
generally achieved with financial derivatives. The
volatility in results over time is largely due to accounting-
based fluctuations in these hedges.
Net interest income for the first half-year amounted to
SEK 990m, compared with SEK 18m in the same period
of 2012. Of the SEK 972m change, SEK 133m is due to
lower fees for the government guaranteed funding.
Repurchases of covered bonds in particular and the fact
that the bank’s internal prices better reflect its funding
costs have positively affected net interest income.
Treasury’s net interest income has been temporarily
strengthened by positions that have benefitted from
lower market rates and to a certain extent by falling
credit and basis swap spreads. Consequently, net
interest income is likely to trend lower in 2013 as
position extensions are made at lower interest rates and
spreads. The tender offer during the second quarter to
repurchase outstanding government guaranteed bonds
is expected to positively affect net interest income by
about SEK 146m in the year ahead.
Net gains and losses on financial items at fair value
amounted to SEK -462m in the first half-year, compared
with SEK 16m in the previous year. The first half year
2012 net gains and losses on financial items was
negatively affected by SEK 250m due to a correction
related to outstanding subordinated loans. The result for
the period was negatively affected by SEK 362m by
repurchases of covered and senior bonds. Management
of the bank’s liquidity portfolio reduced net gains and
losses on financial items at fair value by SEK 55m,
partly because the surplus values in certain portfolio
holdings are declining in pace with their remaining
maturities. The liquidity portfolio has an average
remaining maturity of about 2 years. Net gains and
losses on financial items amounted to SEK -343m
during the second quarter, of which the tender offer for
outstanding government guaranteed bonds had a
negative effect of SEK 107m and other repurchases had
a negative effect of SEK 103m. Interest rate fluctuations
accounted for most of the remaining valuation effects
during the quarter.
Russia and Ukraine
During the second quarter Swedbank finalised the sale
of its Ukrainian subsidiary, which was reported together
with the Russian operations as discontinued operations
during the first quarter. This is part of the process of
concentrating Swedbank’s operations in Sweden and
the three Baltic countries. As previously announced, the
sale generated a negative cumulative exchange
difference of SEK 1 875m (due to the Ukrainian
hryvnia’s depreciation against the Swedish krona),
which was reclassified to the income statement during
the second quarter as discontinued operations. When
the cumulative exchange difference arose, mainly from
2007 to 2009, equity was directly impacted through
other comprehensive income. The reclassified item
therefore does not affect Swedbank’s capital,
capitalisation or cash flow and will not be taken into
account when the Board of Directors announces its
dividend proposal for 2013.
The result in Ukraine, which is recognised in
discontinued operations, amounted to SEK -2 236m
during the first half-year (-668), of which SEK 340m is a
writedown due to the divestment and SEK 1 875m
relates to the reclassification. The result for Russia
amounted to SEK -44m (48) during the period.
Following the sale of the subsidiary, the remaining
exposure in Ukraine consists of properties managed by
Swedbank’s subsidiary Ektornet; see below.
Swedbank has ceased accepting new business in
Russia and is winding down its remaining operations.
Swedbank’s net lending in Russia (including leasing) is
approximately SEK 2bn. The lending portfolio in Russia,
consisting mainly of good quality corporate loans, will
decrease through amortisation. Swedbank has real
estate assets worth about SEK 128m in Russia, which
also will be sold.
Ektornet
Ektornet manages and develops Swedbank’s
repossessed assets to recover as much value as
possible. The takeover phase is largely complete. The
focus going forward is on selling the property holdings.
The value of repossessed assets decreased during the
period to SEK 3 226m (SEK 4 606m as of 31 December
2012).
Assets taken over 30 Jun 31 Dec
SEKm 2013 2012
Sweden 48 374
Finland 0 281
Estonia 243 304
Latvia 1 354 1 665
Lithuania 237 351
USA 881 1 217
Ukraine 410 364
Total properties 3 173 4 556
Shares 53 50
Total 3 226 4 606
During the first half-year properties were sold for
SEK 1 501m (846) with an aggregate capital gain of
SEK 128m (107). Sales proceeds during the second
quarter amounted to SEK 511m (349) with a gain of
SEK 71m (53). The sales during the quarter mainly
consisted of a hotel in the US, a commercial property in
Ukraine and a large holding of apartments in Latvia.
During the period properties were acquired for
SEK 180m (765), mainly in Ukraine as part of the
discontinuation of Swedbank’s operations there.
Property values were written down by SEK 281m (162),
of which SEK 200m (120) in the second quarter. The
result for the period was SEK -281m (-206). Expenses
amounted to SEK 229m (324).
The number of employees at the end of the period
decreased to 138, compared with 508 (of which 305
hotel employees) as of 30 June 2012. The number of
properties, including condominiums and the like, was
2 367 (2 528 at the beginning of the year), of which
1 392 were in Latvia (1 695 at the beginning of the
year).
Group Functions & Other comprises, in addition to Group Functions, Ektornet and the banking operations in Russia and
Ukraine which are being wound down. Group Functions operate across the business areas and serve as strategic and
administrative support for them. Group Functions include Group Products, Group IT, Accounting & Finance (including
Group Treasury), Risk (including Compliance), Corporate Affairs (communications, strategic marketing and community
affairs), HR and Legal. The Group Executive Committee and Internal Audit are also included in Group Functions.
Swedbank – Interim report January-June 2013 Page 20 of 58
Eliminations
Income statement
Q2 Q1 Q2 Jan-Jun Jan-Jun
SEKm 2013 2013 2012 2013 2012
Net interest income 2 1 -1 3 -2
Net commissions 20 17 22 37 34
Net gains and losses on financial items at fair value 0 0 0 0 0
Other income -77 -59 -53 -136 -113
Total income -55 -41 -32 -96 -81
Staff costs 0 0 0 0 0
Variable staff costs 0 0 0 0 0
Other expenses -55 -41 -32 -96 -81
Depreciation/amortisation 0 0 0 0 0
Total expenses -55 -41 -32 -96 -81
Group eliminations mainly consist of eliminations of internal transactions between Group Functions and the other
business areas.
Swedbank – Interim report January-June 2013 Page 21 of 58
Product areas
Swedbank intends to gradually expand its product reporting. This is being done outside the consolidated accounts, which
means that the figures cannot be traced to specific lines in the financial statements. Responsibility for the product units
currently rests with Group Products within Group Functions & Other, but the results are reported in several legal units and
in the three business areas.
Card business
Swedbank issues cards and acquires card payments
from merchants in all its home markets as well as in
Denmark and Norway. All card operations are handled
within the bank, with the exception of the credit card
operations in Sweden, Denmark and Norway, which are
conducted through Entercard AB, a joint venture with
Barclays Bank. In its four home markets as a whole,
Swedbank has a market share for card payment
acquisitions and issuing of nearly 50 per cent.
As a card payment acquirer, Swedbank enables
retailers to accept payment through card terminals and
online. Revenue comes mainly from the transaction
prices retailers pay for administration and a payment
guarantee. Part of this revenue is passed on as
commissions to the issuers whose cards are used in the
stores. Swedbank is Europe’s fifth largest card payment
acquirer measured in number of transactions.
As a card issuer, the bank generates revenue from fees
charged to customers for access to a card, foreign
exchange fees for foreign purchases and interest
income from outstanding credit card balances.
Transaction revenue is also generated from card
payment acquisition companies when sales are made
with a Swedbank card.
The number of transactions made by card versus cash
is increasing in all of Swedbank’s home markets. Card
volumes are also growing as a function of underlying
economic growth. A large share of Swedbank’s
transaction revenue is based on the number of
transactions, not solely on the transactions’ value, which
makes issuing and acquiring revenue less volatile
during periods of slower economic growth.
In Sweden nearly 80 per cent of store purchases are
made by card, giving it one of the highest levels of card
usage in the world, with volume growth of about 5 per
cent per year. In Estonia the percentage of card
transactions is also high (55 per cent), with an annual
growth rate of about 8 per cent. In Latvia and Lithuania
card use is lower (35 and 20 per cent, respectively), but
the growth rate is expected to be higher than in Sweden
and Estonia.
Swedbank’s total card revenue amounted to SEK
1 970m during the first half-year, an increase of 7 per
cent year-on-year. The positive revenue trend was
mainly due to an increase in transactions (both card
acquiring and card issuing) as well as higher credit
volumes in EnterCard.
Card related income Jan-Jun Jan-Jun
SEKm 2013 2012 %
Card acquiring 373 354 5
of which Nordic countries 315 301 5
of which Baltic countries 58 53 9
Card issuing 796 708 12
of which Sweden 527 461 14
of which Baltic countries 269 247 9
Net interest income, credit cards 146 142 3
of which Sweden 32 29 10
of which Baltic countries 114 113 1
Entercard* 655 632 4
Total Card related income 1 970 1 836 7
* Swedbank's share of Entercard's total income. Entercard is consolidated into
Swedbank Group by the equity method.
The volume of processed payments increased by 9 per
cent to SEK 208bn compared with the first half of 2012,
the market as a whole also grew by 9 per cent. The
number of transactions processed rose by 11 per cent
to 850 million, the market as a whole also grew by 11
per cent. Income is not growing at the same pace as the
volume of acquired payments or the number of acquired
transactions because of price pressure from increased
competition and tighter regulations. The expansion of
the payment business to Norway and Denmark is
generating a significant share of the total inflow of new
acquiring customers, transactions and income.
Growth is higher in the Baltic countries than in Sweden,
but the Nordic countries still account for about 90 per
cent of card processing volumes. In the Baltic countries
the fees paid by card acquirers to card issuers have
been renegotiated, resulting in lower compensation.
In card payment acquisitions, one of Swedbank’s most
important growth areas is rapidly expanding e-
commerce, where we as acquirer have a slightly lower
market share than, for example, in the grocery and retail
sectors due to competition and other payment
instruments. Swedbank is focused on expanding and
improving its e-commerce offering, where its processing
volume increased by over 50 per cent compared with
the first half of 2012.
The number of card purchases increased by 11 per cent
during the first half-year to 570 million. In Latvia and
Lithuania the increases were 18 and 15 per cent,
respectively. The number of cards issued by Swedbank
rose by 1 per cent to 7.8 million compared with the first
half of 2012. In card issuance Swedbank sees growth
opportunities in corporate cards, where we have
historically been weaker and where our large base of
small business customers offers significant potential. As
a first step an improved business debit card was
launched in Sweden in 2012. To date two thirds of our
corporate customers have chosen the new card. In 2012
a long-term agreement was signed with MasterCard as
the main card network supplier for both private and
corporate services, which has resulted in better
customer offerings and lower production costs.
Swedbank – Interim report January-June 2013 Page 22 of 58
Swedbank is currently the tenth largest card issuer in
Europe based on number of transactions.
Jan-Jun Jan-Jun
Key ratios, cards 2013 2012 %
Card acquiring transactions, millions 850 764 11
Card acquiring volume, SEKbn 208 191 9
Issued cards, millions 7.8 7.7 1
Card purchases (POS), millions 570 515 11
POS/total card turnover, % 65 63
Insurance business
Swedbank has life insurance operations in Sweden as
well as life and non-life operations in the Baltic
countries. In addition, Swedbank offers non-life
insurance in Sweden through a third-party solution with
the insurance company Tre Kronor. Insurance products
are sold through the distribution channels of Swedbank
and the savings banks.
Premium payments Jan-Jun Jan-Jun
SEKm 2013 2012 %
Sweden 8 450 7 930 7
of which collective occupational
pension 2 833 3 120 -9
of which endowment insurance 3 984 3 340 19
of which occupational pension 976 852 15
of which risk insurance 347 326 7
of which other 310 292 6
Baltic countries 489 484 1
of which life insurance 303 301 1
of which non-life insurance 186 183 2
Sweden
Swedbank Försäkring AB, the Group’s Swedish life
insurance company, is the sixth largest company in the
Swedish life insurance market, with a market share of
about 7 per cent in terms of premium income. Assets
under management increased during the period by 6 per
cent to SEK 110bn, of which SEK 96bn relates to unit
linked insurance and custody insurance. At the same
time premium income rose by 7 per cent to SEK 8.4bn.
An ageing population and shift in responsibility from
society to the individual is sparking demand for pension
and insurance products. The largest potential for
Swedbank in Sweden today is in risk products such as
life and health insurance as well as in occupational
pensions. Today only 20 per cent of Swedbank’s and
the savings banks’ corporate customers with revenues
of SEK 1-100m have an occupational pension solution
for their employees from Swedbank Försäkring.
Premium income from occupational pensions amounted
to SEK 3.8bn (4.0) during the first half-year, of which
occupational pensions excluding collective pensions
increased by 15 per cent year-on-year to SEK 976bn.
To increase sales of occupational pensions, Swedbank
Försäkring will launch an updated pension plan package
during the year.
As of 1 July Swedbank Försäkring is a company of
choice for the collectively negotiated occupational
pension plan (ITP) for 2013-2018. The fees for ITP are
low, but it is important to be able to offer collective
occupational pensions as part of a total offering to the
1.5 million private sector employees. Swedbank
Försäkring offers 22 funds with the highest aggregate
ratings of the companies. Half of the funds are from
Robur.
Demand for risk protection insurance remains high.
During the period sales of the Swedbank private
protection concept reached over 51 000 insurance
products, an increase of 35 per cent year-on-year.
We are in the process of simplifying processes and
routines and improving efficiencies. For example,
administrative paperwork has now been completely
digitised, and simplified risk rules have made it easier
and more expedient to manage customers. An
automated sales workflow for risk protection insurance
means that 75 per cent of cases can be processed at
the time of sale.
From March to June 140 000 customers of the bank
who previously had free loan protection were offered a
new, fee-based life insurance product. Over 95 000
have been sold, representing an annual premium of
nearly SEK 75m.
Assets under management 30 Jun 31 Dec
SEKbn 2013 2012 %
Sweden 109.5 103.4 6
of which collective occupational
pension 43.7 38.2 14
of which endowment insurance 46.8 48.6 -4
of which occupational pension 10.9 8.7 25
of which other 8.1 8.0 2
Baltic countries 3.2 3.3 -3
of which life insurance 3.2 3.3 -3
Baltic countries
In Estonia, Latvia and Lithuania the market shares for
life insurance as of 31 May are 39, 14 and 22 per cent,
respectively, making Swedbank the largest life insurer in
the Estonian and Lithuanian markets. Life insurance
operations are divided into risk insurance and savings
products. Swedbank mainly focuses on risk insurance
for existing loan customers, where it sees great growth
potential due to an inadequate social welfare system.
Premium income from risk insurance rose by 8 per cent
in local currency compared with 2012 to SEK 55m.
Sales were especially strong for credit life, a life
insurance product tied to a bank loan, which increased
by 5 per cent in local currency. Around 32 per cent of
the bank’s borrowers currently have credit life. Premium
payments for the total Baltic life insurance operations
increased by 4 per cent in local currency to SEK 303m
compared with the previous year. Assets under
management decreased by 1 per cent in local currency
to SEK 3.2bn, of which SEK 1.8bn relates to unit linked
insurance.
The market shares for non-life insurance in Estonia,
Latvia and Lithuania are 14, 3 and 1 per cent,
respectively. In non-life insurance Swedbank mainly
offers solutions for private customers. The largest
product areas are auto and homeowners insurance.
Since auto and home sales have fallen in recent years,
the focus has been on boosting sales by launching new
and simpler products. During the second quarter, for
example, a loan protection product was launched to
cover loan expenses in the event of a customer’s illness
or job loss. Total premium income for non-life insurance
in the Baltic countries amounted to SEK 186m during
the period, an increase of 6 per cent in local currency.
Swedbank – Interim report January-June 2013 Page 23 of 58
Revenue
Swedbank’s aggregate insurance revenue amounted to
SEK 935m (964) during the first half-year. Swedish life
insurance accounts for SEK 728m (719). The increase
in Sweden was mainly due to an improved risk result. A
portion of the risk insurance premium is continuously
allocated to cover future claims. Provisions are based
on assumptions about unreported claims that have
occurred and expectations about future claims, among
other things. An extensive analysis primarily of
unreported claims that have occurred has led to
changes in assumptions. These changes facilitated a
reversal from reserves during the first half-year, which
led to increased insurance revenue. Falling interest
rates have reduced the return on shareholders´ equity,
however, which has led to lower revenue. As a result,
the total increase for Swedish life insurance is 1 per
cent. Revenue from non-life operations in Sweden also
rose, and there are now nearly 215 000 contracts, an
increase of 9 per cent year-on-year.
Revenue for the Baltic life and non-life operations
decreased during the first half-year. Falling interest
rates have led to a lower return on assets, primarily for
life insurance operations, while the risk result there was
stable. Revenue for Baltic non-life operations fell by 28
per cent in local currency to SEK 79m. The decrease
was mainly due to a lower risk result as a result of
higher claims than in the previous year. Claims during
the period are in line with the average for previous
years, while the level of claims in the previous year was
relatively low.
Insurance related income Jan-Jun Jan-Jun
SEKm 2013 2012 %
Sweden 766 740 4
of which life insurance 728 719 1
of which non-life insurance 38 21 78
Baltic countries 169 224 -25
of which life insurance 90 110 -19
of which non-life insurance 79 114 -30
Total insurance related income 935 964 -3
Asset management operations
Swedbank’s asset management operations are
conducted through the Swedbank Robur group in
Swedbank’s four home markets and Norway. In total,
Swedbank Robur offers around 120 funds as well as
discretionary asset management, including
management of pension assets. Fund assets under
management amounted to SEK 561bn, of which SEK
541bn was in Sweden, where the market share was 24
per cent in terms of assets under management.
Discretionary assets under management amounted to
SEK 257bn.
During the first half-year the total net inflow was
primarily to mixed funds, while fixed income funds had a
net outflow. The total net inflow to Swedbank Robur’s
funds in Sweden was SEK 7.7bn, corresponding to a
market share of 16 per cent during the first half-year.
The positive net flow was mainly due to a high level of
activity at Swedbank’s and the savings banks’ branches,
where flows mainly went to private banking investment
solutions, short-term fixed income funds and collective
occupational pensions.
Measures to clarify and simplify the customer offering
are continuing in 2013. During the first half-year seven
funds were either merged or shut down.
The share of funds with returns surpassing their
comparative indices during the first half-year was 32 per
cent (30 per cent for the same period in 2012). The
average rating according to Morningstar has improved
and is now 3.36 (3.11), the second best among
comparable companies.
Asset management Jan-Jun Jan-Jun
Key ratios, SEKbn 2013 2012 %
Total income, SEKm 1 972 1 834 8
Asset under management 561 465 21
of which Sweden 541 447 21
of which Baltics 18 16 13
of which Norway 2 2 0
Discretionary asset management 257 275 -6
of which Sweden 255 274 -7
of which Baltics 2 1 100
Income for capital market products amounted to SEK
1 972m, which is 8 per cent higher than the same period
in 2012. The improvement was mainly from an increase
in average capital as a result of higher equity prices, but
also from the positive net flows. Excluding the Folksam
LO funds consolidated in the fourth quarter of 2012,
average fund assets grew by 10 per cent. Income,
which increased by SEK 48m from the previous quarter,
was positively affected by the market’s development at
the beginning of the quarter. Despite a weaker finish,
average assets under management rose by 3 per cent.
Income from institutional management, excluding
Swedbank Robur’s funds, amounted to SEK 46m.
Compared with the same period in 2012 income fell by
SEK 23m, mainly because the Folksam LO funds are
managed by Swedbank Robur since the fourth quarter.
Performance-related income received during the first
half of 2013 decreased by SEK 7m year-on-year.
In June the Mobile Bank added a new savings and
investment functionality, allowing users to easily buy,
sell and trade fund shares, track their holdings and
maintain an overview of their savings.
Payment operations
Swedbank is the market leader in payment and cash
management products in its four home markets.
Growth in the payment area is based on economic
growth and on customers increasingly using means of
payment other than cash.
The payment area is strongly affected by changes in the
operating environment, partly due to technological
developments but also to European legislation, where
the aim is to facilitate cross-border trade in products and
services. The development of a common payment zone
for the euro enables the bank to offer services to
customers with European operations without having to
set up business in every country. At the same time a
common payment zone creates greater competition.
Online payment services are an important growth area
for Swedbank. Today over 2.9 million customers in
Sweden and 2.1 million in the Baltic countries have
access to payment services through the Internet Bank
and the Mobile Bank. During the first half of 2013 the
number of transactions through these channels grew by
7.8 per cent year-on-year.
Swedbank's Interim Report Q2 2013

Más contenido relacionado

La actualidad más candente

080219 Roadshow Boston NY
080219 Roadshow Boston NY080219 Roadshow Boston NY
080219 Roadshow Boston NYSwedbank
 
Interim report Q2 2015
Interim report Q2 2015Interim report Q2 2015
Interim report Q2 2015Swedbank
 
Roadshow, Jan Lilja, Head of Group Treasury
Roadshow, Jan Lilja, Head of Group TreasuryRoadshow, Jan Lilja, Head of Group Treasury
Roadshow, Jan Lilja, Head of Group TreasurySwedbank
 
CEO presentation of Q1 2008 results
CEO presentation of Q1 2008 resultsCEO presentation of Q1 2008 results
CEO presentation of Q1 2008 resultsSwedbank
 
Roadshow, London, Mikael Inglander CFO
Roadshow, London, Mikael Inglander CFORoadshow, London, Mikael Inglander CFO
Roadshow, London, Mikael Inglander CFOSwedbank
 
080218 London Mikael Inglander
080218 London Mikael Inglander080218 London Mikael Inglander
080218 London Mikael InglanderSwedbank
 
Elo Mutual Insurance Company Interim Report 30.6.2021
Elo Mutual Insurance Company Interim Report 30.6.2021Elo Mutual Insurance Company Interim Report 30.6.2021
Elo Mutual Insurance Company Interim Report 30.6.2021Työeläkeyhtiö Elo
 
CEO presentation of Q3 2008 results
CEO presentation of Q3 2008 resultsCEO presentation of Q3 2008 results
CEO presentation of Q3 2008 resultsSwedbank
 
Preliminary Yearly Results 2015 - Banca IFIS Group
Preliminary Yearly Results 2015 - Banca IFIS GroupPreliminary Yearly Results 2015 - Banca IFIS Group
Preliminary Yearly Results 2015 - Banca IFIS GroupBanca Ifis
 
Liberty Bank Research Note - Q3 2013 and 9M 2013 Results
Liberty Bank Research Note - Q3 2013 and 9M 2013 ResultsLiberty Bank Research Note - Q3 2013 and 9M 2013 Results
Liberty Bank Research Note - Q3 2013 and 9M 2013 ResultsLiberty Securities
 
2010 Investors' Meeting Presentation - São Paulo
2010 Investors' Meeting Presentation - São Paulo2010 Investors' Meeting Presentation - São Paulo
2010 Investors' Meeting Presentation - São PauloKianne Paganini
 
Roadshow, Paris, Mikael Inglander
Roadshow, Paris, Mikael InglanderRoadshow, Paris, Mikael Inglander
Roadshow, Paris, Mikael InglanderSwedbank
 
Year end report 2015
Year end report 2015Year end report 2015
Year end report 2015Swedbank
 
First Half 2016 Results - Banca IFIS
First Half 2016 Results - Banca IFISFirst Half 2016 Results - Banca IFIS
First Half 2016 Results - Banca IFISBanca Ifis
 
Flash comment: Latvia - August 9, 2012
Flash comment: Latvia  - August 9, 2012Flash comment: Latvia  - August 9, 2012
Flash comment: Latvia - August 9, 2012Swedbank
 
Roadshow, UBS Nordic Banking Conference Jan Lidén
	Roadshow, UBS Nordic Banking Conference Jan Lidén	Roadshow, UBS Nordic Banking Conference Jan Lidén
Roadshow, UBS Nordic Banking Conference Jan LidénSwedbank
 
SEB fourth-quarter 2013 results presentation
SEB fourth-quarter 2013 results presentationSEB fourth-quarter 2013 results presentation
SEB fourth-quarter 2013 results presentationSEBgroup
 
Roadshow, Merrill Lynch Banking & Insurance Conference, London
Roadshow, Merrill Lynch Banking & Insurance Conference, LondonRoadshow, Merrill Lynch Banking & Insurance Conference, London
Roadshow, Merrill Lynch Banking & Insurance Conference, LondonSwedbank
 
Roadshow, Frankfurt, Johannes Rudbeck
Roadshow, Frankfurt, Johannes RudbeckRoadshow, Frankfurt, Johannes Rudbeck
Roadshow, Frankfurt, Johannes RudbeckSwedbank
 

La actualidad más candente (20)

080219 Roadshow Boston NY
080219 Roadshow Boston NY080219 Roadshow Boston NY
080219 Roadshow Boston NY
 
Interim report Q2 2015
Interim report Q2 2015Interim report Q2 2015
Interim report Q2 2015
 
Roadshow, Jan Lilja, Head of Group Treasury
Roadshow, Jan Lilja, Head of Group TreasuryRoadshow, Jan Lilja, Head of Group Treasury
Roadshow, Jan Lilja, Head of Group Treasury
 
CEO presentation of Q1 2008 results
CEO presentation of Q1 2008 resultsCEO presentation of Q1 2008 results
CEO presentation of Q1 2008 results
 
Roadshow, London, Mikael Inglander CFO
Roadshow, London, Mikael Inglander CFORoadshow, London, Mikael Inglander CFO
Roadshow, London, Mikael Inglander CFO
 
080218 London Mikael Inglander
080218 London Mikael Inglander080218 London Mikael Inglander
080218 London Mikael Inglander
 
Elo Mutual Insurance Company Interim Report 30.6.2021
Elo Mutual Insurance Company Interim Report 30.6.2021Elo Mutual Insurance Company Interim Report 30.6.2021
Elo Mutual Insurance Company Interim Report 30.6.2021
 
CEO presentation of Q3 2008 results
CEO presentation of Q3 2008 resultsCEO presentation of Q3 2008 results
CEO presentation of Q3 2008 results
 
Preliminary Yearly Results 2015 - Banca IFIS Group
Preliminary Yearly Results 2015 - Banca IFIS GroupPreliminary Yearly Results 2015 - Banca IFIS Group
Preliminary Yearly Results 2015 - Banca IFIS Group
 
Liberty Bank Research Note - Q3 2013 and 9M 2013 Results
Liberty Bank Research Note - Q3 2013 and 9M 2013 ResultsLiberty Bank Research Note - Q3 2013 and 9M 2013 Results
Liberty Bank Research Note - Q3 2013 and 9M 2013 Results
 
2010 Investors' Meeting Presentation - São Paulo
2010 Investors' Meeting Presentation - São Paulo2010 Investors' Meeting Presentation - São Paulo
2010 Investors' Meeting Presentation - São Paulo
 
Roadshow, Paris, Mikael Inglander
Roadshow, Paris, Mikael InglanderRoadshow, Paris, Mikael Inglander
Roadshow, Paris, Mikael Inglander
 
Year end report 2015
Year end report 2015Year end report 2015
Year end report 2015
 
First Half 2016 Results - Banca IFIS
First Half 2016 Results - Banca IFISFirst Half 2016 Results - Banca IFIS
First Half 2016 Results - Banca IFIS
 
Flash comment: Latvia - August 9, 2012
Flash comment: Latvia  - August 9, 2012Flash comment: Latvia  - August 9, 2012
Flash comment: Latvia - August 9, 2012
 
Roadshow, UBS Nordic Banking Conference Jan Lidén
	Roadshow, UBS Nordic Banking Conference Jan Lidén	Roadshow, UBS Nordic Banking Conference Jan Lidén
Roadshow, UBS Nordic Banking Conference Jan Lidén
 
SEB fourth-quarter 2013 results presentation
SEB fourth-quarter 2013 results presentationSEB fourth-quarter 2013 results presentation
SEB fourth-quarter 2013 results presentation
 
Roadshow, Merrill Lynch Banking & Insurance Conference, London
Roadshow, Merrill Lynch Banking & Insurance Conference, LondonRoadshow, Merrill Lynch Banking & Insurance Conference, London
Roadshow, Merrill Lynch Banking & Insurance Conference, London
 
Iceland: Country Risk Profile
Iceland: Country Risk ProfileIceland: Country Risk Profile
Iceland: Country Risk Profile
 
Roadshow, Frankfurt, Johannes Rudbeck
Roadshow, Frankfurt, Johannes RudbeckRoadshow, Frankfurt, Johannes Rudbeck
Roadshow, Frankfurt, Johannes Rudbeck
 

Destacado

Swedbank Analysis: Competitiveness adjustment in Latvia
Swedbank Analysis: Competitiveness adjustment in LatviaSwedbank Analysis: Competitiveness adjustment in Latvia
Swedbank Analysis: Competitiveness adjustment in LatviaSwedbank
 
Mercer Capital's Portfolio Valuation: Private Equity Marks and Trends | Q3 2015
Mercer Capital's Portfolio Valuation: Private Equity Marks and Trends | Q3 2015Mercer Capital's Portfolio Valuation: Private Equity Marks and Trends | Q3 2015
Mercer Capital's Portfolio Valuation: Private Equity Marks and Trends | Q3 2015Mercer Capital
 
American Express Credit Corp.2005
American Express Credit Corp.2005American Express Credit Corp.2005
American Express Credit Corp.2005finance8
 
Diari del 28 de març de 2013
Diari del 28 de març de 2013Diari del 28 de març de 2013
Diari del 28 de març de 2013diarimes
 
American Express Credit Corp.2006
American Express Credit Corp.2006American Express Credit Corp.2006
American Express Credit Corp.2006finance8
 
Toll Cross Industry Note: Uranium Update (July 24, 2013)
Toll Cross Industry Note: Uranium Update (July 24, 2013)Toll Cross Industry Note: Uranium Update (July 24, 2013)
Toll Cross Industry Note: Uranium Update (July 24, 2013)Uranium Exploration
 
Call for a dismissal of the parliament
Call for a dismissal of the parliamentCall for a dismissal of the parliament
Call for a dismissal of the parliamentSwedbank
 
Diari del 19 de juny de 2014
Diari del 19 de juny de 2014Diari del 19 de juny de 2014
Diari del 19 de juny de 2014diarimes
 
Swedbank Analysis
Swedbank AnalysisSwedbank Analysis
Swedbank AnalysisSwedbank
 
Ntc iso 9000
Ntc iso 9000Ntc iso 9000
Ntc iso 9000serdyman
 
6. review hotel environmental policies dwi hastho
6. review hotel environmental policies dwi hastho6. review hotel environmental policies dwi hastho
6. review hotel environmental policies dwi hasthoHastho Oke Sekali Jaya
 
Andbank memoria anual de 2014 banca privada
Andbank memoria anual de 2014 banca privadaAndbank memoria anual de 2014 banca privada
Andbank memoria anual de 2014 banca privadaAndbank Banca Privada
 
Introduction to World Banking Structure
Introduction to World Banking StructureIntroduction to World Banking Structure
Introduction to World Banking StructureAakash Singh
 
Q3-Egypt Quarter Report JUL-SEP 2016
Q3-Egypt Quarter Report JUL-SEP 2016Q3-Egypt Quarter Report JUL-SEP 2016
Q3-Egypt Quarter Report JUL-SEP 2016Khaled Eid
 
INTERCONTINENTAL HOTELS GROUP (IHG) - DESIGN & DEVELOPMENT EUROPE - Article i...
INTERCONTINENTAL HOTELS GROUP (IHG) - DESIGN & DEVELOPMENT EUROPE - Article i...INTERCONTINENTAL HOTELS GROUP (IHG) - DESIGN & DEVELOPMENT EUROPE - Article i...
INTERCONTINENTAL HOTELS GROUP (IHG) - DESIGN & DEVELOPMENT EUROPE - Article i...Miguel Ruano
 

Destacado (20)

Swedbank Analysis: Competitiveness adjustment in Latvia
Swedbank Analysis: Competitiveness adjustment in LatviaSwedbank Analysis: Competitiveness adjustment in Latvia
Swedbank Analysis: Competitiveness adjustment in Latvia
 
Mercer Capital's Portfolio Valuation: Private Equity Marks and Trends | Q3 2015
Mercer Capital's Portfolio Valuation: Private Equity Marks and Trends | Q3 2015Mercer Capital's Portfolio Valuation: Private Equity Marks and Trends | Q3 2015
Mercer Capital's Portfolio Valuation: Private Equity Marks and Trends | Q3 2015
 
American Express Credit Corp.2005
American Express Credit Corp.2005American Express Credit Corp.2005
American Express Credit Corp.2005
 
Diari del 28 de març de 2013
Diari del 28 de març de 2013Diari del 28 de març de 2013
Diari del 28 de març de 2013
 
American Express Credit Corp.2006
American Express Credit Corp.2006American Express Credit Corp.2006
American Express Credit Corp.2006
 
Toll Cross Industry Note: Uranium Update (July 24, 2013)
Toll Cross Industry Note: Uranium Update (July 24, 2013)Toll Cross Industry Note: Uranium Update (July 24, 2013)
Toll Cross Industry Note: Uranium Update (July 24, 2013)
 
Call for a dismissal of the parliament
Call for a dismissal of the parliamentCall for a dismissal of the parliament
Call for a dismissal of the parliament
 
Küresel Rekabet Raporu (The Global Competitiveness Report) 2015
Küresel Rekabet Raporu (The Global Competitiveness Report) 2015Küresel Rekabet Raporu (The Global Competitiveness Report) 2015
Küresel Rekabet Raporu (The Global Competitiveness Report) 2015
 
Diari del 19 de juny de 2014
Diari del 19 de juny de 2014Diari del 19 de juny de 2014
Diari del 19 de juny de 2014
 
Swedbank Analysis
Swedbank AnalysisSwedbank Analysis
Swedbank Analysis
 
Ntc iso 9000
Ntc iso 9000Ntc iso 9000
Ntc iso 9000
 
6. review hotel environmental policies dwi hastho
6. review hotel environmental policies dwi hastho6. review hotel environmental policies dwi hastho
6. review hotel environmental policies dwi hastho
 
world economic forum Annual Report 2005
world economic forum Annual Report 2005world economic forum Annual Report 2005
world economic forum Annual Report 2005
 
Andbank memoria anual de 2014 banca privada
Andbank memoria anual de 2014 banca privadaAndbank memoria anual de 2014 banca privada
Andbank memoria anual de 2014 banca privada
 
Report Writing Skills
Report Writing SkillsReport Writing Skills
Report Writing Skills
 
Introduction to World Banking Structure
Introduction to World Banking StructureIntroduction to World Banking Structure
Introduction to World Banking Structure
 
Q3-Egypt Quarter Report JUL-SEP 2016
Q3-Egypt Quarter Report JUL-SEP 2016Q3-Egypt Quarter Report JUL-SEP 2016
Q3-Egypt Quarter Report JUL-SEP 2016
 
INTERCONTINENTAL HOTELS GROUP (IHG) - DESIGN & DEVELOPMENT EUROPE - Article i...
INTERCONTINENTAL HOTELS GROUP (IHG) - DESIGN & DEVELOPMENT EUROPE - Article i...INTERCONTINENTAL HOTELS GROUP (IHG) - DESIGN & DEVELOPMENT EUROPE - Article i...
INTERCONTINENTAL HOTELS GROUP (IHG) - DESIGN & DEVELOPMENT EUROPE - Article i...
 
ASFI - Analisi Strategico-Finanziaria d'Impresa
ASFI - Analisi Strategico-Finanziaria d'ImpresaASFI - Analisi Strategico-Finanziaria d'Impresa
ASFI - Analisi Strategico-Finanziaria d'Impresa
 
Actas juntas
Actas juntasActas juntas
Actas juntas
 

Similar a Swedbank's Interim Report Q2 2013

Swedbank's Interim report Q2 2014
Swedbank's Interim report Q2 2014Swedbank's Interim report Q2 2014
Swedbank's Interim report Q2 2014Swedbank
 
Swedbank's Interim Report Q1 2014
Swedbank's Interim Report Q1 2014Swedbank's Interim Report Q1 2014
Swedbank's Interim Report Q1 2014Swedbank
 
Swedbank's Interim Report Q3 2014
Swedbank's Interim Report Q3 2014Swedbank's Interim Report Q3 2014
Swedbank's Interim Report Q3 2014Swedbank
 
Swedbank's Year-End report 2014
Swedbank's Year-End report 2014Swedbank's Year-End report 2014
Swedbank's Year-End report 2014Swedbank
 
Danske bank interimreport q22013
Danske bank interimreport q22013Danske bank interimreport q22013
Danske bank interimreport q22013Frank Ragol
 
Year end report 2016
Year end report 2016Year end report 2016
Year end report 2016Swedbank
 
Year-end Report 2014
Year-end Report 2014Year-end Report 2014
Year-end Report 2014PostNord
 
Interim report q1 2017
Interim report q1 2017Interim report q1 2017
Interim report q1 2017Swedbank
 
Groupe bpce results q4 13
Groupe bpce results   q4 13Groupe bpce results   q4 13
Groupe bpce results q4 13BPCE
 
Presentation of results Q1 - 2013 - SpareBank 1 Gruppen AS
Presentation of results Q1 - 2013 - SpareBank 1 Gruppen ASPresentation of results Q1 - 2013 - SpareBank 1 Gruppen AS
Presentation of results Q1 - 2013 - SpareBank 1 Gruppen ASSpareBank 1 Gruppen AS
 
SEB's second-quarter 2013 results presentation
SEB's second-quarter 2013 results presentationSEB's second-quarter 2013 results presentation
SEB's second-quarter 2013 results presentationSEBgroup
 
Speech Reto Francioni AGM 2013 Final
Speech Reto Francioni AGM 2013 FinalSpeech Reto Francioni AGM 2013 Final
Speech Reto Francioni AGM 2013 FinalDeutsche Börse AG
 
Interim Report January - March 2015
Interim Report January - March 2015Interim Report January - March 2015
Interim Report January - March 2015PostNord
 
Q2 2009 Transcript Tel conf
Q2 2009 Transcript Tel confQ2 2009 Transcript Tel conf
Q2 2009 Transcript Tel confSwedbank
 
SEB's third-quarter 2014 results presentation
SEB's third-quarter 2014 results presentationSEB's third-quarter 2014 results presentation
SEB's third-quarter 2014 results presentationSEBgroup
 
SEB's second quarter 2016 financial results presentation
SEB's second quarter 2016 financial results presentationSEB's second quarter 2016 financial results presentation
SEB's second quarter 2016 financial results presentationSEBgroup
 
Interim Report January-March 2013
Interim Report January-March 2013Interim Report January-March 2013
Interim Report January-March 2013PostNord
 
SEB's 2014 interim results presentation
SEB's 2014 interim results presentationSEB's 2014 interim results presentation
SEB's 2014 interim results presentationSEBgroup
 

Similar a Swedbank's Interim Report Q2 2013 (20)

Swedbank's Interim report Q2 2014
Swedbank's Interim report Q2 2014Swedbank's Interim report Q2 2014
Swedbank's Interim report Q2 2014
 
Swedbank's Interim Report Q1 2014
Swedbank's Interim Report Q1 2014Swedbank's Interim Report Q1 2014
Swedbank's Interim Report Q1 2014
 
Swedbank's Interim Report Q3 2014
Swedbank's Interim Report Q3 2014Swedbank's Interim Report Q3 2014
Swedbank's Interim Report Q3 2014
 
Swedbank's Year-End report 2014
Swedbank's Year-End report 2014Swedbank's Year-End report 2014
Swedbank's Year-End report 2014
 
Danske bank interimreport q22013
Danske bank interimreport q22013Danske bank interimreport q22013
Danske bank interimreport q22013
 
Year end report 2016
Year end report 2016Year end report 2016
Year end report 2016
 
Year-end Report 2014
Year-end Report 2014Year-end Report 2014
Year-end Report 2014
 
Interim report q1 2017
Interim report q1 2017Interim report q1 2017
Interim report q1 2017
 
Groupe bpce results q4 13
Groupe bpce results   q4 13Groupe bpce results   q4 13
Groupe bpce results q4 13
 
Presentation of results Q1 - 2013 - SpareBank 1 Gruppen AS
Presentation of results Q1 - 2013 - SpareBank 1 Gruppen ASPresentation of results Q1 - 2013 - SpareBank 1 Gruppen AS
Presentation of results Q1 - 2013 - SpareBank 1 Gruppen AS
 
Towards Ambition 2015. Goldman Sachs Conference 2013
Towards Ambition 2015. Goldman Sachs Conference 2013Towards Ambition 2015. Goldman Sachs Conference 2013
Towards Ambition 2015. Goldman Sachs Conference 2013
 
SEB's second-quarter 2013 results presentation
SEB's second-quarter 2013 results presentationSEB's second-quarter 2013 results presentation
SEB's second-quarter 2013 results presentation
 
Speech Reto Francioni AGM 2013 Final
Speech Reto Francioni AGM 2013 FinalSpeech Reto Francioni AGM 2013 Final
Speech Reto Francioni AGM 2013 Final
 
Interim Report January - March 2015
Interim Report January - March 2015Interim Report January - March 2015
Interim Report January - March 2015
 
Q2 2009 Transcript Tel conf
Q2 2009 Transcript Tel confQ2 2009 Transcript Tel conf
Q2 2009 Transcript Tel conf
 
SEB's third-quarter 2014 results presentation
SEB's third-quarter 2014 results presentationSEB's third-quarter 2014 results presentation
SEB's third-quarter 2014 results presentation
 
2014 Activity & Results
2014 Activity & Results2014 Activity & Results
2014 Activity & Results
 
SEB's second quarter 2016 financial results presentation
SEB's second quarter 2016 financial results presentationSEB's second quarter 2016 financial results presentation
SEB's second quarter 2016 financial results presentation
 
Interim Report January-March 2013
Interim Report January-March 2013Interim Report January-March 2013
Interim Report January-March 2013
 
SEB's 2014 interim results presentation
SEB's 2014 interim results presentationSEB's 2014 interim results presentation
SEB's 2014 interim results presentation
 

Más de Swedbank

Swedbank corporate presentation April 25 2017
Swedbank corporate presentation April 25 2017Swedbank corporate presentation April 25 2017
Swedbank corporate presentation April 25 2017Swedbank
 
Swedbank foretagspresentation 25 april 2017
Swedbank foretagspresentation 25 april 2017Swedbank foretagspresentation 25 april 2017
Swedbank foretagspresentation 25 april 2017Swedbank
 
Delårsrapport kv1 2017
Delårsrapport kv1 2017Delårsrapport kv1 2017
Delårsrapport kv1 2017Swedbank
 
Bokslutskommuniké 2016
Bokslutskommuniké 2016Bokslutskommuniké 2016
Bokslutskommuniké 2016Swedbank
 
Swedbank företagspresentation, 2 februari 2017
Swedbank företagspresentation, 2 februari 2017Swedbank företagspresentation, 2 februari 2017
Swedbank företagspresentation, 2 februari 2017Swedbank
 
Swedbank corporate presentation, February 2 2017
Swedbank corporate presentation, February 2 2017Swedbank corporate presentation, February 2 2017
Swedbank corporate presentation, February 2 2017Swedbank
 
Swedbank Corporate Presentation, October 25 2016
Swedbank Corporate Presentation, October 25 2016Swedbank Corporate Presentation, October 25 2016
Swedbank Corporate Presentation, October 25 2016Swedbank
 
Swedbank företagspresentation, 25 oktober 2016
Swedbank företagspresentation, 25 oktober 2016Swedbank företagspresentation, 25 oktober 2016
Swedbank företagspresentation, 25 oktober 2016Swedbank
 
Swedbank Corporate Presentation, June 30 2016
Swedbank Corporate Presentation, June 30 2016Swedbank Corporate Presentation, June 30 2016
Swedbank Corporate Presentation, June 30 2016Swedbank
 
Swedbank företagspresentation, 30 juni 2016
Swedbank företagspresentation, 30 juni 2016Swedbank företagspresentation, 30 juni 2016
Swedbank företagspresentation, 30 juni 2016Swedbank
 
Swedbank corporate presentation Q1, 2016
Swedbank corporate presentation Q1, 2016Swedbank corporate presentation Q1, 2016
Swedbank corporate presentation Q1, 2016Swedbank
 
Swedbank företagspresentation kvartal 1, 2016.
Swedbank företagspresentation kvartal 1, 2016.Swedbank företagspresentation kvartal 1, 2016.
Swedbank företagspresentation kvartal 1, 2016.Swedbank
 
Swedbank corporate presentation Q4, 2015
Swedbank corporate presentation Q4, 2015Swedbank corporate presentation Q4, 2015
Swedbank corporate presentation Q4, 2015Swedbank
 
Swedbank företagspresentation kvartal 4,2015
Swedbank företagspresentation kvartal 4,2015Swedbank företagspresentation kvartal 4,2015
Swedbank företagspresentation kvartal 4,2015Swedbank
 
Bokslutskommuniké 2015
Bokslutskommuniké 2015Bokslutskommuniké 2015
Bokslutskommuniké 2015Swedbank
 
Swedbank Företagspresentation, September 2015
Swedbank Företagspresentation, September 2015Swedbank Företagspresentation, September 2015
Swedbank Företagspresentation, September 2015Swedbank
 
Swedbank Corporate Presentation, September 2015
Swedbank Corporate Presentation, September 2015Swedbank Corporate Presentation, September 2015
Swedbank Corporate Presentation, September 2015Swedbank
 
Swedbank's third quarter 2015 results
Swedbank's third quarter 2015 resultsSwedbank's third quarter 2015 results
Swedbank's third quarter 2015 resultsSwedbank
 
Swedbank delårsrapport tredje kvartalet 2015
Swedbank delårsrapport tredje kvartalet 2015Swedbank delårsrapport tredje kvartalet 2015
Swedbank delårsrapport tredje kvartalet 2015Swedbank
 
Kvartalsrapport andra kvartalet 2015
Kvartalsrapport andra kvartalet 2015Kvartalsrapport andra kvartalet 2015
Kvartalsrapport andra kvartalet 2015Swedbank
 

Más de Swedbank (20)

Swedbank corporate presentation April 25 2017
Swedbank corporate presentation April 25 2017Swedbank corporate presentation April 25 2017
Swedbank corporate presentation April 25 2017
 
Swedbank foretagspresentation 25 april 2017
Swedbank foretagspresentation 25 april 2017Swedbank foretagspresentation 25 april 2017
Swedbank foretagspresentation 25 april 2017
 
Delårsrapport kv1 2017
Delårsrapport kv1 2017Delårsrapport kv1 2017
Delårsrapport kv1 2017
 
Bokslutskommuniké 2016
Bokslutskommuniké 2016Bokslutskommuniké 2016
Bokslutskommuniké 2016
 
Swedbank företagspresentation, 2 februari 2017
Swedbank företagspresentation, 2 februari 2017Swedbank företagspresentation, 2 februari 2017
Swedbank företagspresentation, 2 februari 2017
 
Swedbank corporate presentation, February 2 2017
Swedbank corporate presentation, February 2 2017Swedbank corporate presentation, February 2 2017
Swedbank corporate presentation, February 2 2017
 
Swedbank Corporate Presentation, October 25 2016
Swedbank Corporate Presentation, October 25 2016Swedbank Corporate Presentation, October 25 2016
Swedbank Corporate Presentation, October 25 2016
 
Swedbank företagspresentation, 25 oktober 2016
Swedbank företagspresentation, 25 oktober 2016Swedbank företagspresentation, 25 oktober 2016
Swedbank företagspresentation, 25 oktober 2016
 
Swedbank Corporate Presentation, June 30 2016
Swedbank Corporate Presentation, June 30 2016Swedbank Corporate Presentation, June 30 2016
Swedbank Corporate Presentation, June 30 2016
 
Swedbank företagspresentation, 30 juni 2016
Swedbank företagspresentation, 30 juni 2016Swedbank företagspresentation, 30 juni 2016
Swedbank företagspresentation, 30 juni 2016
 
Swedbank corporate presentation Q1, 2016
Swedbank corporate presentation Q1, 2016Swedbank corporate presentation Q1, 2016
Swedbank corporate presentation Q1, 2016
 
Swedbank företagspresentation kvartal 1, 2016.
Swedbank företagspresentation kvartal 1, 2016.Swedbank företagspresentation kvartal 1, 2016.
Swedbank företagspresentation kvartal 1, 2016.
 
Swedbank corporate presentation Q4, 2015
Swedbank corporate presentation Q4, 2015Swedbank corporate presentation Q4, 2015
Swedbank corporate presentation Q4, 2015
 
Swedbank företagspresentation kvartal 4,2015
Swedbank företagspresentation kvartal 4,2015Swedbank företagspresentation kvartal 4,2015
Swedbank företagspresentation kvartal 4,2015
 
Bokslutskommuniké 2015
Bokslutskommuniké 2015Bokslutskommuniké 2015
Bokslutskommuniké 2015
 
Swedbank Företagspresentation, September 2015
Swedbank Företagspresentation, September 2015Swedbank Företagspresentation, September 2015
Swedbank Företagspresentation, September 2015
 
Swedbank Corporate Presentation, September 2015
Swedbank Corporate Presentation, September 2015Swedbank Corporate Presentation, September 2015
Swedbank Corporate Presentation, September 2015
 
Swedbank's third quarter 2015 results
Swedbank's third quarter 2015 resultsSwedbank's third quarter 2015 results
Swedbank's third quarter 2015 results
 
Swedbank delårsrapport tredje kvartalet 2015
Swedbank delårsrapport tredje kvartalet 2015Swedbank delårsrapport tredje kvartalet 2015
Swedbank delårsrapport tredje kvartalet 2015
 
Kvartalsrapport andra kvartalet 2015
Kvartalsrapport andra kvartalet 2015Kvartalsrapport andra kvartalet 2015
Kvartalsrapport andra kvartalet 2015
 

Último

fca-bsps-decision-letter-redacted (1).pdf
fca-bsps-decision-letter-redacted (1).pdffca-bsps-decision-letter-redacted (1).pdf
fca-bsps-decision-letter-redacted (1).pdfHenry Tapper
 
Market Morning Updates for 16th April 2024
Market Morning Updates for 16th April 2024Market Morning Updates for 16th April 2024
Market Morning Updates for 16th April 2024Devarsh Vakil
 
The AES Investment Code - the go-to counsel for the most well-informed, wise...
The AES Investment Code -  the go-to counsel for the most well-informed, wise...The AES Investment Code -  the go-to counsel for the most well-informed, wise...
The AES Investment Code - the go-to counsel for the most well-informed, wise...AES International
 
project management information system lecture notes
project management information system lecture notesproject management information system lecture notes
project management information system lecture notesongomchris
 
Tenets of Physiocracy History of Economic
Tenets of Physiocracy History of EconomicTenets of Physiocracy History of Economic
Tenets of Physiocracy History of Economiccinemoviesu
 
Role of Information and technology in banking and finance .pptx
Role of Information and technology in banking and finance .pptxRole of Information and technology in banking and finance .pptx
Role of Information and technology in banking and finance .pptxNarayaniTripathi2
 
The Core Functions of the Bangko Sentral ng Pilipinas
The Core Functions of the Bangko Sentral ng PilipinasThe Core Functions of the Bangko Sentral ng Pilipinas
The Core Functions of the Bangko Sentral ng PilipinasCherylouCamus
 
Economic Risk Factor Update: April 2024 [SlideShare]
Economic Risk Factor Update: April 2024 [SlideShare]Economic Risk Factor Update: April 2024 [SlideShare]
Economic Risk Factor Update: April 2024 [SlideShare]Commonwealth
 
magnetic-pensions-a-new-blueprint-for-the-dc-landscape.pdf
magnetic-pensions-a-new-blueprint-for-the-dc-landscape.pdfmagnetic-pensions-a-new-blueprint-for-the-dc-landscape.pdf
magnetic-pensions-a-new-blueprint-for-the-dc-landscape.pdfHenry Tapper
 
Unveiling Business Expansion Trends in 2024
Unveiling Business Expansion Trends in 2024Unveiling Business Expansion Trends in 2024
Unveiling Business Expansion Trends in 2024Champak Jhagmag
 
Amil Baba In Pakistan amil baba in Lahore amil baba in Islamabad amil baba in...
Amil Baba In Pakistan amil baba in Lahore amil baba in Islamabad amil baba in...Amil Baba In Pakistan amil baba in Lahore amil baba in Islamabad amil baba in...
Amil Baba In Pakistan amil baba in Lahore amil baba in Islamabad amil baba in...amilabibi1
 
(中央兰开夏大学毕业证学位证成绩单-案例)
(中央兰开夏大学毕业证学位证成绩单-案例)(中央兰开夏大学毕业证学位证成绩单-案例)
(中央兰开夏大学毕业证学位证成绩单-案例)twfkn8xj
 
原版1:1复刻温哥华岛大学毕业证Vancouver毕业证留信学历认证
原版1:1复刻温哥华岛大学毕业证Vancouver毕业证留信学历认证原版1:1复刻温哥华岛大学毕业证Vancouver毕业证留信学历认证
原版1:1复刻温哥华岛大学毕业证Vancouver毕业证留信学历认证rjrjkk
 
(办理学位证)加拿大萨省大学毕业证成绩单原版一比一
(办理学位证)加拿大萨省大学毕业证成绩单原版一比一(办理学位证)加拿大萨省大学毕业证成绩单原版一比一
(办理学位证)加拿大萨省大学毕业证成绩单原版一比一S SDS
 
Stock Market Brief Deck for "this does not happen often".pdf
Stock Market Brief Deck for "this does not happen often".pdfStock Market Brief Deck for "this does not happen often".pdf
Stock Market Brief Deck for "this does not happen often".pdfMichael Silva
 
Call Girls Near Delhi Pride Hotel, New Delhi|9873777170
Call Girls Near Delhi Pride Hotel, New Delhi|9873777170Call Girls Near Delhi Pride Hotel, New Delhi|9873777170
Call Girls Near Delhi Pride Hotel, New Delhi|9873777170Sonam Pathan
 
Governor Olli Rehn: Dialling back monetary restraint
Governor Olli Rehn: Dialling back monetary restraintGovernor Olli Rehn: Dialling back monetary restraint
Governor Olli Rehn: Dialling back monetary restraintSuomen Pankki
 
PMFBY , Pradhan Mantri Fasal bima yojna
PMFBY , Pradhan Mantri  Fasal bima yojnaPMFBY , Pradhan Mantri  Fasal bima yojna
PMFBY , Pradhan Mantri Fasal bima yojnaDharmendra Kumar
 

Último (20)

fca-bsps-decision-letter-redacted (1).pdf
fca-bsps-decision-letter-redacted (1).pdffca-bsps-decision-letter-redacted (1).pdf
fca-bsps-decision-letter-redacted (1).pdf
 
Market Morning Updates for 16th April 2024
Market Morning Updates for 16th April 2024Market Morning Updates for 16th April 2024
Market Morning Updates for 16th April 2024
 
The AES Investment Code - the go-to counsel for the most well-informed, wise...
The AES Investment Code -  the go-to counsel for the most well-informed, wise...The AES Investment Code -  the go-to counsel for the most well-informed, wise...
The AES Investment Code - the go-to counsel for the most well-informed, wise...
 
project management information system lecture notes
project management information system lecture notesproject management information system lecture notes
project management information system lecture notes
 
Tenets of Physiocracy History of Economic
Tenets of Physiocracy History of EconomicTenets of Physiocracy History of Economic
Tenets of Physiocracy History of Economic
 
Role of Information and technology in banking and finance .pptx
Role of Information and technology in banking and finance .pptxRole of Information and technology in banking and finance .pptx
Role of Information and technology in banking and finance .pptx
 
The Core Functions of the Bangko Sentral ng Pilipinas
The Core Functions of the Bangko Sentral ng PilipinasThe Core Functions of the Bangko Sentral ng Pilipinas
The Core Functions of the Bangko Sentral ng Pilipinas
 
Economic Risk Factor Update: April 2024 [SlideShare]
Economic Risk Factor Update: April 2024 [SlideShare]Economic Risk Factor Update: April 2024 [SlideShare]
Economic Risk Factor Update: April 2024 [SlideShare]
 
magnetic-pensions-a-new-blueprint-for-the-dc-landscape.pdf
magnetic-pensions-a-new-blueprint-for-the-dc-landscape.pdfmagnetic-pensions-a-new-blueprint-for-the-dc-landscape.pdf
magnetic-pensions-a-new-blueprint-for-the-dc-landscape.pdf
 
Q1 2024 Newsletter | Financial Synergies Wealth Advisors
Q1 2024 Newsletter | Financial Synergies Wealth AdvisorsQ1 2024 Newsletter | Financial Synergies Wealth Advisors
Q1 2024 Newsletter | Financial Synergies Wealth Advisors
 
Unveiling Business Expansion Trends in 2024
Unveiling Business Expansion Trends in 2024Unveiling Business Expansion Trends in 2024
Unveiling Business Expansion Trends in 2024
 
Amil Baba In Pakistan amil baba in Lahore amil baba in Islamabad amil baba in...
Amil Baba In Pakistan amil baba in Lahore amil baba in Islamabad amil baba in...Amil Baba In Pakistan amil baba in Lahore amil baba in Islamabad amil baba in...
Amil Baba In Pakistan amil baba in Lahore amil baba in Islamabad amil baba in...
 
(中央兰开夏大学毕业证学位证成绩单-案例)
(中央兰开夏大学毕业证学位证成绩单-案例)(中央兰开夏大学毕业证学位证成绩单-案例)
(中央兰开夏大学毕业证学位证成绩单-案例)
 
原版1:1复刻温哥华岛大学毕业证Vancouver毕业证留信学历认证
原版1:1复刻温哥华岛大学毕业证Vancouver毕业证留信学历认证原版1:1复刻温哥华岛大学毕业证Vancouver毕业证留信学历认证
原版1:1复刻温哥华岛大学毕业证Vancouver毕业证留信学历认证
 
(办理学位证)加拿大萨省大学毕业证成绩单原版一比一
(办理学位证)加拿大萨省大学毕业证成绩单原版一比一(办理学位证)加拿大萨省大学毕业证成绩单原版一比一
(办理学位证)加拿大萨省大学毕业证成绩单原版一比一
 
Monthly Economic Monitoring of Ukraine No 231, April 2024
Monthly Economic Monitoring of Ukraine No 231, April 2024Monthly Economic Monitoring of Ukraine No 231, April 2024
Monthly Economic Monitoring of Ukraine No 231, April 2024
 
Stock Market Brief Deck for "this does not happen often".pdf
Stock Market Brief Deck for "this does not happen often".pdfStock Market Brief Deck for "this does not happen often".pdf
Stock Market Brief Deck for "this does not happen often".pdf
 
Call Girls Near Delhi Pride Hotel, New Delhi|9873777170
Call Girls Near Delhi Pride Hotel, New Delhi|9873777170Call Girls Near Delhi Pride Hotel, New Delhi|9873777170
Call Girls Near Delhi Pride Hotel, New Delhi|9873777170
 
Governor Olli Rehn: Dialling back monetary restraint
Governor Olli Rehn: Dialling back monetary restraintGovernor Olli Rehn: Dialling back monetary restraint
Governor Olli Rehn: Dialling back monetary restraint
 
PMFBY , Pradhan Mantri Fasal bima yojna
PMFBY , Pradhan Mantri  Fasal bima yojnaPMFBY , Pradhan Mantri  Fasal bima yojna
PMFBY , Pradhan Mantri Fasal bima yojna
 

Swedbank's Interim Report Q2 2013

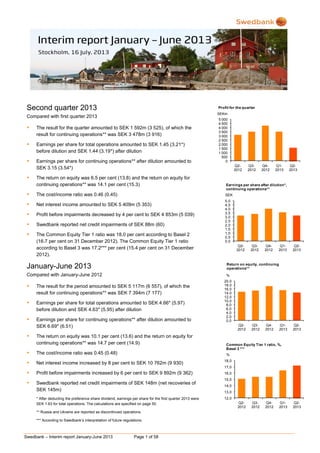
  • 1. Swedbank – Interim report January-June 2013 Page 1 of 58 Second quarter 2013 Compared with first quarter 2013  The result for the quarter amounted to SEK 1 592m (3 525), of which the result for continuing operations** was SEK 3 478m (3 916)  Earnings per share for total operations amounted to SEK 1.45 (3.21*) before dilution and SEK 1.44 (3.19*) after dilution  Earnings per share for continuing operations** after dilution amounted to SEK 3.15 (3.54*)  The return on equity was 6.5 per cent (13.8) and the return on equity for continuing operations** was 14.1 per cent (15.3)  The cost/income ratio was 0.46 (0.45)  Net interest income amounted to SEK 5 409m (5 353)  Profit before impairments decreased by 4 per cent to SEK 4 853m (5 039)  Swedbank reported net credit impairments of SEK 88m (60)  The Common Equity Tier 1 ratio was 18.0 per cent according to Basel 2 (16.7 per cent on 31 December 2012). The Common Equity Tier 1 ratio according to Basel 3 was 17.2*** per cent (15.4 per cent on 31 December 2012). January-June 2013 Compared with January-June 2012  The result for the period amounted to SEK 5 117m (6 557), of which the result for continuing operations** was SEK 7 394m (7 177)  Earnings per share for total operations amounted to SEK 4.66* (5.97) before dilution and SEK 4.63* (5.95) after dilution  Earnings per share for continuing operations** after dilution amounted to SEK 6.69* (6.51)  The return on equity was 10.1 per cent (13.6) and the return on equity for continuing operations** was 14.7 per cent (14.9)  The cost/income ratio was 0.45 (0.48)  Net interest income increased by 8 per cent to SEK 10 762m (9 930)  Profit before impairments increased by 6 per cent to SEK 9 892m (9 362)  Swedbank reported net credit impairments of SEK 148m (net recoveries of SEK 145m) * After deducting the preference share dividend, earnings per share for the first quarter 2013 were SEK 1.63 for total operations. The calculations are specified on page 50. ** Russia and Ukraine are reported as discontinued operations. *** According to Swedbank’s interpretation of future regulations. 0 500 1 000 1 500 2 000 2 500 3 000 3 500 4 000 4 500 5 000 Q2- 2012 Q3- 2012 Q4- 2012 Q1- 2013 Q2- 2013 SEKm Profit for the quarter 0,0 0,5 1,0 1,5 2,0 2,5 3,0 3,5 4,0 4,5 5,0 Q2- 2012 Q3- 2012 Q4- 2012 Q1- 2013 Q2- 2013 SEK Earnings per share after dilution*, continuing operations** 0,0 2,0 4,0 6,0 8,0 10,0 12,0 14,0 16,0 18,0 20,0 Q2- 2012 Q3- 2012 Q4- 2012 Q1- 2013 Q2- 2013 % Return on equity, continuing operations** 12,0 13,0 14,0 15,0 16,0 17,0 18,0 Q2- 2012 Q3- 2012 Q4- 2012 Q1- 2013 Q2- 2013 % Common Equity Tier 1 ratio, %, Basel 3 ***
  • 2. Swedbank – Interim report January-June 2013 Page 2 of 58 CEO Comment Cautiously positive economic development at the start of the year in large parts of the world continued during the second quarter. Several central banks have begun to announce that they are nearing the point when they will gradually scale back their stimulus measures, which has periodically led to increased volatility in the financial markets. Stable result Swedbank continued to report a stable result. The return on equity for continuing operations was 14 per cent for the second quarter. Net interest income rose slightly, mainly as a result of stronger net interest income from corporate lending. Margins on new mortgages in Sweden continued to fall during the second quarter and had a slightly negative impact on net interest income. At the same time we have gradually increased our share of new lending during the year. Deposit margins were stable due to unchanged short-term market interest rates. In the Baltic countries we are continuing to actively reassess our loan pricing to better reflect risk as well as capital and return. Strong business activity, especially as regards LC&I’s financing solutions, contributed to improved net commission income. Repurchases of outstanding government guaranteed bonds and rising long-term interest rates produced negative valuation effects. Expenses were stable. I see cost efficiencies as an increasingly important long-term competitive factor that at the same time facilitate future investments. The second quarter result was negatively affected by larger than usual writedowns within Ektornet as well as IT writedowns. In May we finalised the sale of the Ukrainian subsidiary. As previously announced, the earnings impact was SEK -1.9bn within discontinued operations and does not affect the bank's equity, since a corresponding positive amount is recognised in other comprehensive income. The Board of Directors will not take this into account in its dividend proposal for 2013. Focus on business It is gratifying to see the LC&I business area further strengthen its position. Our strategy of sector teams, with focus on selected customers for whom the bank is most appropriate, has led to improved growth and profitability. The customer-driven portion of trading operations has gradually grown in recent years, which has meant more stable revenue. Increased activity in corporate advice during the second quarter largely offset a lower result in fixed income and currency trading. Our customers increasingly use digital channels, which over time will entail a new relationship with the bank. This confirms that we have made the right decision to gradually increase investments in these channels. We will continue to simplify and improve the digital channels with the goal that our customers will choose them for practically all their daily transactions. This will free up more time for proactive customer contacts and qualified advice at the branches. At the same time the advice we provide in our digital channels will be improved and become more proactive. The goal is to create a better, more personal experience for every customer, at the same time that we become more efficient. A recent example is the option to trade mutual funds through the Mobile Bank, which was introduced in June. On the very first trading day 13 per cent of fund purchases and 8 per cent of sales were made through the Mobile Bank. With the reorganisation of the Retail business area at the beginning of the year, when the Channel & Concepts unit was established, we have taken another step in this direction. Continued focus on capital Swedbank’s capitalisation was further strengthened during the second quarter. The Common Equity Tier 1 capital ratio is now 17.2 per cent (Basel 3*). We are awaiting approval from the Swedish Financial Supervisory Authority to use an advanced model to calculate risk weights for our Swedish corporate lending, which will further strengthen the Common Equity Tier 1 capital ratio. The Board of Directors has not yet decided on the bank’s capital objectives, since several new regulations that will affect them have not been finalised. Based on the Swedish Financial Supervisory Authority’s final proposal on mortgage risk weights, Swedbank’s executive management today believes that the Common Equity Tier 1 capital ratio needs to be around 15 per cent according to Basel 3*. Swedbank has continued to reduce its risks in the last year, as confirmed by our new scenario-based stress tests for 2013. The stress test in the Riksbank’s most recent stability report also underscored Swedbank’s low risks. On 4 June the credit rating agency Moody’s raised Swedbank’s long-term rating from A2 to A1. We are working actively for further recognition of the extensive risk reduction Swedbank has made and expect over time that this will continue to positively affect our ratings. Relative funding costs will continue to decline and will be a sustainable competitive advantage for the bank. On 9 July Latvia received final approval to adopt the euro on 1 January 2014, which demonstrates how well it has managed the crisis. For Swedbank it also means a reduction in currency risks. Outlook We continue to plan for an environment with low interest rates and weak credit demand, even though there are positive signs in the markets. Our intent is to maintain total expenses at the same level in 2013 as in 2012. We continue to focus on profitability and capital efficiency at the same time that we invest in a better customer experience and development opportunities for our employees. Michael Wolf President and CEO * According to Swedbank’s interpretation of future regulations.
  • 3. Swedbank – Interim report January-June 2013 Page 3 of 58 Table of contents Page Financial summary 4 Overview 5 Market 5 Important events during the quarter 5 Second quarter 2013 compared with first quarter 2013 5 Results 5 January-June 2013 compared with January-June 2012 6 Results 6 Credit and asset quality 7 Stress test – Internal Capital Adequacy Assessment Process (ICAAP) for 2013 8 Funding and liquidity 8 Ratings 9 Capital and capital adequacy 9 Market risk 11 Operational risks 11 Other events 11 Events after 30 June 2013 11 Business areas Retail 12 Large Corporates & Institutions 14 Baltic Banking 16 Group Functions & Other 18 Eliminations 20 Product areas 21 Financial information Group Income statement, condensed 26 Statement of comprehensive income, condensed 27 Key ratios 27 Balance sheet, condensed 28 Statement of changes in equity, condensed 29 Cash flow statement, condensed 30 Notes 30 Parent company 53 Signatures of the Board of Directors and the President 57 Review report 57 Contact information 58 More detailed information can be found in Swedbank’s fact book, www.swedbank.com/ir, under Financial information and publications.
  • 4. Swedbank – Interim report January-June 2013 Page 4 of 58 Financial summary Income statement Q2 Q1 Q2 Jan-Jun Jan-Jun SEKm 2013 2013 % 2012 % 2013 2012 % Net interest income 5 409 5 353 1 5 035 7 10 762 9 930 8 Net commissions 2 525 2 388 6 2 339 8 4 913 4 737 4 Net gains and losses on financial items at fair value 296 557 -47 577 -49 853 1 556 -45 Other income 749 784 -4 837 -11 1 533 1 637 -6 Total income 8 979 9 082 -1 8 788 2 18 061 17 860 1 Staff costs 2 391 2 358 1 2 336 2 4 749 4 745 0 Other expenses 1 735 1 685 3 1 835 -5 3 420 3 753 -9 Total expenses 4 126 4 043 2 4 171 -1 8 169 8 498 -4 Profit before impairments 4 853 5 039 -4 4 617 5 9 892 9 362 6 Impairment of intangible assets 170 0 4 170 4 Impairment of tangible assets 202 85 124 63 287 164 75 Credit impairments 88 60 47 -49 148 -145 Operating profit 4 393 4 894 -10 4 538 -3 9 287 9 339 -1 Tax expense 913 976 -6 1 047 -13 1 889 2 155 -12 Profit for the period from continuing operations 3 480 3 918 -11 3 491 0 7 398 7 184 3 Profit for the period from discontinued operations, after tax -1 887 -390 -341 -2 277 -620 Profit for the period 1 593 3 528 -55 3 150 -49 5 121 6 564 -22 Profit for the period attributable to the shareholders of Swedbank AB 1 592 3 525 -55 3 147 -49 5 117 6 557 -22 Q2 Q1 Q2 Jan-Jun Jan-Jun Key ratios and data per share 2013 2013 2012 2013 2012 Return on equity, continuing operations, % 14.1 15.3 14.6 14.7 14.9 Return on equity, total operations, % 6.5 13.8 13.2 10.1 13.6 Earnings per share before dilution, continuing operations, SEK 1) 3.16 3.57 3.17 6.73 6.53 Earnings per share after dilution, continuing operations, SEK 1) 3.15 3.54 3.16 6.69 6.51 Cost/income ratio 0.46 0.45 0.47 0.45 0.48 Equity per share, SEK 1) 89.44 84.57 85.18 89.44 85.18 Loan/deposit ratio, % 186 188 216 186 216 Common Equity Tier 1 ratio, %, Basel 3 2) 17.2 16.4 15.1 17.2 15.1 Tier 1 capital ratio, %, Basel 3 2) 18.6 17.8 16.6 18.6 16.6 Capital adequacy ratio, %, Basel 3 2) 19.6 19.4 18.5 19.6 18.5 Common Equity Tier 1 ratio, %, Basel 2 18.0 17.3 16.2 18.0 16.2 Tier 1 capital ratio, %, Basel 2 19.0 18.3 17.8 19.0 17.8 Capital adequacy ratio, %, Basel 2 19.5 19.5 19.0 19.5 19.0 Credit impairment ratio, % 0.03 0.02 -0.01 0.02 -0.02 Share of impaired loans, gross, % 0.76 0.77 1.53 0.76 1.53 Total provision ratio for impaired loans, % 54 57 64 54 64 Balance sheet data 30 Jun 31 Dec 30 Jun SEKbn 2013 2012 % 2012 % Loans to the public 1 246 1 239 1 1 228 1 Deposits and borrowings from the public 673 580 16 560 20 Shareholders' equity 101 103 -2 96 5 Total assets 1 883 1 847 2 1 834 3 Risk weighted assets, Basel 3 2) 459 487 -6 508 -10 Risk weighted assets, Basel 2 455 464 -2 485 -6 1) After deducting the preference share dividend, earnings per share for the first quarter 2013 were SEK 1.63 for total operations (SEK 1.99 for continuing operations) after dilution. The calculations are specified on page 50. 2) According to Swedbank’s interpretation of future regulations. The key ratios are based on profit and shareholders’ equity allocated to shareholders of Swedbank.
  • 5. Swedbank – Interim report January-June 2013 Page 5 of 58 Overview Market The Swedish economy grew more than expected during the first quarter. GDP rose by 1.7 per cent at an annual rate, compared with a decline of slightly over 1 per cent for the EMU countries as a whole. Sweden’s growth was driven by rising inventories and increased private consumption. Investment fell at the same time that exports were hampered by weak demand and a relatively strong krona. It will probably take time before investment picks up. The strong krona and growing domestic competition contributed to negative inflation in April and May, which strengthens household purchasing power. Unemployment rose during the first months of the year due to an increased labour supply. However, on the positive side, the number of people employed continues to rise, indicating a recovery in the Swedish economy. Growth in the Baltic economies slowed during the first quarter, especially in Estonia, which faced weak external demand. GDP rose by 3.6 per cent in Latvia, 3.5 per cent in Lithuania, and 1.1 per cent in Estonia compared with the previous year. Private consumption accounts for a growing share of growth, while businesses are putting off investing. Signals that the US Federal Reserve may taper its bond buying during the second quarter, along with weaker Chinese growth, led to increased volatility in the global financial markets, which weakened the Swedish krona during the spring and summer months at the same time that bond yields rose. The Riksbank maintained the repo rate at 1 per cent at its recent monetary policy meetings in April and July. The Stockholm stock exchange (OMXSPI) gained 5 per cent during the first half-year. The Tallinn stock exchange (OMXTGI) rose by 11 per cent, the Vilnius stock exchange (OMXVGI) by 14 per cent and the Riga stock exchange (OMXRGI) by 10 per cent. Important events during the quarter In early May Swedbank completed the sale of its Ukrainian subsidiary. As previously announced, the sale generated a cumulative negative exchange rate difference of SEK 1 875m, which was reclassified to the income statement during the second quarter. These and the remaining Russian operations are recognised as discontinued operations. The reclassification does not affect Swedbank’s capital, capitalisation or cash flow and will be excluded from the Board of Directors’ dividend proposal for 2013, and when calculating variable remuneration. For more information, see page 9. In June Moody’s Investor Service upgraded Swedbank’s long-term credit rating from A2 to A1 with a stable outlook. For more information, see page 9. Swedbank announced a tender offer to the holders of outstanding government guaranteed bonds. Government guaranteed debt amounted to SEK 8bn on 30 June. For more information, see page 9. Second quarter 2013 Compared with first quarter 2013 Result Profit before impairments decreased by 4 per cent to SEK 4 853m (5 039). Profit for Retail and Group Treasury in Group Functions & Other decreased, while Baltic Banking accounted for the largest increase. Profit before impairments by business area Q2 Q1 Q2 SEKm 2013 2013 2012 Retail 2 914 2 971 2 941 Large Corporates & Institutions 1 092 1 078 828 Baltic Banking 785 700 823 Group Functions & Other 62 293 -18 Total excl FX effects 4 853 5 042 4 574 FX effects -3 43 Total 4 853 5 039 4 617 The second quarter result amounted to SEK 1 592m (3 525) and the result for continuing operations was SEK 3 478m (3 916). The result for discontinued operations was SEK -1 887m (-390), of which SEK 1 875m is a cumulative negative exchange rate difference that was reclassified to the income statement in connection with the sale of the Ukrainian operations (due to the depreciation of the Ukrainian hryvnia against the Swedish krona). When the cumulative exchange rate difference arose, mainly between 2007 and 2009, it directly affected equity through other comprehensive income. Consequently, the reclassification does not affect Swedbank’s capital, capitalisation or cash flow and will not be taken into account when the Board of Directors announces its dividend proposal for 2013. Credit impairments amounted to SEK 88m (60). Tangible asset writedowns amounted to SEK 202m (85), of which SEK 200m related to Ektornet’s properties. Intangible asset writedowns of SEK 170m (0) related to IT systems within Swedbank Finance AB and LC&I. The return on equity was 6.5 per cent (13.8). For the continuing operations the return on equity was 14.1 per cent (15.3). The cost/income ratio was 0.46 (0.45). Income decreased by 1 per cent to SEK 8 979m (9 082). Net interest income was stable, while net gains and losses on financial items at fair value decreased. Net commission income increased during the quarter. Net interest income was stable at SEK 5 409m (5 353). Net interest income was slightly higher for Retail and Baltic Banking, but rose more for LC&I, mainly due to increased volumes and margins. Group Treasury’s net interest income has decreased as earlier positions have matured. Stibor and Euribor rates were unchanged during the quarter and the previous pressure on deposit margins in Retail and Baltic Banking ended. The repricing of corporate lending continued within LC&I during the second quarter, but at a slightly slower pace, at the same time that new business generated higher margins. The margin on new mortgages continued to decline, while the stock margin declined slightly. A stability fee refund had a positive effect of SEK 37m. Net commission income increased by 6 per cent to SEK 2 525m (2 388), mainly due to increased activity in financing solutions and corporate finance as well as
  • 6. Swedbank – Interim report January-June 2013 Page 6 of 58 higher income from card operations. Asset management also contributed positively, as a result of higher average assets under management following a rise in share prices and positive net flows, while income from brokerage services and other securities decreased. The outsourcing of Retail’s ATMs has reduced payment commissions and expenses. For more information, see page 13. Net gains and losses on financial items at fair value fell by 47 per cent to SEK 296m (557). The tender offer to repurchase government guaranteed bonds negatively affected net gains and losses on financial items at fair value by SEK 107m and other repurchases by SEK 103m. Trading-related income within LC&I was lower than in the previous quarter. Expenses increased by 2 per cent from the previous quarter to SEK 4 126m (4 043,) mainly due to higher expenses for IT, consultants and personnel. Expense analysis Group Q2 Q1 Q2 SEKm 2013 2013 2012 Retail 2 398 2 406 2 411 Large Corporates & Institutions 834 733 754 Baltic Banking 593 589 571 Group Functions & Other and Eliminations 301 318 402 Total excl FX effects 4 126 4 046 4 138 FX effects -3 33 Total expenses 4 126 4 043 4 171 The number of full-time positions decreased during the quarter by 62, to 14 351, of which 89 relate to Baltic Banking and 57 relate to Ektornet. Retail increased by 49. Credit impairments amounted to SEK 88m (60). LC&I and Retail reported credit impairments, while Baltic Banking reported slightly lower net recoveries than in the first quarter. Tangible asset writedowns amounted to SEK 202m (85), of which SEK 200m related to Ektornet’s property holdings. Intangible asset writedowns amounted to SEK 170m and related to IT systems within Swedbank Finance AB and LC&I. The result from discontinued operations (Ukraine and Russia) amounted to SEK -1 887m (-390). The sale of the Ukrainian operations was finalised during the quarter, at which point a cumulative negative exchange rate difference of SEK 1 875m (due to the depreciation of the Ukrainian hryvnia against the Swedish krona) was reclassified from other comprehensive income to the income statement. The reclassification does not affect Swedbank’s capital, capitalisation or cash flow and will not be taken into account when the Board of Directors announces its dividend proposal for 2013, and when calculating variable remuneration. The tax expense amounted to SEK 913m (976), corresponding to an effective tax rate of 20.8 per cent (19.9). The higher effective rate during the quarter compared with the first quarter was due to a non- deductible property writedown of SEK 200m by Ektornet. No deferred tax assets were booked in connection with the writedown, since it is doubtful whether these deficits can be offset against future income. January-June 2013 Compared with January-June 2012 Result Profit before impairments increased by 6 per cent to SEK 9 892m (9 362). The first quarter 2012 was negatively affected by SEK 250m by a one-off adjustment within Group Treasury. Stronger net interest income and lower expenses affected profit positively, while net gains and losses on financial items at fair value were lower than in the same period in 2012. Profit before impairments by business area Jan-Jun Jan-Jun ∆ SEKm 2013 2012 SEKm Retail 5 885 5 858 27 Large Corporates & Institutions 2 172 2 126 46 Baltic Banking 1 480 1 634 -154 Group Functions & Other 355 -334 689 Total excl FX effects 9 892 9 284 608 FX effects 78 -78 Total 9 892 9 362 530 The result for the period decreased by 22 per cent to SEK 5 117m (6 557), of which the result for continuing operations was SEK 7 394m (7 177). The result for discontinued operations was SEK -2 277m (-620), of which SEK 1 875m is a cumulative negative exchange rate difference that was reclassified to the income statement in connection with the sale of the Ukrainian operations (due to the depreciation of the Ukrainian hryvnia against the Swedish krona). Credit impairments amounted to SEK 148m (net recoveries of 145), tangible asset writedowns to SEK 287m (164) and intangible asset writedowns to SEK 170m (4). Fluctuations in exchange rates, primarily the strengthening of the Swedish krona against the euro and the Baltic currencies, decreased profit by SEK 69m. The return on equity was 10.1 per cent (13.6). The return on equity for continuing operations was 14.7 per cent (14.9). The cost/income ratio was 0.45 (0.48). Income increased slightly to SEK 18 061m (17 860). Income in Retail and LC&I was stable compared with the previous year. Baltic Banking reported lower income, mainly due to falling market interest rates. Income in LC&I decreased from fixed income and currency trading. Group Treasury reported higher income year-on-year. Fluctuations in exchange rates reduced income by SEK 141m. Net interest income increased by 8 per cent to SEK 10 762m (9 930). The repricing of corporate lending within Retail and LC&I affected net interest income positively. Treasury’s net interest income has been temporarily strengthened by positions that have benefitted from falling market interest rates. The fee for government guaranteed funding decreased by SEK 133m. Lower deposit margins due to falling Stibor and Euribor rates as well as increased competition for deposits in Sweden negatively affected net interest income. Fluctuations in exchange rates reduced net interest income by SEK 77m.
  • 7. Swedbank – Interim report January-June 2013 Page 7 of 58 Net commission income improved to SEK 4 913m (4 737). Higher commission income from asset management owing to increased assets under management, higher income from card operations and greater activity in financing solutions positively affected net commission income, while corporate finance income was lower. The outsourcing of ATMs by Retail has reduced payment commissions and expenses. For more information, see page 13. Net gains and losses on financial items at fair value decreased by 45 per cent to SEK 853m (1 556). The first quarter 2012 was negatively affected by SEK 250m by a one-off adjustment within Group Treasury. The tender offer during the second quarter 2013 to repurchase government guaranteed bonds negatively affected net gains and losses on financial items at fair value by SEK 107m and other repurchases by SEK 103m. The results from equity, fixed income and currency trading were lower than in the same period in 2012, when the first-quarter results were very strong due to favourable market conditions. Expenses decreased by 4 per cent to SEK 8 169m (8 498). The largest decrease was in depreciation and amortisation, mainly from a reclassification within Swedbank Finance AB (Group Functions & Other), which at the same time reduced net interest income. Moreover, depreciations decreased as a result of lower depreciation in Ektornet. Expenses for transports and security fell by SEK 59m, IT expenses by SEK 44m and fixed staff costs by SEK 56m. Variable staff costs rose to SEK 457m (397), mainly because a new share-based programme for 2013 was added to the accruals of previous share-based programmes for 2010, 2011 and 2012. Changes in exchange rates reduced expenses by SEK 63m. Expense analysis Group Jan-Jun Jan-Jun ∆ SEKm 2013 2012 SEKm Retail 4 804 4 840 -36 Large Corporates & Institutions 1 568 1 515 53 Baltic Banking 1 179 1 177 2 Group Functions & Other and Eliminations 618 903 -285 Total excl FX effects 8 169 8 435 -266 FX effects 63 -63 Total expenses 8 169 8 498 -329 The number of full-time positions has decreased in one year by 1 337, of which 808 were in Ukraine and Russia, 50 in Retail and 370 in Ektornet (Group Functions & Other). Since 1 July 2010 Swedbank pays parts of its variable remuneration in the form of shares. This remuneration is accrued as an expense until the shares are settled. As a result variable remuneration allocated to employees during the period differs from the recognised amount. A more detailed analysis of variable remuneration is provided on page 14 of the fact book 1 . Credit impairments of SEK 148m were recognised in the first half-year 2013 (net recoveries of SEK 145m). LC&I and Retail reported credit impairments, while Baltic Banking reported net recoveries. 1 More detailed information can be found in Swedbank’s fact book, www.swedbank.com/ir, under Financial information and publications. Tangible asset writedowns rose by SEK 123m to SEK 287m, of which SEK 281m related to Ektornet. Intangible asset writedowns amounted to SEK 170m (4) and mainly related to a writedown of IT systems within Swedbank Finance AB and LC&I. The result from discontinued operations (Ukraine and Russia) amounted to SEK -2 277m (-620), of which SEK 2 236m related to the sale of the Ukrainian operations. For more information, see note 24. The tax expense amounted to SEK 1 889m (2 155), corresponding to an effective tax rate of 20.3 per cent (23.1). The lower effective tax rate in 2013 was mainly due to the reduction of the Swedish corporate tax rate as of 1 January 2013. Credit and asset quality Despite weak economic development in the eurozone, there are no signs of problems in the bank’s credit portfolios. Credit impairments remain low and impaired loans are gradually decreasing. The economic situation in Swedbank’s home markets has been stronger than in the rest of Europe. In the Baltic countries economic conditions have stabilised. In Sweden the situation is stable, although a slight increase in bankruptcies is evident among small businesses. This has not led to an increase in credit impairments in Swedbank’s portfolio, however. Swedbank’s lending increased during the first half-year by SEK 9.2bn, where SEK 2.2bn is attributable to currency effects. Lending to Swedish mortgage customers (including tenant-owner associations) rose by SEK 6.5bn. Corporate lending within LC&I and Retail increased by SEK 4.0bn. The lending portfolio in Baltic Banking rose slightly in local currency, mainly due to a few large corporate customers with low risk. In Estonia loan demand increased during the first half-year, including from private customers. In Latvia amortisations still exceed new lending, which is why the portfolio has shrunk slightly. The discontinuation of the operations in Russia and Ukraine has reduced lending volume by SEK 4.2bn. The average loan-to-value ratio of Swedbank’s mortgages in Sweden was 62.7 per cent (63.5) as of 30 June, based on property level. The average loan-to- value ratio for new mortgages in Sweden is 69.0 per cent in 2013. House prices in major Baltic cities have stabilised, with a clear rise in Estonia. Baltic Banking’s new lending has an average loan-to-value ratio of about 70 per cent. Impaired loans fell by SEK 4bn during the first half-year to SEK 10bn, with the discontinued operations in Russia and Ukraine accounting for SEK 3bn of the decrease. In Baltic Banking impaired loans fell by SEK 1.6bn, mainly due to write-offs and improved quality in the loan portfolio. Impaired loans within LC&I increased by SEK 0.9bn related to a few large commitments, while in Retail they decreased by SEK 0.2bn during the period. Impaired loans to private customers decreased during the first half-year. The share of Swedish mortgages past due by more than 60 days is stable at 0.12 per cent of the portfolio (0.13). The share of impaired loans in Baltic Banking has fallen, with the largest decrease in Latvia. The share of mortgages past due by more than 60 days was 1.0 per cent in Estonia (1.1), 9.8 per cent in Latvia (10.5) and 5.2 per cent in Lithuania (5.4). Further
  • 8. Swedbank – Interim report January-June 2013 Page 8 of 58 improvements are expected during the second half of 2013. Credit impairments, net by business area Q2 Q1 Q2 SEKm 2013 2013 2012 Retail 37 55 102 Large Corporates & Institutions 94 74 53 Baltic Banking -43 -70 -204 Estonia -36 -54 -25 Latvia 18 4 -197 Lithuania -25 -20 18 Group Functions & Other 0 1 0 Total 88 60 -49 Credit impairments for the first half-year amounted to SEK 148m (recoveries of SEK 145m). Credit impairments within Retail and LC&I remain low and are related to a few corporate commitments. The recoveries in the Baltic countries primarily relate to a limited number of corporate commitments. The value of repossessed assets in the Group fell by SEK 1.4bn to SEK 3.7bn during the first half-year, of which SEK 200m related to a property writedown by Ektornet during the second quarter. Ektornet acquired properties for SEK 180m mainly in Ukraine. Properties with a book value of SEK 1 501m were sold during the first half-year. For more information on Ektornet, see page 19. Swedbank’s exposure to counterparties in the GIIPS countries (Greece, Ireland, Italy, Portugal and Spain) remains low. The exposures totalled SEK 251m as of 30 June 2013 (401). GIIPS exposure 30 Jun 2013 SEKm Greece Ireland Italy Portugal Spain Total Bonds 0 85 27 5 117 of which sovereign 0 85 27 5 117 of which held to maturity1 0 85 27 5 117 Loans (money market and commercial paper) 9 5 14 Loans (credit facilities) Derivatives net2 7 7 71 85 Other3 0 0 24 2 9 35 Total 0 7 125 34 85 251 2 Derivatives at market value taking into account netting and collateral agreements. The derivatives gross value i.e. market value plus internal add-ons, amounts to: Ireland SEK 10m, Italy SEK 374m and Spain SEK 203m. Total SEK 588m. 3 Includes funds, trade finance and mortgage loans. 1 Current market values are approximately SEK 9m below the carrying amounts. Stress test – Internal Capital Adequacy Assessment Process 2013 Swedbank has worked actively to reduce risk on its balance sheet since 2009. As a result of this and the more normalised macroeconomic climate, the Internal Capital Adequacy Assessment Process (ICAAP) for 2013 shows Swedbank has limited risks. The bank is well capitalised for the effects of a potentially negative scenario, even when taking into account future regulatory changes. A recession scenario extending over five years was selected as the main scenario in the 2013 ICAAP. The five-year macro scenario shows negative growth for three consecutive years and high unemployment throughout the scenario period in Sweden and the Baltic countries. Confidence in politicians and the market is low, leading to a weaker euro and protracted recession, where the strong krona prevents Sweden from pulling itself out of the crisis through increased exports. The Baltic economies and export industry experience slower demand. In this scenario net interest income falls by 15 per cent to end 2015 before rising in the last two years. Total credit impairments amount to SEK 31.6bn, where LC&I and Retail together account for 76 per cent of the losses. Swedbank has incorporated future regulatory changes into this year's ICAAP. The changes include the pending Basel 3/CRD IV rules and revisions to the reporting standard for pensions (IAS 19). During the first year future regulations would impact the Common Equity Tier 1 ratio by nearly 2 percentage points. In the results of the stress test, Swedbank’s Common Equity Tier 1 ratio is strengthened throughout the scenario period. The scenario results do not take into account measures taken by Swedbank’s executive management. If the executive management’s expected measures are included in the stress scenario, the Common Equity Tier 1 ratio would be even stronger. The Baltic countries today have a significantly better macroeconomic balance and resilience compared with a few years ago. The work done in 2009-2012 to improve credit quality in the lending portfolios and strengthen the capital base in the Baltic subsidiaries has made them more resilient, as also evident in the 2013 ICAAP. This is also evident in the years with the highest stress level. Swedbank’s resilience in a stress scenario is confirmed by the Riksbank’s most recent stability report, where Swedbank is the only one of the four major Swedish banks with a positive result throughout the scenario period and where its Common Equity Tier 1 ratio does not decrease. For more information on Swedbank’s scenario simulation and its outcome, see pages 56-57 of the fact book. Funding and liquidity During the first half-year Swedbank issued a total of SEK 68bn in long-term debt instruments, of which SEK 46bn was covered bonds and SEK 20bn was senior debt. Issuance during the second quarter amounted to SEK 29bn, of which covered bonds accounted for SEK 23bn and senior debt for SEK 5bn. The bank saw continued high demand for private placements during the first half-year. In total Swedbank plans to issue around SEK 120bn in 2013 to meet maturing long-term funding with a nominal value of SEK 86bn as of the beginning of the year. Liquidity in excess of its refinancing needs will be used to repurchase bonds maturing in 2014. The average maturity of all capital market funding arranged through the bank’s short- and long-term programmes was 33 months as of 30 June 2013 (31). The average maturity of long-term funding issued during the first half-year was 74 months (55). The bank’s short- term funding is mainly used as a cash management tool, not to finance lending to the public. Outstanding volume decreased during the quarter to SEK 134bn (147).
  • 9. Swedbank – Interim report January-June 2013 Page 9 of 58 Swedbank completed its last issuance as part of the government guarantee programme in the summer of 2009 and subsequently left the programme in April 2010. Since then government guaranteed bonds have filled no purpose in the bank’s funding structure. As part of its ongoing liquidity management, the bank announced a tender offer during the second quarter to repurchase certain series of government guaranteed bonds. Swedbank repurchased a total of SEK 9bn, or 53 per cent of the volume. After the repurchase, the state- guaranteed debt as of 30 June 2013 was SEK 8bn. The repurchase negatively affected net gains and losses on financial items by SEK 107m during the second quarter and is expected to positively affect net interest income by approximately SEK 146m in the next year. As a whole, this represents savings of about SEK 40m. Due to the composition of its assets, Swedbank has a limited structural need for senior funding. The share of senior funding is mainly determined by the bank’s liquidity needs and the buffer it wants to maintain in its cover pool in the form of overcollateralisation in order to withstand fluctuations in house prices. Issued long-term debt Q2 Q1 SEKbn 2013 2013 Covered bonds 23 23 of which SEK 14 13 of which EUR 9 1 of which USD 0 7 of which Other 0 2 Senior unsecured bonds 5 15 Structured retail bonds (SPAX) 1 1 Total 29 39 Swedbank’s liquidity reserve, which is reported in accordance with the Swedish Bankers’ Association’s definition, amounted to SEK 289bn on 30 June 2013 (300). In addition to the liquidity reserve, liquid securities in other parts of the Group amounted to SEK 35bn (57). The liquidity reserve and the Liquidity Coverage Ratio (LCR) fluctuate over time depending, among other things, on the maturity structure of the bank’s issued securities. According to current Swedish regulations in effect as of 1 January 2013, the Group’s LCR was 129 per cent as of 30 June (139). Distributed by USD and EUR, LCR was 295 per cent and 207 per cent, respectively. In early 2013 the Basel Committee published a new recommendation on the definition of LCR. According to Swedbank’s interpretation of the new definition, LCR would have been 166 per cent as of 30 June. According to Swedbank’s interpretation of the current draft regulation, the Group’s Net Stable Funding Ratio (NSFR) was 95 per cent on 30 June (93). The main liquidity measure used by the Board of Directors and executive management is the so-called survival horizon, which shows how long the bank could manage long periods of stress in capital markets, where access to new financing would be limited. At present the bank would survive more than 12 months with the capital markets completely shut down. This applies to the Group’s total liquidity as well as liquidity in USD and EUR. For more information on Swedbank’s funding and liquidity (including the survival horizon), see pages 58-72 of the fact book. Ratings On 4 June Moody’s Investor Service upgraded Swedbank’s long-term credit rating to A1 from A2 with a stable outlook. Moody’s said the upgrade was due to Swedbank’s improved credit profile as a result of 1) a sustainable reduction of its risk profile and strengthening of the bank's corporate governance; 2) the continued reduction of problem loans and stabilisation of revenues; and 3) enhanced capital levels and improved funding profile. Capital and capital adequacy The Common Equity Tier 1 ratio according to Basel 3 continued to strengthen during the second quarter 2013 to 17.2 per cent, according to Swedbank’s calculation based on current knowledge of future regulations (16.4 per cent on 31 March 2013 and 15.4 per cent on 31 December 2012). The new regulations were adopted by the EU in June and take effect on 1 January 2014. The Common Equity Tier 1 ratio according to Basel 2 was 18.0 per cent on 30 June (17.3 and 16.7 respectively). Common Equity Tier 1 capital (Basel 2) increased by SEK 3.0bn during the second quarter to SEK 81.9bn. The increase was mainly due to the second quarter profit, after deducting the anticipated dividend, and includes a dividend of EUR 75m from Swedbank’s Baltic life insurance company. The sale of Swedbank’s Ukrainian operations was finalised in late April, in connection with which a negative cumulative exchange rate difference of SEK 1.9bn was reclassified from other comprehensive income to the result for the period. Common Equity Tier 1 capital is not affected, and it will have no bearing on the Board of Directors’ dividend proposal for 2013. As of 1 January 2013 new rules have entered into force on the recognition of pensions (accounting standard IAS 19). The revisions to IAS 19 will continue to create volatility in the estimated pension liability, which also affects equity through other comprehensive income. During the second quarter Common Equity Tier 1 capital increased by approximately SEK 1.2bn due to rising discount rates.
  • 10. Swedbank – Interim report January-June 2013 Page 10 of 58 Change in Common Equity Tier 1 capital 2013, Swedbank financial companies group Basel 3 75.2 Basel 3 76.1 Basel 3 79.2 1.2 4.0 -2.6 0.4 Basel 2 77.5 Basel 2 78.9 Basel 2 81.9 40 45 50 55 60 65 70 75 80 85 90 SEKbn Increase Decrease * Profit for financial companies group excl reclassification effect due to the Ukrainian divestment. Subordinated loans that may be included in the capital base decreased by SEK 3.3bn mainly due to the redemption of a EUR 400m subordinated loan at the end of June. Risk weighted assets (Basel 2) decreased by about SEK 2bn during the second quarter to SEK 455bn. The risk weighted amount for credit risks decreased by nearly SEK 2bn. Increased exposures, mainly to customers in Sweden, have raised the risk weighted amount by SEK 6.8bn, while the sale of Swedbank’s Ukrainian operations decreased the risk weighted amount for credit risks by SEK 1.7bn and the reduction in credit exposures in Russia decreased the risk weighted amount by SEK 1.2bn. Positive rating migrations reduced the risk weighted amount by SEK 5.5bn, while exposures with corrected exposure classes reduced the risk weighted amount by SEK 3.7bn. Fluctuations in exchange rates, mainly attributable to the Baltic credit portfolio, increased the risk weighted amount for credit risks by SEK 4.5bn due to the depreciation of the Swedish krona against the euro. The risk weighted amount for market risks was essentially unchanged as of 30 June compared with 31 March. The sale of Swedbank’s Ukrainian operations decreased the risk weighted amount for market risks by SEK 1.2bn, while market risks within Large Corporates & Institutions increased. The capital requirement for operational risks in the Ukrainian operations was removed after the disposal, which reduced the risk weighted amount for operational risks by SEK 0.6bn. Change in risk weighted assets 2013, Swedbank financial companies group Basel 2 464.3 Basel 2 457.0 Basel 2 455.2 4.5 -4.4 0.5 4.0 -5.5 - 0.1 -0.6 Basel 3 487.1 Basel 3 464.9 Basel 3 459.5 380 400 420 440 460 480 500 SEKbn Increase Decrease The reduced Basel 3 effect on the risk weighted amount compared with 31 March is due to a clarification from the European Banking Authority (EBA) with regard to the capital requirement for currency risks. On 21 May the Swedish Financial Supervisory Authority (FI) announced its decision to introduce a risk weight floor of 15 per cent for the Swedish mortgage portfolio, in accordance with the proposal announced in November 2012. The floor will be implemented as a supervisory measure within Pillar 2. Consequently, the reported capital ratios will not be affected, since these calculations are made according to the rules for Pillar 1. Based on an average risk weight in Swedbank’s Swedish mortgage portfolio of 4.4 per cent as of 30 June according to Pillar 1 and the Swedish Common Equity Tier 1 capital requirement of 12 per cent (as of 2015), Swedbank, as per FI’s decision, has to maintain additional Common Equity Tier 1 capital of SEK 9.6bn for Swedish mortgages, corresponding to 2.1 percentage points of the Common Equity Tier 1 ratio according to Pillar 1. In its internal controls, Swedbank has for some time allocated additional capital to its mortgage business equivalent to the risk weight floor that has now been announced. 30 Jun 31 Dec 30 Jun SEKbn 2013 2012 2012 Retail 201 202 214 Large Corporates & Institutions 133 134 135 Baltic Banking 92 95 98 Estonia 37 38 39 Latvia 29 31 33 Lithuania 26 26 26 Group Functions & Other 29 33 38 Group Products 4 4 3 Treasury 17 15 16 Ektornet 5 6 7 Other 3 8 12 Total risk-weighted assets 455 464 485 Risk-weighted assets by business area, Basel 2
  • 11. Swedbank – Interim report January-June 2013 Page 11 of 58 Discussions among regulators and other interested parties on the harmonisation of risk weights have intensified in the last quarter. One topic of discussion is how the leverage ratio can be used to ensure a minimum capital level in relation to the size of the balance sheet. When the EU’s new capital adequacy rules (CRD IV/CRR) take effect on 1 January 2014, banks will be obligated to report their leverage ratios to the supervisory authority. Swedbank’s leverage ratio (according to CRR) was 4.5 per cent on 30 June. The Basel Committee has recently issued a draft of revised rules on calculating the leverage ratio. Swedbank’s leverage ratio would only be marginally affected if the Basel Committee’s proposal became EU law. Market risk The majority of the Group’s market risks are of a structural or strategic nature and are managed by Group Treasury. Structural interest rate risks arise when the maturity of the Group’s assets and liabilities, such as deposits and lending, do not coincide. These differences are managed by Group Treasury within given mandates by matching the maturities directly or through the use of various derivatives such as interest rate swaps. Net interest income sensitivity is also affected by the structural risks in the bank’s deposit operations, where various products show different sensitivity to changes in market interest rates. Strategic currency risks arise primarily through risks tied to holdings in foreign subsidiaries and their financing. In Swedbank market risks also arise in LC&I’s trading operations in connection with customer transactions and by maintaining a secondary market for various types of securities. Swedbank measures market risks with a Value-at-Risk (VaR) model, among other things. For each portfolio, VaR expresses a loss level that statistically will be exceeded by a specific probability during a set time horizon. Swedbank uses a 99 per cent probability and a time horizon of one day. This means that the potential loss for the portfolio, based on historical data, will exceed VaR on one day of 100. The table below shows Swedbank’s VaR*) performance during the year. VaR by risk category 30 Jun 31 Dec SEKm Max Min Average 2013 2012 Interest risk 97 (131) 65 (76) 80 (102) 65 71 Currency rate risk 17 (14) 2 (3) 7 (6) 6 5 Stock price risk 9 (14) 2 (4) 5 (8) 4 4 Diversification 0 0 -16 (-21) -16 -14 Total 89 (123) 59 (69) 76 (95) 60 66 Jan-Jun 2013 (2012) *) VaR here excludes strategic currency rate risks, since a VaR measurement based on a time horizon of one day is not relevant. For individual risk types, VaR is supplemented with risk measures and limits based on sensitivity to changes in various market prices. Risk taking is also monitored with stress tests. An increase in all market interest rates of one percentage point would have reduced the Group’s net gains and losses on financial items at fair value by SEK 783m as of 30 June 2013, compared with a decrease of SEK 52m as of 31 December 2012. Operational risks Swedbank’s measures to stabilise and safeguard IT operations in the Internet Bank and Telephone Bank have resulted in fewer disruptions and improved accessibility. In comparison with the first five months of 2012, the number of major IT-related incidents decreased by 39 per cent at the same time that the time it took to address the incidents decreased by 55 per cent. The long-term work to improve the bank’s IT infrastructure is continuing according to plan. In connection with the replacement of old ATMs by new ones by Bankomat AB, which is jointly owned by Sweden’s largest banks, accessibility to a number of ATMs was adversely affected during the first quarter. During the second quarter accessibility again improved. External fraud attempts against the bank’s customers have continued, but through its active efforts the bank has been able to prevent money from being embezzled. We are also working to inform our customers about security improvements. Operational risks in the Group were also reduced as a result of the Ukrainian bank sale. Expenses associated with operational risk events have remained low. Other events Peter Borsos, previously head of Communications for the Swedish operations, succeeds Thomas Backteman as Group head of Communications on 16 July. Jonas Erikson, head of Group Treasury, will be part of the Group Executive Committee as from 16 July. Gregori Karamouzis, head of Debt IR, will as of 1 September also be responsible for Investor Relations. Johannes Rudbeck, present head of Investor Relations, will become CFO of Baltic Banking. Events after 30 June 2013 In July the European Central Bank and the EU Commission confirmed that Latvia meets the Maastricht criteria for euro accession. Latvia will convert to the euro on 1 January 2014.
  • 12. Swedbank – Interim report January-June 2013 Page 12 of 58 Retail  Stable net interest income  Stable deposit and lending volumes  Continued improvements to digital services Income statement Q2 Q1 Q2 Jan-Jun Jan-Jun SEKm 2013 2013 % 2012 % 2013 2012 % Net interest income 3 367 3 332 1 3 362 0 6 699 6 733 -1 Net commissions 1 536 1 589 -3 1 531 0 3 125 3 069 2 Net gains and losses on financial items at fair value 33 34 -3 41 -20 67 85 -21 Share of profit or loss of associates 197 204 -3 209 -6 401 412 -3 Other income 179 218 -18 209 -14 397 399 -1 Total income 5 312 5 377 -1 5 352 -1 10 689 10 698 0 Staff costs 866 871 -1 852 2 1 737 1 725 1 Variable staff costs 68 47 45 42 62 115 76 51 Other expenses 1 434 1 458 -2 1 485 -3 2 892 2 975 -3 Depreciation/amortisation 30 30 0 32 -6 60 64 -6 Total expenses 2 398 2 406 0 2 411 -1 4 804 4 840 -1 Profit before impairments 2 914 2 971 -2 2 941 -1 5 885 5 858 0 Credit impairments 37 55 -33 102 -64 92 123 -25 Operating profit 2 877 2 916 -1 2 839 1 5 793 5 735 1 Tax expense 586 635 -8 733 -20 1 221 1 477 -17 Profit for the period 2 291 2 281 0 2 106 9 4 572 4 258 7 Profit for the period attributable to the shareholders of Swedbank AB 2 290 2 279 0 2 103 9 4 569 4 251 7 Non-controlling interests 1 2 -50 3 -67 3 7 -57 Return on allocated equity, % 28.1 27.9 26.3 28.0 27.4 Loan/deposit ratio, % 243 246 246 243 246 Credit impairment ratio, % 0.02 0.02 0.04 0.02 0.03 Cost/income ratio 0.45 0.45 0.45 0.45 0.45 Loans, SEKbn 919 915 0 902 2 919 902 2 Deposits, SEKbn 378 371 2 367 3 378 367 3 Full-time employees 4 921 4 872 1 4 971 -1 4 921 4 971 -1 Development January-June The Swedish economy improved in the spring and early summer. Order bookings for Swedish manufacturing rose from both domestic and export markets. Investment plans are less than ambitious, however, and point to a continued decline in 2013. Despite a pickup in the economy, the number of corporate bankruptcies has risen. Swedish household optimism about their own finances grew in recent months. Low interest rates, increased real incomes and rising asset prices are benefitting Swedish households, but to date have not accelerated lending, which in March rose by 4.6 per cent at an annual rate. Profit for the period amounted to SEK 4 569m, compared with SEK 4 251m in the first half of 2012. Both income and expenses were stable and credit impairments decreased. The result was positively affected by the lower Swedish corporate tax rate. Net interest income was stable during the period compared with the first half of 2012. A stability fee refund had a positive effect of SEK 31m. The repricing of corporate credit largely offset the lower deposit margins, which were adversely affected by declining market interest rates. Stibor was unchanged during the second quarter and deposit margins were stable. The margin on new mortgages fell during the quarter, while the stock margin declined slightly since the beginning of the year. The margin on new loans was 10-15bp lower than the stock margin as of 30 June. Household deposit volume grew by 0.4 per cent from the beginning of the year. At the same time fund inflow increased. Swedbank’s share of household deposits was 21 per cent (22 per cent as of 31 December 2012). Retail’s deposits from corporate customers are unchanged from the beginning of the year. Swedbank’s market share was 17 per cent as of 31 May (16 per cent as of 31 December 2012). Mortgage lending has gradually increased in recent months, and Swedbank’s share of the net growth was 8 per cent during the period January-May 2013. In May its share of new sales was 14 per cent. Swedbank’s share of the total market was unchanged at 26 per cent (26 per cent as of 31 December 2012). Corporate lending volume has increased by SEK 1bn from the beginning of the year. The market share was 17 per cent (17). Risk weighted assets amounted to SEK 201bn, a decrease of SEK 1bn from the beginning of the year. Increased exposures were offset by positive rating migrations and by exposures with revised exposure classes. Net commission income increased by 2 per cent compared with the first half of 2012. The increase was
  • 13. Swedbank – Interim report January-June 2013 Page 13 of 58 mainly due to higher income in card payment acquiring and increased activity in Fastighetsbyrån AB (real estate brokerage), while payment commissions saw the biggest decrease. As of January 2013 Bankomat AB is gradually taking over responsibility for Swedbank’s ATMs. Swedbank pays a commission to Bankomat AB for this service. As a result, both net payment commissions and expenses will decrease. During the second quarter commissions paid to Bankomat AB amounted to approximately SEK 53m. In 2013 commissions of approximately SEK 300m are expected to be paid to Bankomat AB, with expenses decreasing by approximately the same amount. As of 30 June, 78 per cent of ATMs had been replaced. Fund volumes increased during the first half-year, with the largest inflow to private banking investment solutions, short- term fixed income funds and collective occupational pensions. Expenses for the first half-year fell by 1 per cent year- on-year. Following work to reduce manual cash handling, 277 branches, or 90 per cent of the total number, have now stopped handling cash, which has reduced transport and security expenses. Retail now has 308 branches. Expenses were unchanged during the second quarter. The cost/income ratio was 0.45 (0.45). Credit quality has remained good. Credit impairments decreased during the period, and the inflow of impaired loans is low. The bank is well prepared for an economic decline, and its continuous credit analysis contains an assessment of business cycle impacts. Migrations to better risk classes continue. The share of impaired loans was 0.18 per cent (0.19). Channels & Concepts Swedbank continues to improve its digital offering and during the second quarter introduced several new mobile features, including an OCR bill scanning, new functionality for savings and investments, and a first version of a mobile notification system when, for example, a new e-bill has arrived. In June Swedbank also launched a service where customers can call for help to get started with the Mobile Bank. Use of Swedbank’s digital services has continued to grow. The Internet Bank now has 3.5 million users ( an increase of 21 000 in the second quarter), while the Mobile Bank has 1.3 million (+63 000) and the iPad Bank has 260 000 (+47 000). Retail, Swedbank’s dominant business area, is responsible for all Swedish customers except for large corporates and financial institutions. The bank’s services are offered through our digital channels such as the Telephone Bank, Mobile Bank and Internet Bank as well as through Swedbank’s own branch network and the savings banks’ distribution network. Retail includes Channels & Concepts, which is responsible for developing, managing and driving business in our digital channels in Sweden. The various product areas are described on page 21.
  • 14. Swedbank – Interim report January-June 2013 Page 14 of 58 Large Corporates & Institutions  High business activity in Large Corporates  Increased activity in Corporate Finance  Weak fixed income trading and equity trading remains slow Income statement Q2 Q1 Q2 Jan-Jun Jan-Jun SEKm 2013 2013 % 2012 % 2013 2012 % Net interest income 851 783 9 750 13 1 634 1 478 11 Net commissions 523 419 25 396 32 942 881 7 Net gains and losses on financial items at fair value 503 579 -13 443 14 1 082 1 290 -16 Share of profit or loss of associates 0 0 0 0 6 Other income 49 33 48 12 82 17 Total income 1 926 1 814 6 1 601 20 3 740 3 672 2 Staff costs 292 287 2 290 1 579 595 -3 Variable staff costs 104 88 18 120 -13 192 225 -15 Other expenses 426 346 23 339 26 772 684 13 Depreciation/amortisation 12 13 -8 11 9 25 22 14 Total expenses 834 734 14 760 10 1 568 1 526 3 Profit before impairments 1 092 1 080 1 841 30 2 172 2 146 1 Impairment of intangible assets 56 0 4 56 4 Credit impairments 94 74 27 53 77 168 70 Operating profit 942 1 006 -6 784 20 1 948 2 072 -6 Tax expense 256 217 18 262 -2 473 701 -33 Profit for the period 686 789 -13 522 31 1 475 1 371 8 Profit for the period attributable to the shareholders of Swedbank AB 686 789 -13 522 31 1 475 1 371 8 Return on allocated equity, % 14.5 16.7 10.3 15.6 14.4 Loan/deposit ratio, % 219 185 224 219 224 Credit impairment ratio, % 0.17 0.13 0.09 0.14 0.06 Cost/income ratio 0.43 0.40 0.47 0.42 0.42 Loans, SEKbn 151 150 1 150 1 151 150 1 Deposits, SEKbn 69 81 -15 67 3 69 67 3 Full-time employees 1 031 1 040 -1 1 049 -2 1 031 1 049 -2 Development January-June The global economy is split. US growth has strengthened, while business cycle conditions in the eurozone remain weak. Several emerging markets also saw weaker than expected growth rates. Signals from the US Federal Reserve that it may taper its bond buying have led to increased volatility in the global financial markets at the same time that concerns about the Chinese economy have grown. After rising earlier in the year, stocks fell broadly in June at the same time that the bond yields have risen significantly. The result for the period was SEK 1 475m, an increase of 8 per cent year-on-year. Higher lending income in LC&I and higher income from fund and card products contributed to the improvement. The result was negatively affected by slower activity and earnings in fixed income, currency and equity trading. During the second quarter IT investments were written down by SEK 56m. The return on allocated equity was 15.6 per cent. Net interest income increased by 11 per cent compared with the first half of 2012. Lending volume rose by 1 per cent or SEK 1bn. The lending margin has expanded over time, and we are still seeing the effects of the earlier repricing of corporate loans, including after stricter regulatory requirements were introduced on capital adequacy and liquidity. Compared with the previous quarter net interest income rose by 9 per cent to SEK 851m. The margin on the loan portfolio and volumes increased slightly during the quarter. Deposit margins were stable. Business activity in LC&I remained good during the second quarter. Business volumes mainly increased in the Energy, Shipping & Offshore, and Telecoms sectors. M&A financing also had a strong second quarter. Risk weighted assets increased by SEK 2.9bn during the quarter to SEK 133.4bn. Risk weighted assets for credit risk increased by SEK 1.4bn, mainly due to increased corporate lending volumes. Risk weighted assets related to market risk increased by SEK 1.5bn, mainly due to higher currency trading activity. Net commission income increased by 7 per cent year- on-year to SEK 942m. Compared with the first quarter net commission income increased by 25 per cent to SEK 523m. A high level of corporate finance activity in Norway at the end of the quarter contributed to the increase, as did higher income from card and fund products. Continued low turnover and activity in equity markets during the quarter led to continued weak earnings in this area. Bond issuance activity remained good in both Sweden and Norway. May was an especially strong month for SEK in terms of both number of issues and volume. Swedbank’s market share for issuances by Swedish customers was 19.6 per
  • 15. Swedbank – Interim report January-June 2013 Page 15 of 58 cent for the first half-year. The corresponding figure in Norway was 16.8 per cent, making the bank the third largest player in Sweden and the second largest in Norway. Net gains and losses on financial items at fair value decreased by 16 per cent to SEK 1 082m compared with 2012, when the result from equity, fixed income and currency trading was very strong due to positive market conditions. Net gains and losses on financial items at fair value decreased by 13 per cent compared with the previous quarter as a result of continued low interest rates and low customer activity in fixed income derivatives. Moreover, risk management was complicated at the end of the quarter by turbulence in the financial markets after indications by the Federal Reserve that it may taper its bond buying, which negatively affected earnings. Total expenses increased by 3 per cent compared with 2012. Other expenses rose by 13 per cent. The increase was due to higher expenses for funds and card product sales, which were previously recognised within Retail. Intangible asset writedowns relate to IT systems and amounted to SEK 56m. Credit impairments amounted to SEK 168m in the first half-year. The share of impaired loans increased to 0.49 per cent (0.10). The increases in impaired loans and credit impairments are attributable to a few previously identified problem loans managed by the Group’s Financial Restructuring & Recovery (FR&R) unit. Credit quality in the loan portfolio remains good. Reorganisation to increase customer satisfaction and strengthen profitability LC&I is implementing a reorganisation to increase customer satisfaction and raise profitability. The organisational goal is to further develop customer relations and create new business through a more distinctive product offering. The new organisation, which took effect on 1 July 2013, is divided into the following units. Two existing units, Large Corporates and Financial Institutions, are responsible for bank lending and deposits and have overarching responsibility for customer contact. These units account for half of the business area’s revenues. Customers are served by teams of specialists in various sectors, types of companies and institutions. The Investment Banking unit, which supports customers with strategic advice and financing solutions, consists of Corporate Finance, Structured & Acquisition Finance and Debt Capital Markets units. The unit accounts for around 10 per cent of the business area’s revenue. Product responsibility for fixed income, currency and equity products has been consolidated in the Markets unit, which is responsible for trading in these products and creating a strong sales force for the various customer segments. The unit accounts for about 30 per cent of the business area’s revenue. Global Transaction Services (GTS) has been responsible since the beginning of 2013 for the bank’s transaction services for large corporate and institutional customers. It is responsible for driving and developing solutions for document payments, bank guarantees, payment services, cash management, custodial services, card management and leasing across national borders. The unit accounts for about 10 per cent of the business area’s revenue. During the quarter a new global analysis unit was created within LC&I. In addition to analysis units for fixed income, equity and credit products, it includes the Economic Research Department. This will ensure that the bank’s customers are provided a uniform macro view. Large Corporates & Institutions is responsible for large corporates, financial institutions and banks as well as for trading and capital market products. Operations are carried out by the parent bank in Sweden, branch offices in Norway, Denmark, Finland, the US and China, and through the trading and capital market operations in subsidiary banks in Estonia, Latvia and Lithuania.
  • 16. Swedbank – Interim report January-June 2013 Page 16 of 58 Baltic Banking  Good activity in the daily banking business  Net interest income increased compared with the first quarter  New operating model to achieve efficiencies Income statement Q2 Q1 Q2 Jan-Jun Jan-Jun SEKm 2013 2013 % 2012 % 2013 2012 % Net interest income 763 742 3 868 -12 1 505 1 778 -15 Net commissions 445 388 15 394 13 833 780 7 Net gains and losses on financial items at fair value 72 62 16 75 -4 134 141 -5 Other income 98 89 10 111 -12 187 217 -14 Total income 1 378 1 281 8 1 448 -5 2 659 2 916 -9 Staff costs 189 188 1 187 1 377 379 -1 Variable staff costs 9 17 -47 15 -40 26 35 -26 Other expenses 366 351 4 364 1 717 745 -4 Depreciation/amortisation 29 30 -3 28 4 59 64 -8 Total expenses 593 586 1 594 0 1 179 1 223 -4 Profit before impairments 785 695 13 854 -8 1 480 1 693 -13 Impairment of tangible assets 2 4 -50 4 -50 6 2 Credit impairments -43 -70 -39 -204 -79 -113 -338 -67 Operating profit 826 761 9 1 054 -22 1 587 2 029 -22 Tax expense 68 61 11 96 -29 129 173 -25 Profit for the period 758 700 8 958 -21 1 458 1 856 -21 Profit for the period attributable to the shareholders of Swedbank AB 758 700 8 958 -21 1 458 1 856 -21 Return on allocated equity, % 13.4 12.6 15.0 12.7 14.8 Loan/deposit ratio, % 108 109 115 108 115 Credit impairment ratio, % -0.15 -0.25 -0.69 -0.20 -0.57 Cost/income ratio 0.43 0.46 0.41 0.44 0.42 Loans, SEKbn 119 113 5 115 3 119 115 3 Deposits, SEKbn 110 104 6 100 10 110 100 10 Full-time employees 4 053 4 142 -2 4 123 -2 4 053 4 123 -2 Development January-June The Baltic countries are feeling the bite of recession, although growth remained among the strongest in the EU in the first quarter of 2013. GDP rose by 3.6 per cent in Latvia, 3.5 per cent in Lithuania, and 1.1 per cent in Estonia compared with the previous year. Growth was slowed by weaker foreign demand and lower investments. Household consumption is still strong, especially in Latvia and Estonia, due to rising incomes and robust confidence. The export sector is slightly stronger in Lithuania. The result amounted to SEK 1 458m for the first half- year, against SEK 1 856m in the same period a year earlier. The decrease was mainly due to lower net interest income. Net interest income declined by 12 per cent in local currency compared with 2012. Lower market rates negatively affected net interest income, while increased deposit volumes and a slightly larger loan portfolio had a positive impact. Fluctuations in exchange rates reduced net interest income by SEK 60m. Compared with the previous quarter net interest income rose by 2 per cent in local currency. Work has been initiated to reprice business that does not meet the desired risk-adjusted returns. Exposures whose returns requirements cannot be met will be divested when possible. Lending volumes increased by 3 per cent in local currency from the previous year. The increase is mainly attributable to the corporate segment. During the second half of 2012 loan portfolios with a volume of SEK 1.6bn were acquired from Hipoteku Bank in Latvia. The first signs of improvement in new household lending have been seen in Estonia and Lithuania in recent months. Swedbank’s market share in lending was 28 per cent as of 31 May (28 per cent as of 31 December 2012). Deposits increased by 9 per cent in local currency from the previous year. Corporate and private deposits both increased significantly year-on-year. The Latvian deposit portfolio increased the most, with the acquisition of Hipoteku Bank accounting for SEK 1.8bn of the increase. Swedbank’s market share for deposits was 30 per cent as of 31 May (31 per cent as of 31 December 2012). The loan-to-deposit ratio was 108 per cent (108 per cent as of 31 December 2012). Net commission income increased by 11 per cent in local currency compared with the first half of 2012. The increase was mainly due to higher payment commissions, supported by increased customer activity and retail revenue. The number of active customers has grown by 115 000 in the last year to nearly 2.6 million. Higher commission income from fund management also contributed to net commission income growth.
  • 17. Swedbank – Interim report January-June 2013 Page 17 of 58 Compared with the previous quarter net commission income rose by 14 per cent in local currency. Expenses stayed flat in local currency from the previous year, including euro transition costs of SEK 11m in Latvia. The cost/income ratio was 0.44 (0.42). To increase efficiencies, a new Baltic Banking operating model has been created and launched in 2013. The new model will improve collaboration across the region. In addition, the bank is looking into the possibility of reducing the number of branches while at the same time improving service in digital channels. Net recoveries amounted to SEK 113m, compared with SEK 338m for the first half-year 2012. Recoveries were generated in the corporate portfolios in all three countries, while the mortgage portfolios generated minor impairments. Impaired loans continued to decrease during the first half-year in all three Baltic countries. Impaired loans, gross, amounted to SEK 7.3bn (SEK 12.8bn on 30 June 2012). The decrease was due to amortisations, write-offs and loans that have started to perform, while the inflow of new impaired loans was limited. Credit quality has strengthened through a gradual increase in new lending, which carries a lower risk. Risk-weighted assets decreased by SEK 3bn during the first half-year to SEK 92bn, mainly driven by the corporate portfolio. Risk-weighted assets have stabilised or decreased in most of the lending portfolios due to an improved risk profile, where improved ratings and collateral have had a positive effect. Exchange rate effects increased risk-weighted assets by SEK 2bn. During the quarter Swedbank received recognition in all three Baltic countries. In Estonia it was named the most reputable large company for the sixth consecutive year. In similar surveys in Latvia and Lithuania Swedbank ranked second and third, respectively. Latvia is preparing to convert to the euro on 1 January 2014. In June the European Central Bank and the EU Commission confirmed that Latvia fulfils the Maastricht criteria. The bank’s expenses related to the euro transition are estimated at SEK 90m. Baltic Banking has business operations in Estonia, Latvia and Lithuania. The bank’s services are sold through Swedbank’s own branch network, the Telephone Bank and the Internet Bank. The various product areas are described on page 21.
  • 18. Swedbank – Interim report January-June 2013 Page 18 of 58 Group Functions & Other Income statement Q2 Q1 Q2 Jan-Jun Jan-Jun SEKm 2013 2013 % 2012 % 2013 2012 % Net interest income 426 495 -14 56 921 -57 Net commissions 1 -25 -4 -24 -27 -11 Net gains and losses on financial items at fair value -312 -118 18 -430 40 Share of profit or loss of associates 0 2 1 2 1 100 Other income 303 297 2 348 -13 600 698 -14 Total income 418 651 -36 419 0 1 069 655 63 Staff costs 812 787 3 818 -1 1 599 1 649 -3 Variable staff costs 51 73 -30 12 124 61 Other expenses -604 -600 1 -540 12 -1 204 -1 012 -19 Depreciation/amortisation 97 98 -1 148 -34 195 292 -33 Total expenses 356 358 -1 438 -19 714 990 -28 Profit before impairments 62 293 -79 -19 355 -335 Impairment of intangible assets 114 0 0 114 0 Impairment of tangible assets 200 81 120 67 281 162 73 Credit impairments 0 1 0 1 0 Operating profit -252 211 -139 81 -41 -497 -92 Tax expense 3 63 -95 -44 66 -196 Profit for the period from continuing operations -255 148 -95 -107 -301 -64 Profit for the period from discontinued operations, after tax -1 887 -390 -341 -2 277 -620 Profit for the period -2 142 -242 -436 -2 384 -921 Profit for the period attributable to the shareholders of Swedbank AB -2 142 -243 -436 -2 385 -921 Non-controlling interests 0 1 0 1 0 Full-time employees 4 346 4 359 0 5 545 -22 4 346 5 545 -22 Development January-June Group Functions & Other comprises the bank's Group functions (including Group Products) and Ektornet. Group Functions & Other also includes the banking operations in Russia and Ukraine, which are reported as discontinued operations as of the first quarter 2013. Income for Group Functions & Other consists of net interest income and net gains and losses on financial items, which mainly come from Group Treasury. Other income primarily consists of revenue from the savings banks as well as sales revenue and operating income from Ektornet. Income amounted to SEK 1 069m (655). Expenses for Group Functions & Other decreased by 28 per cent from the previous year to SEK 714m (990). Excluding the net of services purchased and sold internally, expenses fell by 7 per cent to SEK 3 408m (3 674). The decrease was mainly due to lower staff costs as a result of a reduction in the number of employees as well as lower costs for IT operations and depreciation. Group Products Established on 1 January 2013, Group Products (GP) consists of around 1 800 employees in Sweden, Estonia, Latvia and Lithuania. GP is responsible for a large part of Swedbank’s product areas with a strategy to support the business areas by reducing the complexity of the product range and simplifying sales in the various distribution channels. The product areas GP is responsible for – cards, payments, lending, deposits, insurance and asset management – are described in more detail on page 21. GP also comprises the subsidiary Swedbank Franchise AB, which in turn includes the real estate and business brokerages and a legal service provider. In GP’s revenue and expense model, revenue from Swedbank’s customers is posted by each business area and GP receives compensation from the business area to cover its expenses. GP’s external revenue largely comes from the savings banks for the products their customers use. Expenses, excluding the net of services purchased and sold internally, amounted to SEK 1 583m (1 689) in the first half year 2013. The decrease was mainly due to lower IT maintenance expenses thanks to increased efficiencies as well as lower mailing costs resulting from increased digitalisation. Group Treasury Group Treasury is responsible for the bank’s funding, liquidity and capital planning, including internal control and pricing within these areas. The Group’s equity is allocated to each business area on the basis of capital adequacy rules and how much capital is needed based on the bank's Internal Capital Adequacy Assessment Process (ICAAP). Group Treasury prices funding and liquidity in an internal pricing system, where the most important parameters for setting internal rates are maturity, interest fixing period, currency, and the need for liquidity reserves. Swedbank is conducting a project to further refine internal rate setting control during 2013. Group Treasury’s result over time should be nearly nil, with the exception of earnings that may arise in debt and liquidity management within given risk mandates. The fee paid to the Swedish National Debt Office for government guaranteed funding is charged against Group Treasury. Risk hedging by Group Treasury is
  • 19. Swedbank – Interim report January-June 2013 Page 19 of 58 generally achieved with financial derivatives. The volatility in results over time is largely due to accounting- based fluctuations in these hedges. Net interest income for the first half-year amounted to SEK 990m, compared with SEK 18m in the same period of 2012. Of the SEK 972m change, SEK 133m is due to lower fees for the government guaranteed funding. Repurchases of covered bonds in particular and the fact that the bank’s internal prices better reflect its funding costs have positively affected net interest income. Treasury’s net interest income has been temporarily strengthened by positions that have benefitted from lower market rates and to a certain extent by falling credit and basis swap spreads. Consequently, net interest income is likely to trend lower in 2013 as position extensions are made at lower interest rates and spreads. The tender offer during the second quarter to repurchase outstanding government guaranteed bonds is expected to positively affect net interest income by about SEK 146m in the year ahead. Net gains and losses on financial items at fair value amounted to SEK -462m in the first half-year, compared with SEK 16m in the previous year. The first half year 2012 net gains and losses on financial items was negatively affected by SEK 250m due to a correction related to outstanding subordinated loans. The result for the period was negatively affected by SEK 362m by repurchases of covered and senior bonds. Management of the bank’s liquidity portfolio reduced net gains and losses on financial items at fair value by SEK 55m, partly because the surplus values in certain portfolio holdings are declining in pace with their remaining maturities. The liquidity portfolio has an average remaining maturity of about 2 years. Net gains and losses on financial items amounted to SEK -343m during the second quarter, of which the tender offer for outstanding government guaranteed bonds had a negative effect of SEK 107m and other repurchases had a negative effect of SEK 103m. Interest rate fluctuations accounted for most of the remaining valuation effects during the quarter. Russia and Ukraine During the second quarter Swedbank finalised the sale of its Ukrainian subsidiary, which was reported together with the Russian operations as discontinued operations during the first quarter. This is part of the process of concentrating Swedbank’s operations in Sweden and the three Baltic countries. As previously announced, the sale generated a negative cumulative exchange difference of SEK 1 875m (due to the Ukrainian hryvnia’s depreciation against the Swedish krona), which was reclassified to the income statement during the second quarter as discontinued operations. When the cumulative exchange difference arose, mainly from 2007 to 2009, equity was directly impacted through other comprehensive income. The reclassified item therefore does not affect Swedbank’s capital, capitalisation or cash flow and will not be taken into account when the Board of Directors announces its dividend proposal for 2013. The result in Ukraine, which is recognised in discontinued operations, amounted to SEK -2 236m during the first half-year (-668), of which SEK 340m is a writedown due to the divestment and SEK 1 875m relates to the reclassification. The result for Russia amounted to SEK -44m (48) during the period. Following the sale of the subsidiary, the remaining exposure in Ukraine consists of properties managed by Swedbank’s subsidiary Ektornet; see below. Swedbank has ceased accepting new business in Russia and is winding down its remaining operations. Swedbank’s net lending in Russia (including leasing) is approximately SEK 2bn. The lending portfolio in Russia, consisting mainly of good quality corporate loans, will decrease through amortisation. Swedbank has real estate assets worth about SEK 128m in Russia, which also will be sold. Ektornet Ektornet manages and develops Swedbank’s repossessed assets to recover as much value as possible. The takeover phase is largely complete. The focus going forward is on selling the property holdings. The value of repossessed assets decreased during the period to SEK 3 226m (SEK 4 606m as of 31 December 2012). Assets taken over 30 Jun 31 Dec SEKm 2013 2012 Sweden 48 374 Finland 0 281 Estonia 243 304 Latvia 1 354 1 665 Lithuania 237 351 USA 881 1 217 Ukraine 410 364 Total properties 3 173 4 556 Shares 53 50 Total 3 226 4 606 During the first half-year properties were sold for SEK 1 501m (846) with an aggregate capital gain of SEK 128m (107). Sales proceeds during the second quarter amounted to SEK 511m (349) with a gain of SEK 71m (53). The sales during the quarter mainly consisted of a hotel in the US, a commercial property in Ukraine and a large holding of apartments in Latvia. During the period properties were acquired for SEK 180m (765), mainly in Ukraine as part of the discontinuation of Swedbank’s operations there. Property values were written down by SEK 281m (162), of which SEK 200m (120) in the second quarter. The result for the period was SEK -281m (-206). Expenses amounted to SEK 229m (324). The number of employees at the end of the period decreased to 138, compared with 508 (of which 305 hotel employees) as of 30 June 2012. The number of properties, including condominiums and the like, was 2 367 (2 528 at the beginning of the year), of which 1 392 were in Latvia (1 695 at the beginning of the year). Group Functions & Other comprises, in addition to Group Functions, Ektornet and the banking operations in Russia and Ukraine which are being wound down. Group Functions operate across the business areas and serve as strategic and administrative support for them. Group Functions include Group Products, Group IT, Accounting & Finance (including Group Treasury), Risk (including Compliance), Corporate Affairs (communications, strategic marketing and community affairs), HR and Legal. The Group Executive Committee and Internal Audit are also included in Group Functions.
  • 20. Swedbank – Interim report January-June 2013 Page 20 of 58 Eliminations Income statement Q2 Q1 Q2 Jan-Jun Jan-Jun SEKm 2013 2013 2012 2013 2012 Net interest income 2 1 -1 3 -2 Net commissions 20 17 22 37 34 Net gains and losses on financial items at fair value 0 0 0 0 0 Other income -77 -59 -53 -136 -113 Total income -55 -41 -32 -96 -81 Staff costs 0 0 0 0 0 Variable staff costs 0 0 0 0 0 Other expenses -55 -41 -32 -96 -81 Depreciation/amortisation 0 0 0 0 0 Total expenses -55 -41 -32 -96 -81 Group eliminations mainly consist of eliminations of internal transactions between Group Functions and the other business areas.
  • 21. Swedbank – Interim report January-June 2013 Page 21 of 58 Product areas Swedbank intends to gradually expand its product reporting. This is being done outside the consolidated accounts, which means that the figures cannot be traced to specific lines in the financial statements. Responsibility for the product units currently rests with Group Products within Group Functions & Other, but the results are reported in several legal units and in the three business areas. Card business Swedbank issues cards and acquires card payments from merchants in all its home markets as well as in Denmark and Norway. All card operations are handled within the bank, with the exception of the credit card operations in Sweden, Denmark and Norway, which are conducted through Entercard AB, a joint venture with Barclays Bank. In its four home markets as a whole, Swedbank has a market share for card payment acquisitions and issuing of nearly 50 per cent. As a card payment acquirer, Swedbank enables retailers to accept payment through card terminals and online. Revenue comes mainly from the transaction prices retailers pay for administration and a payment guarantee. Part of this revenue is passed on as commissions to the issuers whose cards are used in the stores. Swedbank is Europe’s fifth largest card payment acquirer measured in number of transactions. As a card issuer, the bank generates revenue from fees charged to customers for access to a card, foreign exchange fees for foreign purchases and interest income from outstanding credit card balances. Transaction revenue is also generated from card payment acquisition companies when sales are made with a Swedbank card. The number of transactions made by card versus cash is increasing in all of Swedbank’s home markets. Card volumes are also growing as a function of underlying economic growth. A large share of Swedbank’s transaction revenue is based on the number of transactions, not solely on the transactions’ value, which makes issuing and acquiring revenue less volatile during periods of slower economic growth. In Sweden nearly 80 per cent of store purchases are made by card, giving it one of the highest levels of card usage in the world, with volume growth of about 5 per cent per year. In Estonia the percentage of card transactions is also high (55 per cent), with an annual growth rate of about 8 per cent. In Latvia and Lithuania card use is lower (35 and 20 per cent, respectively), but the growth rate is expected to be higher than in Sweden and Estonia. Swedbank’s total card revenue amounted to SEK 1 970m during the first half-year, an increase of 7 per cent year-on-year. The positive revenue trend was mainly due to an increase in transactions (both card acquiring and card issuing) as well as higher credit volumes in EnterCard. Card related income Jan-Jun Jan-Jun SEKm 2013 2012 % Card acquiring 373 354 5 of which Nordic countries 315 301 5 of which Baltic countries 58 53 9 Card issuing 796 708 12 of which Sweden 527 461 14 of which Baltic countries 269 247 9 Net interest income, credit cards 146 142 3 of which Sweden 32 29 10 of which Baltic countries 114 113 1 Entercard* 655 632 4 Total Card related income 1 970 1 836 7 * Swedbank's share of Entercard's total income. Entercard is consolidated into Swedbank Group by the equity method. The volume of processed payments increased by 9 per cent to SEK 208bn compared with the first half of 2012, the market as a whole also grew by 9 per cent. The number of transactions processed rose by 11 per cent to 850 million, the market as a whole also grew by 11 per cent. Income is not growing at the same pace as the volume of acquired payments or the number of acquired transactions because of price pressure from increased competition and tighter regulations. The expansion of the payment business to Norway and Denmark is generating a significant share of the total inflow of new acquiring customers, transactions and income. Growth is higher in the Baltic countries than in Sweden, but the Nordic countries still account for about 90 per cent of card processing volumes. In the Baltic countries the fees paid by card acquirers to card issuers have been renegotiated, resulting in lower compensation. In card payment acquisitions, one of Swedbank’s most important growth areas is rapidly expanding e- commerce, where we as acquirer have a slightly lower market share than, for example, in the grocery and retail sectors due to competition and other payment instruments. Swedbank is focused on expanding and improving its e-commerce offering, where its processing volume increased by over 50 per cent compared with the first half of 2012. The number of card purchases increased by 11 per cent during the first half-year to 570 million. In Latvia and Lithuania the increases were 18 and 15 per cent, respectively. The number of cards issued by Swedbank rose by 1 per cent to 7.8 million compared with the first half of 2012. In card issuance Swedbank sees growth opportunities in corporate cards, where we have historically been weaker and where our large base of small business customers offers significant potential. As a first step an improved business debit card was launched in Sweden in 2012. To date two thirds of our corporate customers have chosen the new card. In 2012 a long-term agreement was signed with MasterCard as the main card network supplier for both private and corporate services, which has resulted in better customer offerings and lower production costs.
  • 22. Swedbank – Interim report January-June 2013 Page 22 of 58 Swedbank is currently the tenth largest card issuer in Europe based on number of transactions. Jan-Jun Jan-Jun Key ratios, cards 2013 2012 % Card acquiring transactions, millions 850 764 11 Card acquiring volume, SEKbn 208 191 9 Issued cards, millions 7.8 7.7 1 Card purchases (POS), millions 570 515 11 POS/total card turnover, % 65 63 Insurance business Swedbank has life insurance operations in Sweden as well as life and non-life operations in the Baltic countries. In addition, Swedbank offers non-life insurance in Sweden through a third-party solution with the insurance company Tre Kronor. Insurance products are sold through the distribution channels of Swedbank and the savings banks. Premium payments Jan-Jun Jan-Jun SEKm 2013 2012 % Sweden 8 450 7 930 7 of which collective occupational pension 2 833 3 120 -9 of which endowment insurance 3 984 3 340 19 of which occupational pension 976 852 15 of which risk insurance 347 326 7 of which other 310 292 6 Baltic countries 489 484 1 of which life insurance 303 301 1 of which non-life insurance 186 183 2 Sweden Swedbank Försäkring AB, the Group’s Swedish life insurance company, is the sixth largest company in the Swedish life insurance market, with a market share of about 7 per cent in terms of premium income. Assets under management increased during the period by 6 per cent to SEK 110bn, of which SEK 96bn relates to unit linked insurance and custody insurance. At the same time premium income rose by 7 per cent to SEK 8.4bn. An ageing population and shift in responsibility from society to the individual is sparking demand for pension and insurance products. The largest potential for Swedbank in Sweden today is in risk products such as life and health insurance as well as in occupational pensions. Today only 20 per cent of Swedbank’s and the savings banks’ corporate customers with revenues of SEK 1-100m have an occupational pension solution for their employees from Swedbank Försäkring. Premium income from occupational pensions amounted to SEK 3.8bn (4.0) during the first half-year, of which occupational pensions excluding collective pensions increased by 15 per cent year-on-year to SEK 976bn. To increase sales of occupational pensions, Swedbank Försäkring will launch an updated pension plan package during the year. As of 1 July Swedbank Försäkring is a company of choice for the collectively negotiated occupational pension plan (ITP) for 2013-2018. The fees for ITP are low, but it is important to be able to offer collective occupational pensions as part of a total offering to the 1.5 million private sector employees. Swedbank Försäkring offers 22 funds with the highest aggregate ratings of the companies. Half of the funds are from Robur. Demand for risk protection insurance remains high. During the period sales of the Swedbank private protection concept reached over 51 000 insurance products, an increase of 35 per cent year-on-year. We are in the process of simplifying processes and routines and improving efficiencies. For example, administrative paperwork has now been completely digitised, and simplified risk rules have made it easier and more expedient to manage customers. An automated sales workflow for risk protection insurance means that 75 per cent of cases can be processed at the time of sale. From March to June 140 000 customers of the bank who previously had free loan protection were offered a new, fee-based life insurance product. Over 95 000 have been sold, representing an annual premium of nearly SEK 75m. Assets under management 30 Jun 31 Dec SEKbn 2013 2012 % Sweden 109.5 103.4 6 of which collective occupational pension 43.7 38.2 14 of which endowment insurance 46.8 48.6 -4 of which occupational pension 10.9 8.7 25 of which other 8.1 8.0 2 Baltic countries 3.2 3.3 -3 of which life insurance 3.2 3.3 -3 Baltic countries In Estonia, Latvia and Lithuania the market shares for life insurance as of 31 May are 39, 14 and 22 per cent, respectively, making Swedbank the largest life insurer in the Estonian and Lithuanian markets. Life insurance operations are divided into risk insurance and savings products. Swedbank mainly focuses on risk insurance for existing loan customers, where it sees great growth potential due to an inadequate social welfare system. Premium income from risk insurance rose by 8 per cent in local currency compared with 2012 to SEK 55m. Sales were especially strong for credit life, a life insurance product tied to a bank loan, which increased by 5 per cent in local currency. Around 32 per cent of the bank’s borrowers currently have credit life. Premium payments for the total Baltic life insurance operations increased by 4 per cent in local currency to SEK 303m compared with the previous year. Assets under management decreased by 1 per cent in local currency to SEK 3.2bn, of which SEK 1.8bn relates to unit linked insurance. The market shares for non-life insurance in Estonia, Latvia and Lithuania are 14, 3 and 1 per cent, respectively. In non-life insurance Swedbank mainly offers solutions for private customers. The largest product areas are auto and homeowners insurance. Since auto and home sales have fallen in recent years, the focus has been on boosting sales by launching new and simpler products. During the second quarter, for example, a loan protection product was launched to cover loan expenses in the event of a customer’s illness or job loss. Total premium income for non-life insurance in the Baltic countries amounted to SEK 186m during the period, an increase of 6 per cent in local currency.
  • 23. Swedbank – Interim report January-June 2013 Page 23 of 58 Revenue Swedbank’s aggregate insurance revenue amounted to SEK 935m (964) during the first half-year. Swedish life insurance accounts for SEK 728m (719). The increase in Sweden was mainly due to an improved risk result. A portion of the risk insurance premium is continuously allocated to cover future claims. Provisions are based on assumptions about unreported claims that have occurred and expectations about future claims, among other things. An extensive analysis primarily of unreported claims that have occurred has led to changes in assumptions. These changes facilitated a reversal from reserves during the first half-year, which led to increased insurance revenue. Falling interest rates have reduced the return on shareholders´ equity, however, which has led to lower revenue. As a result, the total increase for Swedish life insurance is 1 per cent. Revenue from non-life operations in Sweden also rose, and there are now nearly 215 000 contracts, an increase of 9 per cent year-on-year. Revenue for the Baltic life and non-life operations decreased during the first half-year. Falling interest rates have led to a lower return on assets, primarily for life insurance operations, while the risk result there was stable. Revenue for Baltic non-life operations fell by 28 per cent in local currency to SEK 79m. The decrease was mainly due to a lower risk result as a result of higher claims than in the previous year. Claims during the period are in line with the average for previous years, while the level of claims in the previous year was relatively low. Insurance related income Jan-Jun Jan-Jun SEKm 2013 2012 % Sweden 766 740 4 of which life insurance 728 719 1 of which non-life insurance 38 21 78 Baltic countries 169 224 -25 of which life insurance 90 110 -19 of which non-life insurance 79 114 -30 Total insurance related income 935 964 -3 Asset management operations Swedbank’s asset management operations are conducted through the Swedbank Robur group in Swedbank’s four home markets and Norway. In total, Swedbank Robur offers around 120 funds as well as discretionary asset management, including management of pension assets. Fund assets under management amounted to SEK 561bn, of which SEK 541bn was in Sweden, where the market share was 24 per cent in terms of assets under management. Discretionary assets under management amounted to SEK 257bn. During the first half-year the total net inflow was primarily to mixed funds, while fixed income funds had a net outflow. The total net inflow to Swedbank Robur’s funds in Sweden was SEK 7.7bn, corresponding to a market share of 16 per cent during the first half-year. The positive net flow was mainly due to a high level of activity at Swedbank’s and the savings banks’ branches, where flows mainly went to private banking investment solutions, short-term fixed income funds and collective occupational pensions. Measures to clarify and simplify the customer offering are continuing in 2013. During the first half-year seven funds were either merged or shut down. The share of funds with returns surpassing their comparative indices during the first half-year was 32 per cent (30 per cent for the same period in 2012). The average rating according to Morningstar has improved and is now 3.36 (3.11), the second best among comparable companies. Asset management Jan-Jun Jan-Jun Key ratios, SEKbn 2013 2012 % Total income, SEKm 1 972 1 834 8 Asset under management 561 465 21 of which Sweden 541 447 21 of which Baltics 18 16 13 of which Norway 2 2 0 Discretionary asset management 257 275 -6 of which Sweden 255 274 -7 of which Baltics 2 1 100 Income for capital market products amounted to SEK 1 972m, which is 8 per cent higher than the same period in 2012. The improvement was mainly from an increase in average capital as a result of higher equity prices, but also from the positive net flows. Excluding the Folksam LO funds consolidated in the fourth quarter of 2012, average fund assets grew by 10 per cent. Income, which increased by SEK 48m from the previous quarter, was positively affected by the market’s development at the beginning of the quarter. Despite a weaker finish, average assets under management rose by 3 per cent. Income from institutional management, excluding Swedbank Robur’s funds, amounted to SEK 46m. Compared with the same period in 2012 income fell by SEK 23m, mainly because the Folksam LO funds are managed by Swedbank Robur since the fourth quarter. Performance-related income received during the first half of 2013 decreased by SEK 7m year-on-year. In June the Mobile Bank added a new savings and investment functionality, allowing users to easily buy, sell and trade fund shares, track their holdings and maintain an overview of their savings. Payment operations Swedbank is the market leader in payment and cash management products in its four home markets. Growth in the payment area is based on economic growth and on customers increasingly using means of payment other than cash. The payment area is strongly affected by changes in the operating environment, partly due to technological developments but also to European legislation, where the aim is to facilitate cross-border trade in products and services. The development of a common payment zone for the euro enables the bank to offer services to customers with European operations without having to set up business in every country. At the same time a common payment zone creates greater competition. Online payment services are an important growth area for Swedbank. Today over 2.9 million customers in Sweden and 2.1 million in the Baltic countries have access to payment services through the Internet Bank and the Mobile Bank. During the first half of 2013 the number of transactions through these channels grew by 7.8 per cent year-on-year.