SlideShare una empresa de Scribd logo
1 de 2
Descargar para leer sin conexión
FOR IMMEDIATE RELEASE 
October 3, 2012                                                                                      

 
VICTORIA REAL ESTATE MARKET AT A STANDOFF AS PRICES REMAIN STEADY 
 (revised due to error*) 

VICTORIA, BC—REALTORS® across Vancouver Island are experiencing a “wait and see” attitude amongst buyers 
and sellers alike. The result? Prices remain steady but sales numbers are down in some categories. 

Total MLS® residential sales for September 2012 were 400 compared to 435 in September 2011. During the month, 
216 single family homes sold throughout the Victoria Real Estate Board’s region, just 28 fewer than the 244 sold in 
September 2011. The average price for single family homes sold in Greater Victoria last month was $589,361, 
down from September 2011’s average of $622,393. The median price is down by $16,500 to $517,500 over 
September 2011. There are 5,025 active listings. 

“We are at a bit of a standoff in the Greater Victoria real estate market,” says Carol Crabb, President of the Victoria 
Real Estate Board. “Buyers are waiting for prices to go down, but there are no economic indicators to show that 
will happen. Sellers are pricing their properties reasonably for the current market, which is reflected by the fact 
that single family homes are selling for an average 96% of list price. 

“The median price of a single family home is only 1.5% lower than last year and that number has held steady for 
the last five months,” Crabb says. 

Condominium and manufactured home sales are virtually unchanged over September 2011 (approximately 1% 
each), while townhomes sales have declined 10%.  

Total Waterfront Single Family Dwellings sold:                 18, up 7 sales from 2011 
Total Non‐waterfront Single Family Dwellings sold:            198, down 35 sales from September 2011 
Single Family Dwellings sold over $1 million:                 14 (0 over $2 million) 
 
*The original news release issued on October 1, 2012 contained an error. We apologize for any inconvenience this 
may have caused. 
 
STATS QUICK REFERENCE 
September 2012, MLS® Real Estate Sales and Average Prices, Greater Victoria 

                             2012 ‐ September                           2012 ‐ August                    2011 ‐ September 
                         No of  Average   Median              No of  Average           Median     No of  Average        Median 
                         Sales  Price $  Price $              Sales  Price $           Price $    Sales   Price $       Price $ 
    Single Family          190  589,361  518,500                215 590,843            530,000      212  622,393        535,000
    Gr. Victoria         
    Single Family           26  595,452  517,202                   25    565,418       460,000          32    517,734   412,500
    Other Areas 
    Total* Single          216  595,452  517,500                  240    588,195       526,250      244       608,668   525,000
    Family All areas 
    Condos                 127  320,304  263,450                  127    320,650       262,900      128       332,490   279,900
    Townhomes               46  391,291  378,500                   47    432,459       369,000       52       436,039   391,000
    Manufactured            11  135,036  148,000                   16    131,069       106,450       12       119,000    92,500
    Homes 
    TOTAL                  400                                    430                               436 
    RESIDENTIAL 
    TOTAL SALES           419                                   462                                 458 
    TOTAL ACTIVE        5,025                                 5,034                               4,940 
    LISTINGS 
‐   2   ‐ 


September 2012, MLS® R
                     Real Estate Sales and Six‐Mo
                                                onth Average P
                                                             Prices over August 2012 

Number of Sales (Gr.
                   . Victoria only
                                 y) September
                                            r 2012                                          COMPAR
                                                                                                 RED TO AUGU
                                                                                                           UST 2012 


SINGLE FAMILY                                               CONDOS 
                                                                 S                                     TO
                                                                                                        OWNHOMES 
     190                                       127                                         42 
  ‐ 11.63%%                       
                                               0%                                      ‐ 8.70% 
Six‐Mont
       th Average P
                  Price (Gr. Vic ctoria only) Se   eptember 201  12              COMPARED TO AUGUST 2012 


SINGLE FAMILY                                                  CONDOS                                TOWNHOMES
                                                                                                             S 
  $599,427 7                                                 $321,73 30                               $416,869 
  ‐ 1.30%                                                      ‐ 0.60%
                                                                     %                                  ‐ 0.51% 
Number of Sales (All Areas) Septe
                                ember 2012                                            CO
                                                                                       OMPARED TO AUGUST 201
                                                                                                           12 


SINGLE FAMILY                                               CONDOS 
                                                                 S                                        TOWNHOMES
                                                                                                                  S 
    216                                        127                                          46 
‐ 10.00%                          
                                                0%                                      ‐ 2.13% 
Six‐Mont
       th Average P
                  Price (All Are eas) September 2012                             CO
                                                                                  OMPARED TO     O AUGUST 201
                                                                                                            12 


SINGLE FAMILY                                                CONDOS
                                                                  S                                  TOWNHOMES
                                                                                                             S 
  $597,2022                                                 $320,7779                                 $414,338 
   ‐ 0.82%                                                  ‐ 0.60%                                     ‐ 0.72% 
 
* Total Sin
          ngle Family Alll Areas includees Shawnigan Lake/Malaha     at, Gulf Islandss and Up Islan
                                                                                                  nd 
 
While the use of averagee price informaation can be usseful in establis
                                                                      shing trends when applied ov ver a period of
                                                                                                                 f 
           six months or longer, the Vict
time, e.g. s                            toria Real Estate Board cautions that an av verage price do
                                                                                                  oes not indicate
                                                                                                                 e the 
actual valu
          ue of any partic
                         cular property.. Those requiring specific info
                                                                      ormation on pr roperty values should contacct a 
REALTOR®. 

                                                                          ‐ 30 – 
 
For information: 
Maggie Kerrr‐Southin APR 
Manager, Communications  
           al Estate Board  
Victoria Rea
Direct Phone: 250.920.4652 2; Cell: 250.516.5
                                            5596 
Email: mkerrrsouthin@vreb.  .org 
 

Más contenido relacionado

La actualidad más candente

NYC action plan-review
NYC action plan-reviewNYC action plan-review
NYC action plan-reviewtonymaull92
 
Case-Shiller November 2012
Case-Shiller November 2012Case-Shiller November 2012
Case-Shiller November 2012Harriet Stopher
 
Metro Boston Multi-Family Housing Activity Report, December 2012
Metro Boston Multi-Family Housing Activity Report, December 2012Metro Boston Multi-Family Housing Activity Report, December 2012
Metro Boston Multi-Family Housing Activity Report, December 2012Unit Realty Group
 
Boulder County Real Estate Statistics February 2013
Boulder County Real Estate Statistics February 2013Boulder County Real Estate Statistics February 2013
Boulder County Real Estate Statistics February 2013Neil Kearney
 
2012 02 Vreb Statistics Statistical Digest (2)
2012 02 Vreb Statistics  Statistical Digest (2)2012 02 Vreb Statistics  Statistical Digest (2)
2012 02 Vreb Statistics Statistical Digest (2)Tara Lynn
 
Pima County, AZ Market Data Report - 2012 December - Coldwell Banker Resident...
Pima County, AZ Market Data Report - 2012 December - Coldwell Banker Resident...Pima County, AZ Market Data Report - 2012 December - Coldwell Banker Resident...
Pima County, AZ Market Data Report - 2012 December - Coldwell Banker Resident...Marc Krebs
 
How can the American Automotive Association Revive Interest in American aut...
How can the American  Automotive Association Revive Interest in American  aut...How can the American  Automotive Association Revive Interest in American  aut...
How can the American Automotive Association Revive Interest in American aut...ujiroveron
 
Nielsen - Evolving Markets and consumer e-book purchasing behavior
Nielsen - Evolving Markets and consumer e-book purchasing behaviorNielsen - Evolving Markets and consumer e-book purchasing behavior
Nielsen - Evolving Markets and consumer e-book purchasing behaviorIfBookThen
 
Retail mania in india
Retail mania in indiaRetail mania in india
Retail mania in indiavinay jha
 
nvr AnnualReport2004
nvr AnnualReport2004nvr AnnualReport2004
nvr AnnualReport2004finance40
 
Daily livestock report aug 24 2012
Daily livestock report aug 24 2012Daily livestock report aug 24 2012
Daily livestock report aug 24 2012joseleorcasita
 
Sr mag mar2013stats13022194344.2-6
Sr mag mar2013stats13022194344.2-6Sr mag mar2013stats13022194344.2-6
Sr mag mar2013stats13022194344.2-6Sarasota Real Estate
 
pulte homes 91DC7C77-0015-45F1-A981-8387FF35D0E1_phm_InvestorPresentation200812
pulte homes 91DC7C77-0015-45F1-A981-8387FF35D0E1_phm_InvestorPresentation200812pulte homes 91DC7C77-0015-45F1-A981-8387FF35D0E1_phm_InvestorPresentation200812
pulte homes 91DC7C77-0015-45F1-A981-8387FF35D0E1_phm_InvestorPresentation200812finance42
 

La actualidad más candente (20)

Sarasota Market Stats feb2012
Sarasota Market Stats feb2012Sarasota Market Stats feb2012
Sarasota Market Stats feb2012
 
NYC action plan-review
NYC action plan-reviewNYC action plan-review
NYC action plan-review
 
Case-Shiller November 2012
Case-Shiller November 2012Case-Shiller November 2012
Case-Shiller November 2012
 
Feb2013 stats.3 8
Feb2013 stats.3 8Feb2013 stats.3 8
Feb2013 stats.3 8
 
March Armstrong Spallumcheen Residential Real Estate Market Analysis
March Armstrong Spallumcheen Residential Real Estate Market AnalysisMarch Armstrong Spallumcheen Residential Real Estate Market Analysis
March Armstrong Spallumcheen Residential Real Estate Market Analysis
 
Metro Boston Multi-Family Housing Activity Report, December 2012
Metro Boston Multi-Family Housing Activity Report, December 2012Metro Boston Multi-Family Housing Activity Report, December 2012
Metro Boston Multi-Family Housing Activity Report, December 2012
 
Sarasota Market Stats December
Sarasota Market Stats DecemberSarasota Market Stats December
Sarasota Market Stats December
 
Boulder County Real Estate Statistics February 2013
Boulder County Real Estate Statistics February 2013Boulder County Real Estate Statistics February 2013
Boulder County Real Estate Statistics February 2013
 
March2013 stats.3 6
March2013 stats.3 6March2013 stats.3 6
March2013 stats.3 6
 
2012 02 Vreb Statistics Statistical Digest (2)
2012 02 Vreb Statistics  Statistical Digest (2)2012 02 Vreb Statistics  Statistical Digest (2)
2012 02 Vreb Statistics Statistical Digest (2)
 
Pima County, AZ Market Data Report - 2012 December - Coldwell Banker Resident...
Pima County, AZ Market Data Report - 2012 December - Coldwell Banker Resident...Pima County, AZ Market Data Report - 2012 December - Coldwell Banker Resident...
Pima County, AZ Market Data Report - 2012 December - Coldwell Banker Resident...
 
How can the American Automotive Association Revive Interest in American aut...
How can the American  Automotive Association Revive Interest in American  aut...How can the American  Automotive Association Revive Interest in American  aut...
How can the American Automotive Association Revive Interest in American aut...
 
Local Foods Strengthen Your Local Economy
Local Foods Strengthen Your Local EconomyLocal Foods Strengthen Your Local Economy
Local Foods Strengthen Your Local Economy
 
Nielsen - Evolving Markets and consumer e-book purchasing behavior
Nielsen - Evolving Markets and consumer e-book purchasing behaviorNielsen - Evolving Markets and consumer e-book purchasing behavior
Nielsen - Evolving Markets and consumer e-book purchasing behavior
 
Retail mania in india
Retail mania in indiaRetail mania in india
Retail mania in india
 
nvr AnnualReport2004
nvr AnnualReport2004nvr AnnualReport2004
nvr AnnualReport2004
 
Daily livestock report aug 24 2012
Daily livestock report aug 24 2012Daily livestock report aug 24 2012
Daily livestock report aug 24 2012
 
Sr mag mar2013stats13022194344.2-6
Sr mag mar2013stats13022194344.2-6Sr mag mar2013stats13022194344.2-6
Sr mag mar2013stats13022194344.2-6
 
pulte homes 91DC7C77-0015-45F1-A981-8387FF35D0E1_phm_InvestorPresentation200812
pulte homes 91DC7C77-0015-45F1-A981-8387FF35D0E1_phm_InvestorPresentation200812pulte homes 91DC7C77-0015-45F1-A981-8387FF35D0E1_phm_InvestorPresentation200812
pulte homes 91DC7C77-0015-45F1-A981-8387FF35D0E1_phm_InvestorPresentation200812
 
Rent vs. Own
Rent vs. OwnRent vs. Own
Rent vs. Own
 

Destacado

T2 famous person keynote
T2 famous person keynoteT2 famous person keynote
T2 famous person keynoteag864608mhs
 
El Negocio De La RestauracióN
El Negocio De La RestauracióNEl Negocio De La RestauracióN
El Negocio De La RestauracióNguestb39533e
 
Design translations
Design translationsDesign translations
Design translationslightningUX
 
Belen Uzair
Belen UzairBelen Uzair
Belen UzairBelis UA
 
El proceso de seguimiento de control de calidad auditores ( y v) documentacion
El proceso de seguimiento de control de calidad auditores ( y v) documentacionEl proceso de seguimiento de control de calidad auditores ( y v) documentacion
El proceso de seguimiento de control de calidad auditores ( y v) documentacionEsteban Uyarra Encalado
 
Probabilidad1
Probabilidad1Probabilidad1
Probabilidad1emtelco
 

Destacado (6)

T2 famous person keynote
T2 famous person keynoteT2 famous person keynote
T2 famous person keynote
 
El Negocio De La RestauracióN
El Negocio De La RestauracióNEl Negocio De La RestauracióN
El Negocio De La RestauracióN
 
Design translations
Design translationsDesign translations
Design translations
 
Belen Uzair
Belen UzairBelen Uzair
Belen Uzair
 
El proceso de seguimiento de control de calidad auditores ( y v) documentacion
El proceso de seguimiento de control de calidad auditores ( y v) documentacionEl proceso de seguimiento de control de calidad auditores ( y v) documentacion
El proceso de seguimiento de control de calidad auditores ( y v) documentacion
 
Probabilidad1
Probabilidad1Probabilidad1
Probabilidad1
 

Victoria Real Estate Market Prices Remain Steady

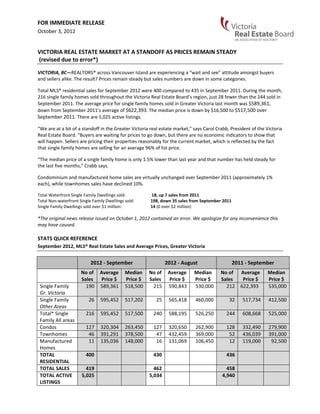
  • 1. FOR IMMEDIATE RELEASE  October 3, 2012                    VICTORIA REAL ESTATE MARKET AT A STANDOFF AS PRICES REMAIN STEADY   (revised due to error*)  VICTORIA, BC—REALTORS® across Vancouver Island are experiencing a “wait and see” attitude amongst buyers  and sellers alike. The result? Prices remain steady but sales numbers are down in some categories.  Total MLS® residential sales for September 2012 were 400 compared to 435 in September 2011. During the month,  216 single family homes sold throughout the Victoria Real Estate Board’s region, just 28 fewer than the 244 sold in  September 2011. The average price for single family homes sold in Greater Victoria last month was $589,361,  down from September 2011’s average of $622,393. The median price is down by $16,500 to $517,500 over  September 2011. There are 5,025 active listings.  “We are at a bit of a standoff in the Greater Victoria real estate market,” says Carol Crabb, President of the Victoria  Real Estate Board. “Buyers are waiting for prices to go down, but there are no economic indicators to show that  will happen. Sellers are pricing their properties reasonably for the current market, which is reflected by the fact  that single family homes are selling for an average 96% of list price.  “The median price of a single family home is only 1.5% lower than last year and that number has held steady for  the last five months,” Crabb says.  Condominium and manufactured home sales are virtually unchanged over September 2011 (approximately 1%  each), while townhomes sales have declined 10%.   Total Waterfront Single Family Dwellings sold:               18, up 7 sales from 2011  Total Non‐waterfront Single Family Dwellings sold:  198, down 35 sales from September 2011  Single Family Dwellings sold over $1 million:  14 (0 over $2 million)    *The original news release issued on October 1, 2012 contained an error. We apologize for any inconvenience this  may have caused.    STATS QUICK REFERENCE  September 2012, MLS® Real Estate Sales and Average Prices, Greater Victoria    2012 ‐ September  2012 ‐ August  2011 ‐ September    No of  Average   Median No of  Average  Median No of  Average  Median  Sales  Price $  Price $  Sales  Price $  Price $  Sales  Price $  Price $  Single Family  190  589,361  518,500 215 590,843 530,000 212  622,393 535,000 Gr. Victoria    Single Family  26  595,452  517,202 25 565,418 460,000 32  517,734 412,500 Other Areas  Total* Single  216  595,452  517,500 240 588,195 526,250 244  608,668 525,000 Family All areas  Condos  127  320,304  263,450 127 320,650 262,900 128  332,490 279,900 Townhomes  46  391,291  378,500 47 432,459 369,000 52  436,039 391,000 Manufactured  11  135,036  148,000 16 131,069 106,450 12  119,000 92,500 Homes  TOTAL  400    430 436  RESIDENTIAL  TOTAL SALES  419    462 458  TOTAL ACTIVE  5,025    5,034 4,940  LISTINGS 
  • 2. 2   ‐  September 2012, MLS® R Real Estate Sales and Six‐Mo onth Average P Prices over August 2012  Number of Sales (Gr. . Victoria only y) September r 2012                COMPAR RED TO AUGU UST 2012                             SINGLE FAMILY        CONDOS  S                 TO OWNHOMES       190             127             42    ‐ 11.63%%                        0%                     ‐ 8.70%  Six‐Mont th Average P Price (Gr. Vic ctoria only) Se eptember 201 12              COMPARED TO AUGUST 2012                                                                  SINGLE FAMILY                       CONDOS      TOWNHOMES S    $599,427 7      $321,73 30 $416,869    ‐ 1.30%          ‐ 0.60% %         ‐ 0.51%  Number of Sales (All Areas) Septe ember 2012                                            CO OMPARED TO AUGUST 201 12                                       SINGLE FAMILY        CONDOS  S                    TOWNHOMES S      216                127               46  ‐ 10.00%                         0%                 ‐ 2.13%  Six‐Mont th Average P Price (All Are eas) September 2012                             CO OMPARED TO O AUGUST 201 12                                                  SINGLE FAMILY         CONDOS S      TOWNHOMES S    $597,2022        $320,7779       $414,338     ‐ 0.82%         ‐ 0.60%                ‐ 0.72%    * Total Sin ngle Family Alll Areas includees Shawnigan Lake/Malaha at, Gulf Islandss and Up Islan nd    While the use of averagee price informaation can be usseful in establis shing trends when applied ov ver a period of f  six months or longer, the Vict time, e.g. s toria Real Estate Board cautions that an av verage price do oes not indicate e the  actual valu ue of any partic cular property.. Those requiring specific info ormation on pr roperty values should contacct a  REALTOR®.  ‐ 30 –    For information:  Maggie Kerrr‐Southin APR  Manager, Communications   al Estate Board   Victoria Rea Direct Phone: 250.920.4652 2; Cell: 250.516.5 5596  Email: mkerrrsouthin@vreb. .org